Chapter 6 Atrial and Ventricular Enlargement
Please go to expertconsult.com for supplemental chapter material.
Cardiac enlargement refers to either dilation of a heart chamber or hypertrophy of the heart muscle:
1. In dilation of a chamber the heart muscle is stretched and the chamber becomes enlarged. For example, with heart failure caused by acute aortic or mitral valve regurgitation, the left ventricle dilates.
2. In cardiac hypertrophy the heart muscle fibers actually increase in size, with resultant enlargement of the chamber. For example, aortic stenosis, which chronically obstructs the outflow of blood from the left ventricle, leads to hypertrophy of the left ventricular muscle.
Both dilation and hypertrophy usually result from some type of chronic pressure or volume load on the heart muscle. In rarer cases, cardiac enlargement can result from genetic abnormalities. Examples include arrhythmogenic right ventricular cardiomyopathy (“dysplasia”) (Chapter 19) and hypertrophic cardiomyopathy syndromes (Chapter 8).
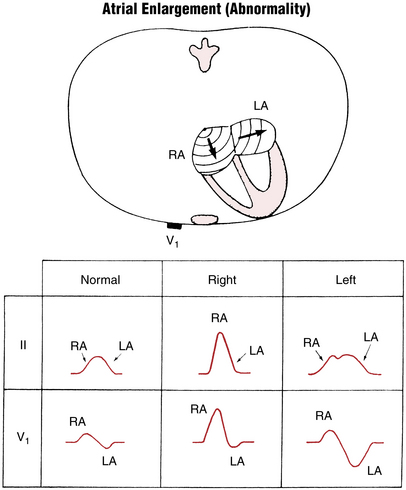
Right Atrial Abnormality
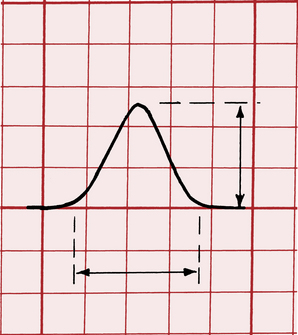
When the P wave is positive, its amplitude is measured in millimeters from the upper level of the baseline, where the P wave begins, to the peak of the wave. A negative P wave is measured from the lower level of the baseline to the lowest point of the P wave. (Measurement of the height and width of the P wave is shown in Fig. 6-1.)
However, because pure RAA generally does not increase the total duration of atrial depolarization, the width of the P wave is normal (less than 0.12 sec). The abnormal P wave in RAA is sometimes referred to as P pulmonale because the atrial enlargement that it signifies often occurs with severe pulmonary disease (Figs. 6-2 and 6-3).
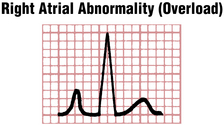
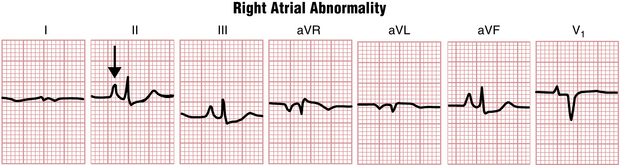
The tall, narrow P waves characteristic of RAA can usually be seen best in leads II, III, aVF, and sometimes V1. The ECG diagnosis of P pulmonale can be made by finding a P wave exceeding 2.5 mm in any of these leads. Echocardiographic evidence, however, indicates that the finding of a tall, peaked P wave does not consistently correlate with RAA. On the other hand, patients may have actual right atrial overload and not tall P waves. In other words, tall peaked P waves are of limited sensitivity and specificity in the diagnosis of right atrial enlargement (see Chapter 23).
Left Atrial Abnormality
Some patients, particularly those with coronary artery disease, may have broad P waves without detectable enlargement of the left atrium. The abnormal P waves probably represent an atrial conduction delay in a normal-sized chamber. Therefore, rather than left atrial enlargement, the more general term left atrial abnormality is recommended to describe these abnormally broad P waves.
Figure 6-4 illustrates the characteristic P wave changes seen in LAA. As shown, the P wave sometimes has a distinctive humped or notched appearance (Fig. 6-4A). The second hump corresponds to the delayed depolarization of the left atrium. These humped P waves are usually best seen in one or more of the extremity leads (Fig. 6-5). The older term P mitrale is sometimes still used to describe wide P waves seen with LAA because these waves were first described in patients with rheumatic mitral valve disease.
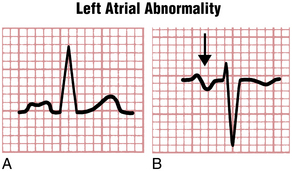
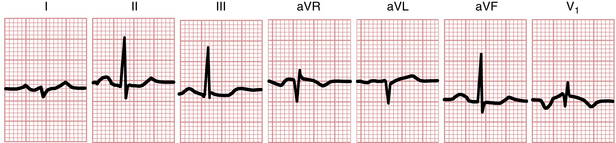
Figure 6-5 Broad, humped P waves from the ECG of a patient with left atrial enlargement (abnormality).
In patients with LAA, lead V1 sometimes shows a distinctive biphasic P wave (see Figs. 6-4B, and 6-6). This wave has a small, initial positive deflection and a prominent, wide negative deflection. The negative component is longer than 0.04 sec in duration or 1 mm or more in depth. The prominent negative deflection corresponds to the delayed stimulation of the enlarged left atrium. Remember that anatomically the left atrium is situated posteriorly, up against the esophagus, whereas the right atrium lies anteriorly, against the sternum. The initial positive deflection of the P wave in lead V1 therefore indicates right atrial depolarization, whereas the deep negative deflection is a result of left atrial depolarization voltages directed posteriorly (away from the positive pole of lead V1).
Key Point
Clinically, LAA may occur in a variety of important settings, including the following:
 Valvular heart disease, particularly aortic stenosis, aortic regurgitation, mitral regurgitation, and mitral stenosis∗
 Hypertensive heart disease, which causes left ventricular enlargement and eventually LAA


∗ With severe mitral stenosis, obstruction to emptying of the left atrial blood into the left ventricle results in a backup of pressure through the pulmonary vessels to the right ventricle. A major clue to mitral stenosis is LAA (or atrial fibrillation) with signs of right ventricular hypertrophy (RVH), as depicted in Figure 23-1.
LAA by ECG, especially when marked, indicates increased risk of atrial fibrillation; conversely, patients with a history of paroxysmal atrial fibrillation not uncommonly have ECG signs of LAA when in sinus rhythm.
The patterns of LAA and RAA are summarized schematically in Figure 6-6.
Right Ventricular Hypertrophy
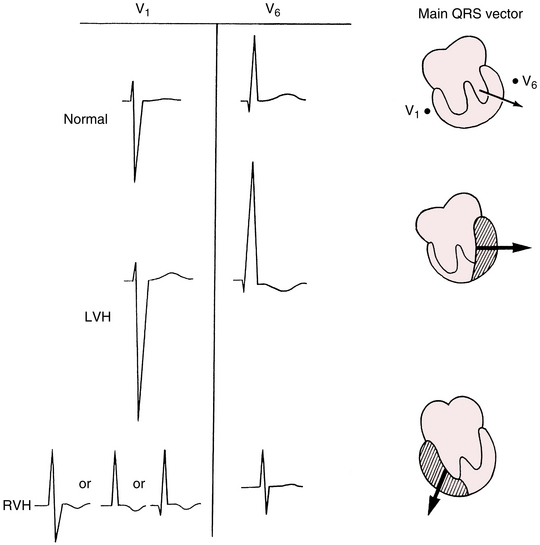
You can predict the ECG changes produced by both right ventricular hypertrophy (RVH) and left ventricular hypertrophy (LVH) based on what you already know about normal QRS patterns. Normally the left and right ventricles depolarize simultaneously, and the left ventricle is electrically predominant because it has greater mass (see Chapter 4). As a result, leads placed over the right side of the chest (e.g., V1) record rS-type complexes:


In this complex the tall positive R wave indicates the predominant depolarization voltages that point to the left and are generated by the left ventricle.
If sufficient hypertrophy of the right ventricle occurs, the normal electrical predominance of the left ventricle can be overcome. In this situation, what type of QRS complex might you expect to see in the right chest leads? With RVH the right chest leads show tall R waves, indicating the spread of positive voltages from the hypertrophied right ventricle toward the right (Fig. 6-7). Figures 6-8 and 6-9 show actual examples of RVH. Instead of the rS complex normally seen in lead V1, a tall positive (R) wave indicates marked hypertrophy of the right ventricle.
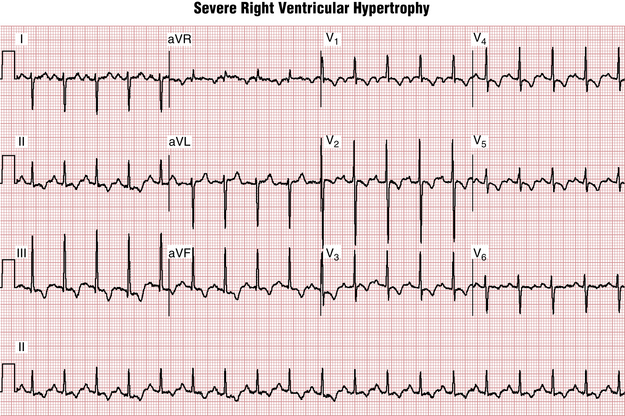
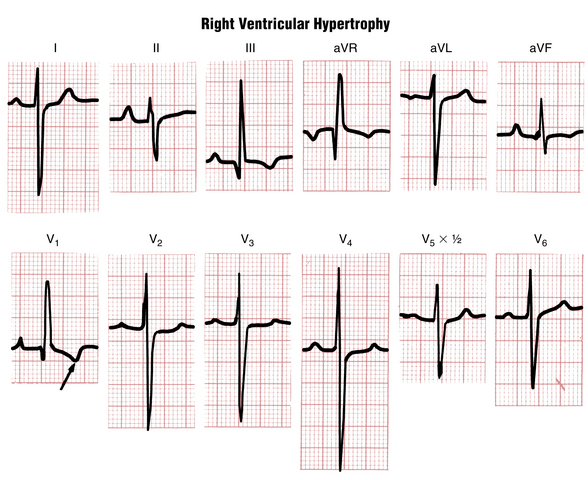
How tall does an R wave in lead V1 have to be to make a diagnosis of RVH? In adults the normal R wave in lead V1 is generally smaller than the S wave in that lead. An R wave exceeding the S wave in lead V1 is suggestive but not diagnostic of RVH. Sometimes a small q wave precedes the tall R wave in lead V1 (see Fig. 6-8).
RVH affects both depolarization (QRS complex) and repolarization (ST-T complex). For reasons not fully understood, hypertrophy of the heart muscle alters the normal sequence of repolarization. With RVH the characteristic repolarization change is the appearance of inverted T waves in the right and middle chest leads (see Figs. 6-8 and 6-9).
With RVH the chest leads to the left of leads showing tall R waves may display a variable pattern. Sometimes the middle and left chest leads show poor R wave progression, with rS or RS complexes all the way to lead V6 (see Fig. 6-9). In other cases, normal R wave progression is preserved and the left chest leads also show R waves (see Fig. 6-8).
Factors causing RVH, such as congenital heart disease or lung disease, also often cause right atrial overload. So, not uncommonly, signs of RVH are accompanied by tall P waves. The major exception to this rule, in which signs of RVH are, paradoxically, accompanied by marked LAA is mitral stenosis, as illustrated in Figure 23-1.
RVH may occur in a variety of clinical settings. An important cause is congenital heart disease,
such as pulmonary stenosis, atrial septal defect,∗ tetralogy of Fallot, or Eisenmenger’s syndrome. Patients with long-standing severe pulmonary disease may have pulmonary artery hypertension and RVH. As noted, mitral stenosis can produce a combination of LAA and RVH. T wave inversions in leads V1 to V3 due to right ventricular overload may also occur without other ECG signs of RVH, as in acute pulmonary embolism (see Chapter 11).
In patients who have right ventricular overload associated with emphysema, the ECG may not show any of the patterns just described. Instead of tall R waves in the right precordial leads, very slow R wave progression is seen. RAD is also commonly present, along with low voltage QRS complexes (see Fig. 11-6).
Left Ventricular Hypertrophy
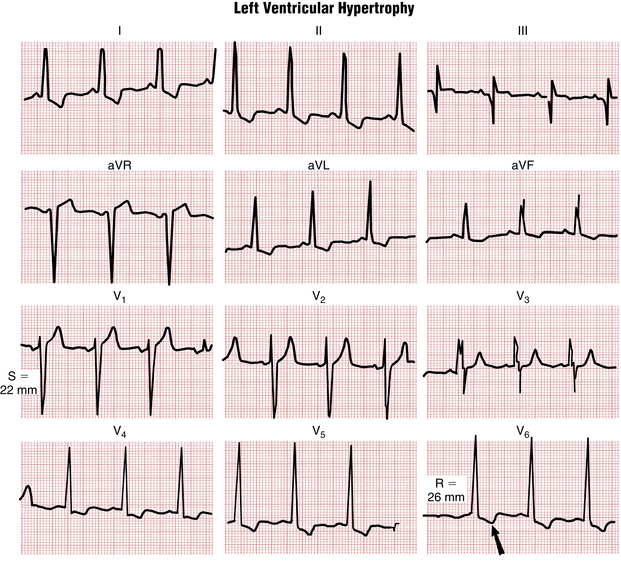
The major ECG changes produced by LVH, like those from RVH, are predictable (see Fig. 6-7). Normally the left ventricle, because of its relatively larger mass, is electrically predominant over the right ventricle. As a result, prominent negative (S) waves are produced in the right chest leads, and tall positive (R) waves are seen in the left chest leads. When LVH is present, the balance of electrical forces is tipped even further to the left. Thus, with LVH, abnormally tall, positive (R) waves are usually seen in the left chest leads, and abnormally deep negative (S) waves are present in the right chest leads.
The following ECG criteria and guidelines have been proposed for the ECG diagnosis of LVH:
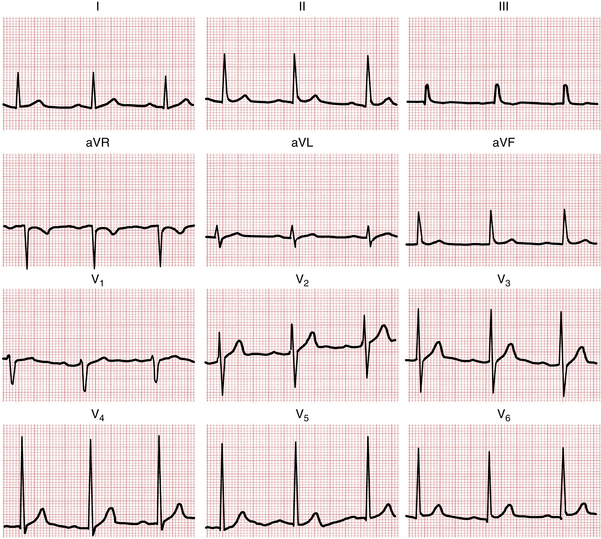
1. If the sum of the depth of the S wave in lead V1 (SV1) and the height of the R wave in either lead V5 or V6 (RV5 or RV6) exceeds 35 mm (3.5 mV), LVH should be considered (Fig. 6-10), especially in middle-aged or older adults. However, high voltage in the chest leads is a common normal finding, particularly in athletic or thin young adults. Consequently, high voltage in the chest leads (SV1 + RV5 or RV6 > 35 mm) is not a specific LVH indicator (Fig. 6-11).
2. Another proposed set of LVH criteria (the Cornell voltage criteria) is based by summing components of the QRS voltages in leads V3 and aVL: for men, SV3 + RaVL > 28 mm; for women, SV3 + RaVL > 20 mm.
3. Sometimes LVH produces tall R waves in lead aVL. An R wave of 11 to 13 mm (1.1 to 1.3 mV) or more in lead aVL is another sign of LVH (see Fig. 6-9). Sometimes a tall R wave in lead aVL is the only ECG sign of LVH, and the voltage in the chest leads is normal. In other cases the chest voltages are abnormally high, with a normal R wave seen in lead aVL.
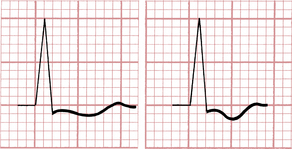
4. Just as RVH is sometimes associated with repolarization abnormalities due to ventricular overload, so ST-T changes are often seen in LVH. Figure 6-12 illustrates the characteristic shape of the ST-T complex with LVH. Notice that the complex usually has a distinctively asymmetrical appearance, with a slight ST segment depression followed by a broadly inverted T wave. In some cases these T wave inversions are very deep. This LV overload-related repolarization abnormality (formerly called LV “strain”) is usually best seen in leads with tall R waves (see Fig. 6-10).
5. With LVH the electrical axis is usually horizontal. Actual left axis deviation (i.e., an axis −30° or more negative) may also be seen. In addition, the QRS complex may become wider. Not uncommonly, patients with LVH eventually develop an incomplete or complete left bundle branch block (LBBB) pattern. Indeed, most patients with LBBB have underlying LVH (see Chapter 7).
6. Finally, signs of LAA (broad P waves in the extremity leads or wide biphasic P waves in lead V1) are often seen in patients with ECG evidence of LVH. Most conditions that lead to LVH ultimately produce left atrial overload as well.
The Ecg in Cardiac Enlargement: A Clinical Perspective
Key Point
The recognition of LVH is clinically important for two major reasons:
1. Diagnostically, LVH is a clue to the presence of a potentially life-threatening pressure or volume overload state. The two most common and important pressure overload states are systemic hypertension and aortic stenosis. The three major clinical conditions associated with left ventricular volume overload are aortic regurgitation, mitral regurgitation, and dilated cardiomyopathy. LVH patterns may also occur with hypertrophic cardiomyopathies.
2. Prognostically, patients with LVH from any cause are at increased risk for major cardiovascular complications, including chronic heart failure and serious atrial or ventricular arrhythmias, including atrial fibrillation and ventricular tachyarrhythmias that may lead to sudden cardiac arrest. As noted, the myocardial fibrosis and neurohormonal abnormalities often accompanying hypertrophy may potentiate both the mechanical decompensation and electrical instability.