Chapter 13 Assessment of Right Ventricular Function
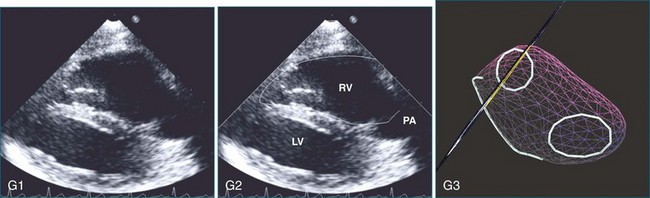
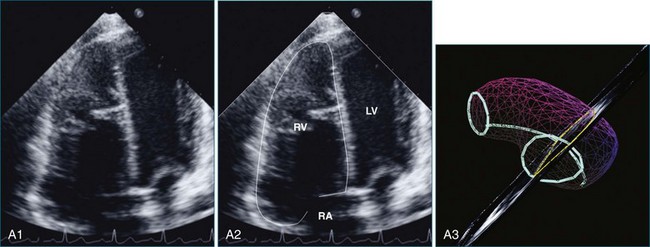
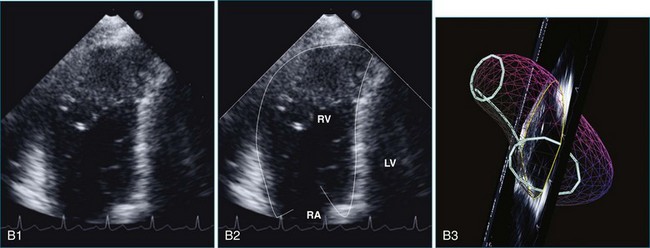
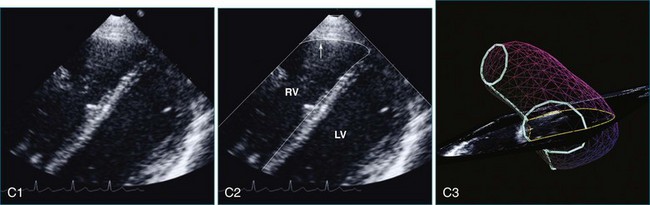
The right ventricle (RV) is often overlooked because most cardiologists focus their attention on the left ventricle (LV). Early work characterizing ventricular anatomy and physiology was performed on the LV and then assumed to be similar in the RV. Methods for measuring ventricular volume and function from the various imaging modalities were similarly developed for the LV and then applied to the RV. However, more recent studies have gradually revealed the differences between the two ventricles, and interest in the RV has risen because of recognition of the impact of RV dysfunction on patient prognosis, the increasing survival of patients with congenital heart disease to adulthood, and the rising incidence of pulmonary hypertension. Although the complex shape of the RV has long been recognized, it could previously only be glimpsed from two-dimensional (2D) images; the recent advent of three-dimensional (3D) surface reconstruction techniques for the RV has enabled new appreciation for the variety of phenotypes in which the RV can present in various conditions (Figure 13-1).
Visualization of the Right Ventricle
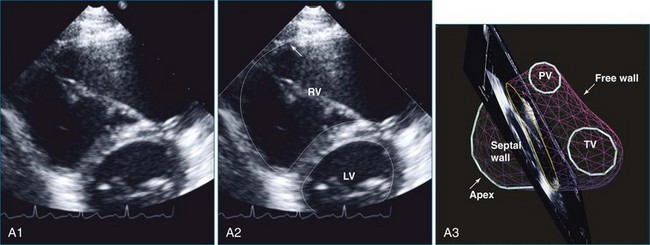
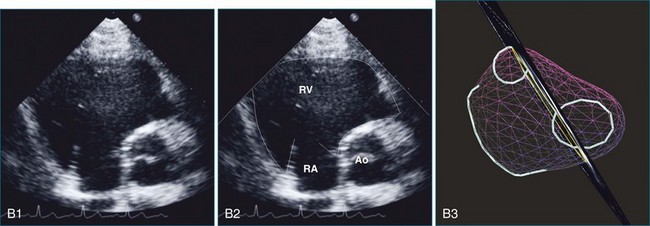
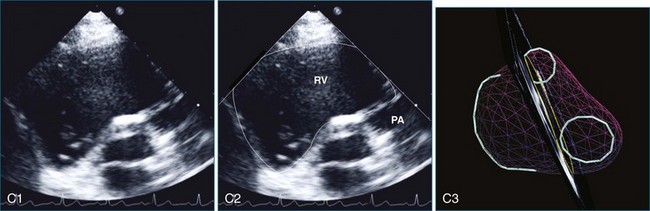
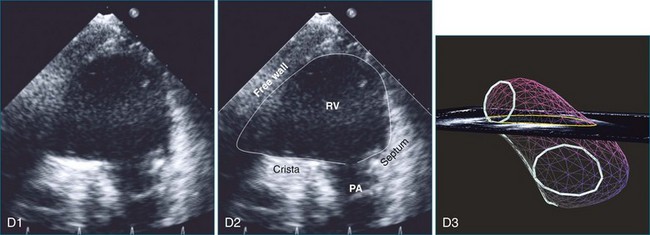
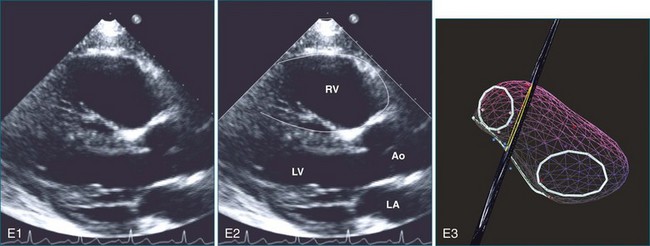
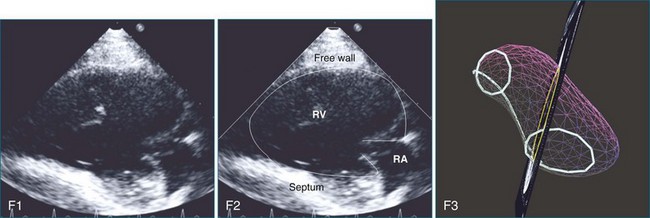
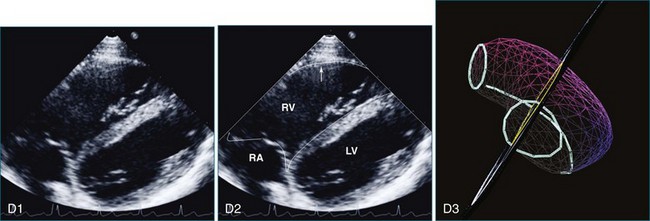
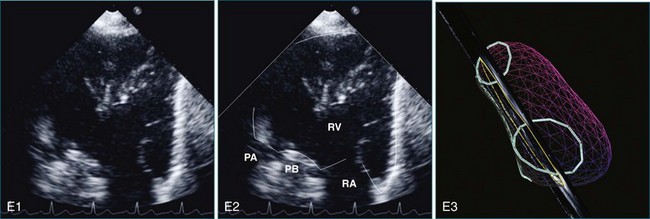
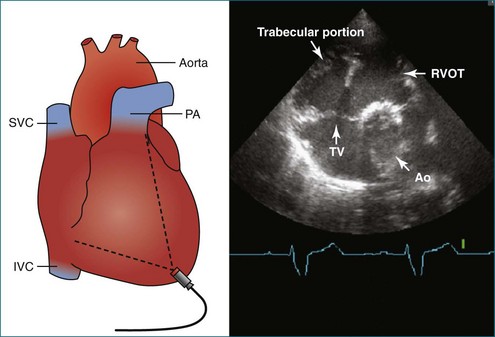
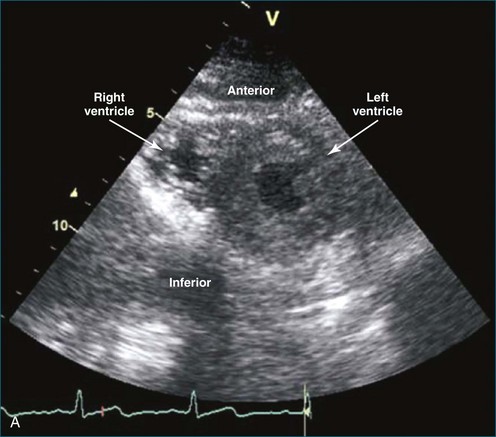
The sector width in current ultrasound equipment is too narrow to contain both the LV and RV. Therefore, when acquiring the ultrasound study, it is necessary to ensure that the RV is completely visualized. This is easily accomplished by centering the view on the RV in both parasternal (Figure 13-2) and apical views (Figure 13-3).1 Additional nonstandard views may be needed in patients with RV dilation. The four-chamber view can visualize the cardiac apex in normal hearts. However, centering of the RV is needed to visualize the apical bulging that may occur in hemodynamic overload states (see Figure 13-3).2
Volume Measurement
Two-Dimensional Approaches
The RV is notorious for its complex shape, which defies comparison with a geometric reference figure. In contrast, LV volume can be accurately measured from single or biplane views by comparison with an ellipsoid of revolution using the area-length method.3 Early attempts to measure RV volume from angiograms used the formula V = kA1A2/L, where A1 and A2 are the areas of the RV in the two views, L is the length of the RV long axis, and k is a constant. Depending on the value of k and how L is defined, the RV was compared with a parallelepiped, ellipsoid of revolution (area-length method), triangular prism, or pyramid.4–6 When these methods were compared with in vitro hearts or models, the disk summation method proved to be the most accurate.7,8 The area-length method also performed well from the projection views of angiograms but proved inaccurate on 2D echocardiograms.9
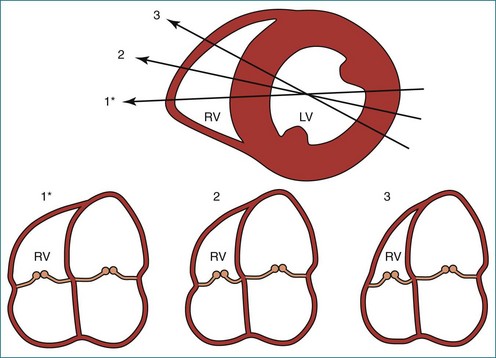
Models that take advantage of ultrasound’s tomographic, rather than projection, imaging were also developed. Levine and colleagues wrote: “A geometric structure can be constructed resembling the right ventricle with respect to its overall form and body segment, and such a structure can have a volume equal to 2AL/3 without unreasonable restriction of its dimensions,” where A is the area in one view and L spans the RV in the other, roughly orthogonal view (Figure 13-4).10,11 However, these models require subcostal views that may be obtainable in only 52% of patients older than 5 years.9
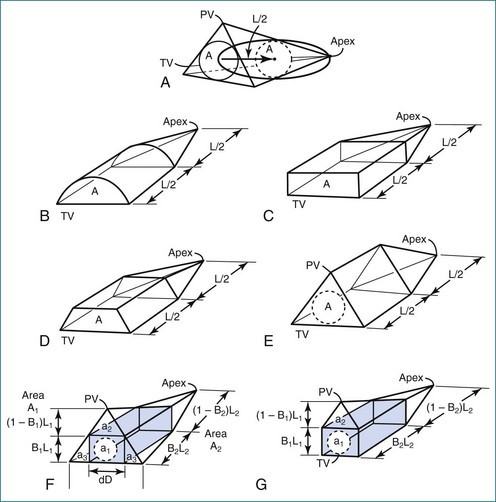
Figure 13-4 Geometric models with volume = 2AL/3. PV, pulmonary valve; TV, tricuspid valve.
(From Levine RA, Gibson TC, Aretz T, et al: Echocardiographic measurement of right ventricular volume. Circulation 69:497–505, 1984.)
Because of the inaccuracy in volume measurement, assessment of right ventricular ejection fraction (RVEF) based on 2D echocardiography (2DE) is not recommended.1,9,12 Instead, visual assessment is performed to gauge RV size relative to that of the LV (Figure 13-5; Video 13-1).13 Normally, the RV is only two thirds the size of the LV in the apical four-chamber view; the LV forms the apex of the heart and is round in short-axis views throughout the cardiac cycle. Deviations from this pattern may indicate RV dilation, but careful examination of multiple views is recommended for confirmation of the diagnosis because the size of the RV varies with the angle of the plane (Figure 13-6).1
Three-Dimensional Approaches
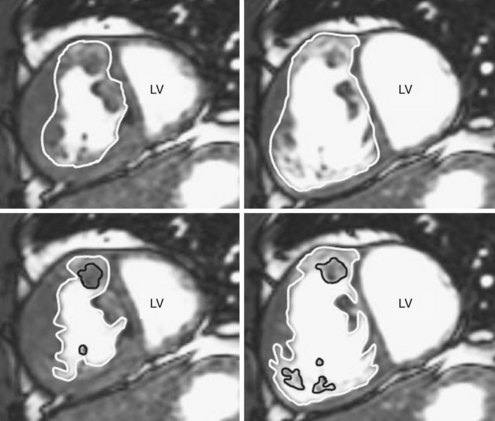
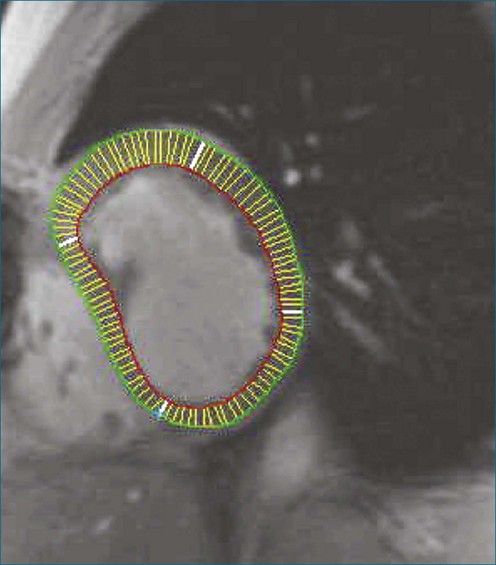
3D analysis entails delineating the RV from multiple views, a time-consuming task that is rendered more difficult by heavy trabeculations, particularly in hypertrophied RVs. For analysis of magnetic resonance imaging (MRI) scans, a recommendation has been made to trace the endocardial contour outside the trabeculations to maximize reproducibility (Figure 13-7).14 Another issue is the definition of end systole. Because of the asynchronous contraction of the sinus and infundibulum, the timing of minimum chamber area will vary from region to region and from slice to slice.15 However, frame-by-frame analysis has shown that selection of this time point from the four-chamber view and application of its systolic interval to the entire RV provide a highly accurate measurement of end-systolic volume.16
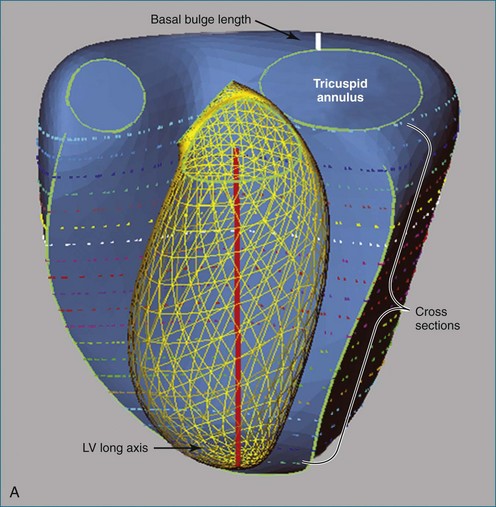
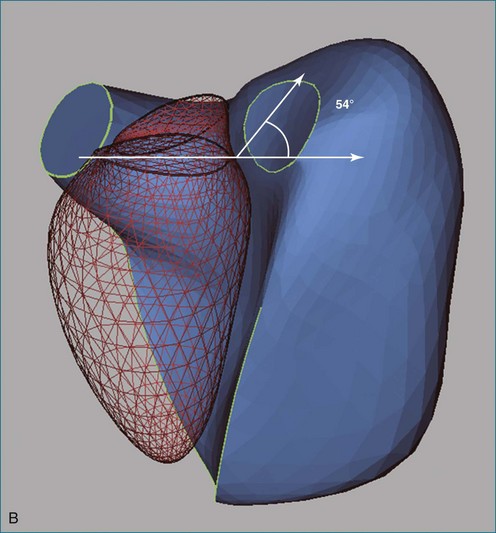
The disk summation method avoids assumptions concerning the shape of the RV because it does not compare the RV to a geometric figure, although it does assume that the cross-sectional contour is elliptical or hemielliptical.17–19 Consequently, even pathologically misshapen ventricles, which are commonly found in congenital heart defects, can be accurately measured. The contours of the RV endocardium are traced from parallel views, the area of each contour is multiplied by the interplanar distance to compute the volume of each “slice,” and the slice volumes are summed to compute the volume of the RV. With echocardiography, the RV is sliced into parallel short-axis views. For MRI, alternate-slice prescriptions have been advocated to more easily visualize the tricuspid annulus and define the basal limits of the RV.20 A disadvantage of 3DE performed with a matrix array transducer is that the RV cannot be imaged in its entirety in a significant number of adult patients within the single apical scan that is most commonly used to acquire the image data. This disadvantage is particularly present when the RV is enlarged, the exact situation in which quantification of RV function is important. For both echocardiography and MRI, it is advisable to trace additional views orthogonal to the short-axis “stack” for assistance in delineating the apex, the structures in the basal slice, and the basal bulge (Figure 13-8).21 Although the RV might be visualized in RV-centered images alone, this should only be done when it is certain that the LV does not need to be visualized.

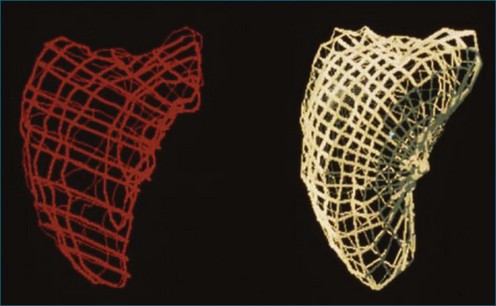
An alternative to volumetric 3DE is acquisition of multiple 2D views while tracking the spatial location and orientation of the view planes for offline processing. The RV endocardial surface is reconstructed after tracing the images, and volume is computed from the 3D surface. An advantage of this approach is the use of freehand scanning so that views providing optimal image quality are acquired. As for analysis of volumetric datasets using disk summation, multiple views must be traced. Three methods have been validated for 3D reconstruction of the RV from manually traced borders. The method of Jiang and associates22 was based on deforming a spherical template to fit traced borders (Figure 13-9). The method was highly accurate on in vivo testing (r = 0.99 for end-diastolic volume; r = 0.98 for end-systolic volume; r = 0.98 for ejection fraction (EF); and r = 0.985 for RV free wall mass).
Buckey and colleagues23 swept the RV from a fixed transducer location in five-degree increments to define a series of wedges whose volumes were computed and summed to determine the RV volume. Accuracy in vitro was excellent (r = 0.95 and r = 0.96, respectively, for short-axis and apical scanning), but the entire RV had to be visualized from a single transducer position.
In the piecewise smooth subdivision surface (PSSS) method, a triangulated control mesh is designed as a model that is fit to traced borders. Parts of the control mesh can be marked as sharp around valve orifices and along the RV free wall to the septal edge (Figure 13-10). The PSSS method’s accuracy for RV volume and mass has been validated (r = 0.99 and r = 0.93, respectively), and it is the only method shown to reproduce the 3D shape of the LV and the RV with anatomic accuracy.24,25
Although these three techniques are accurate for measuring RV volume, the requirement for tracing the RV border in multiple images has precluded their clinical application. One approach for reducing the human workload is to reduce the number of borders that need be traced. However, after comparing the results obtained with disk summation over 2 to 16 slices, Chen and associates26 still found eight slices to be the “optimal choice for accurate and convenient measurement” of mass as well as volume.
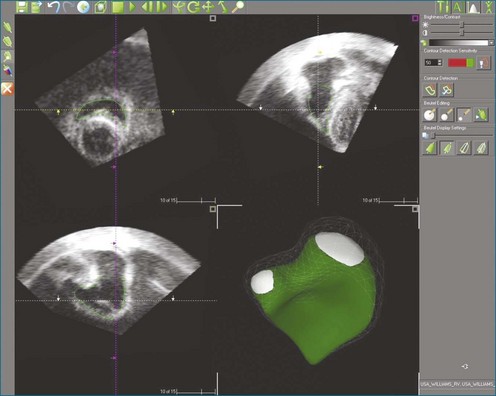
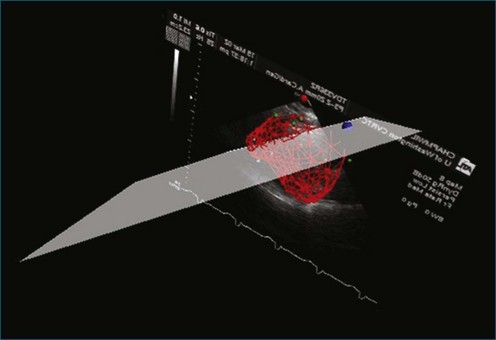
Automated border detection has been stymied by the inherently noisy nature of the images, the frequent signal dropout, and the heavy trabeculation of the RV. However, TomTec Imaging Systems (Munich, Germany) markets a semiautomated method applicable to 3DE (Figure 13-11) that has been extensively validated.27–29
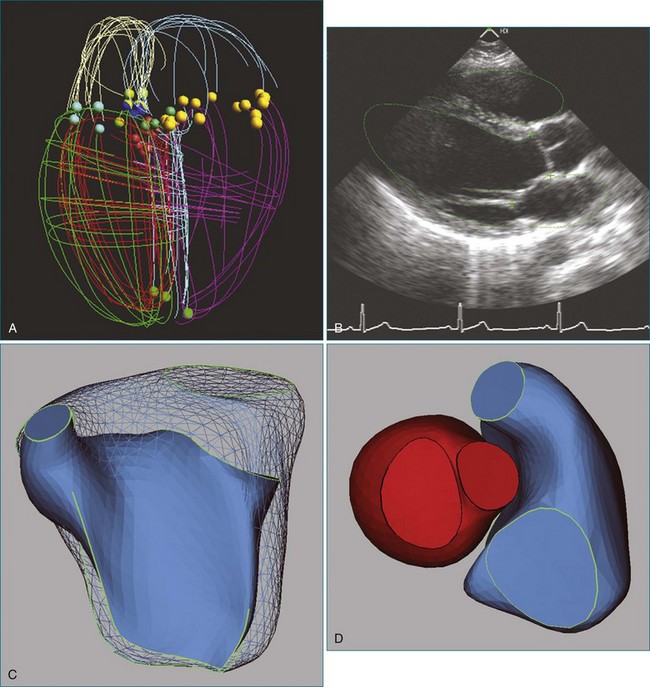
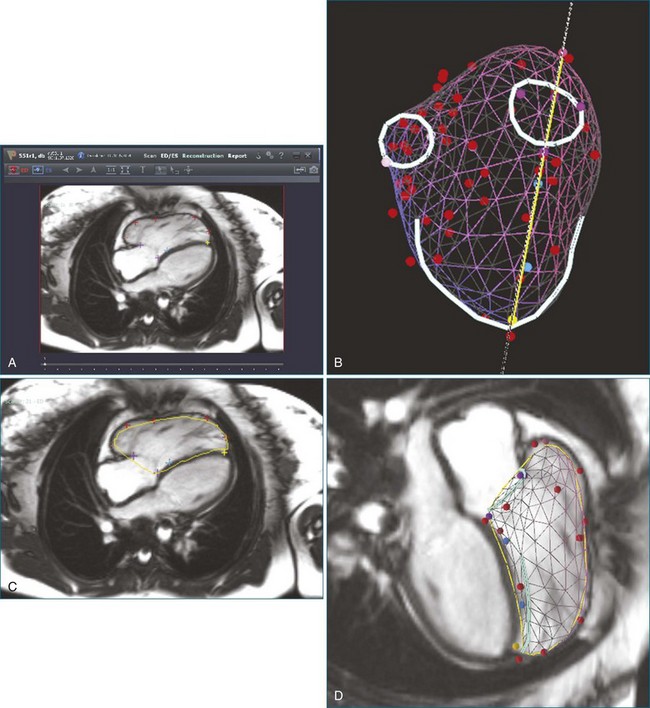
An alternative approach to reducing the workload of manual tracing is to use knowledge of the expected shape of the RV and the range of shapes that it can adopt in disease processes. The method marketed by VentriPoint, Inc. (Seattle, WA) is semiautomated like TomTec’s, but the user traces points at anatomic landmarks (Figure 13-12) rather than whole borders.30
Function Measurement
The American Society of Echocardiography’s guidelines state that “in selected patients with RV dilation or dysfunction, 3DE using the disk summation method may be used to report RVEF.”1 However, 3DE is not universally available, so surrogate parameters based on a single 2D view have been proposed for estimation of global RV function. The analysis usually is performed on the apical four-chamber view because of the predominantly longitudinal contractile pattern of the RV, which lacks the LV’s middle layer of circumferential fibers.31,32 The most commonly used parameters are fractional area change and tricuspid annular plane systolic descent (TAPSE).33
A major disadvantage of the single-view approach to RV function assessment is that it provides a limited perspective. The relationship between TAPSE and EF, for example, is weak if there is tricuspid regurgitation or if longitudinal shortening of the RV differs from the function of regions not visualized in the four-chamber view.34,35 In both volume and pressure overload, analysis of short-axis contours has shown dilation and dysfunction, whereas longitudinal analysis showed poor correlation between TAPSE and EF.36,37 Also, the function of other regions may exert a more powerful effect on patient outcome than would longitudinal contraction. For example, akinesis of the right ventricular outflow track (RVOT) is associated with a poor prognosis in repaired tetralogy of Fallot, and some advocate measuring fractional area shortening from a modified short-axis view that visualizes the outflow tract (Figure 13-13).38,39 Another example of discordance between TAPSE and clinical outcome is a study of patients undergoing mitral valve surgery; their RVEF was unchanged after the procedure in agreement with their lack of significant complications, but TAPSE dropped significantly.40
Another disadvantage of the single-view approach to assessing RV function is that the reliability and reproducibility depend on the examiner’s ability to acquire the specified view. One study found that 95% of apical two-chamber views were foreshortened and underestimated LV volume.41 Another study reported that even experienced examiners achieved optimal imaging, defined as ideal plane position ±5 mm and ideal plane angle ±15 degrees, in only 32% and 48% of studies, respectively.42 Even when care is taken to acquire a specified view correctly, such as by maximizing RV chamber area in the four-chamber view, the anatomic location of that image plane in the 3D heart cannot be verified from the 2D image. This introduces variability when assessing change in a patient’s RV status between serial studies. Use of a visual guidance system to assist in locating the apical four-chamber view without foreshortening has improved accuracy in RV volume determination (Figure 13-14).43
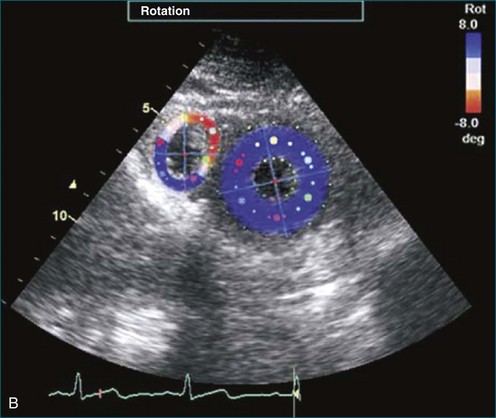
The complex shape of the RV has made it difficult to analyze regional function. Because of the underlying assumptions concerning ventricular shape, few of the geometric models developed for 2D images of the LV can be applied to the RV. For example, radial coordinate systems do not fit short-axis views of the RV because of the sharp angles at the junction of the septal and free walls. Similarly, rectangular coordinate systems do not fit crescentic contours either. An exception is RV torsion, which can be measured using speckle tracking, as with LV torsion (Figure 13-15).44 The only method that has been successfully applied for measuring regional RV function in both long-axis and short-axis views is the centerline method, which does not rely on geometric assumptions about RV shape (Figure 13-16); it is also applicable to multiple imaging modalities (angiograms, echo images, and MRI).45–48
The most accurate method for analyzing the 3D pattern of regional RV function is tagging with MRI. Studies using this modality have documented the regional heterogeneity of tagging wall motion, confirmed the greater long-axis shortening than short-axis shortening, quantified torsion, and evaluated functional abnormality in a few disease conditions.31,32,49–52
For clinical imaging, investigators have developed a multiplicity of methods for assessing regional RV function from 3D image datasets. Some have applied 2D methods to multiple short-axis views.36,48 Others have calculated regional EFs after subdividing the RV volume.15,53 A third approach is to measure RV free wall motion from 3D surface reconstructions along vectors orthogonal to the endocardium at end diastole.54
The multiplicity of methods extends to segmentation. Although consensus has been reached on a segmental model corresponding to coronary artery perfusion territories, studies of regional RV function in other conditions have analyzed 2, 3, 4, 7, 9, or 12 regions.1,15,48,50,52,53,55,56 Some studies divided the RV free wall geometrically into circumferential regions (superior, middle, inferior), vertical regions (apical, mid, basal), or both. Others used anatomic landmarks to segment the RV into inlet, trabecular, and outlet portions (Figure 13-17).15,53 Thus, the study of regional RV function remains an area of active investigation.
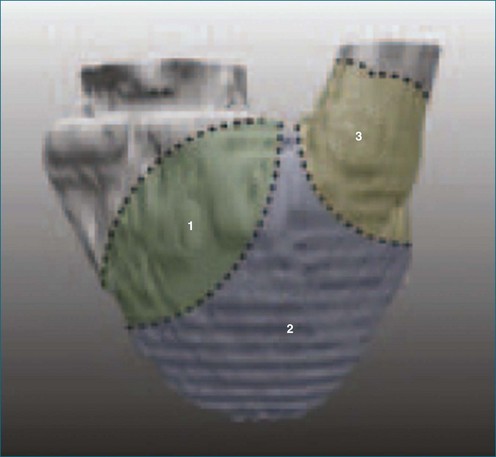
Figure 13-17 Diagram of the right ventricle illustrating its component parts. 1, inlet; 2, apical trabecular; 3, outlet.
(From Bodhey NK, Beerbaum P, Sarikouch S, et al: Functional analysis of the components of the right ventricle in the setting of tetralogy of Fallot. Circ Cardiovasc Imag 1:141–147, 2008.)
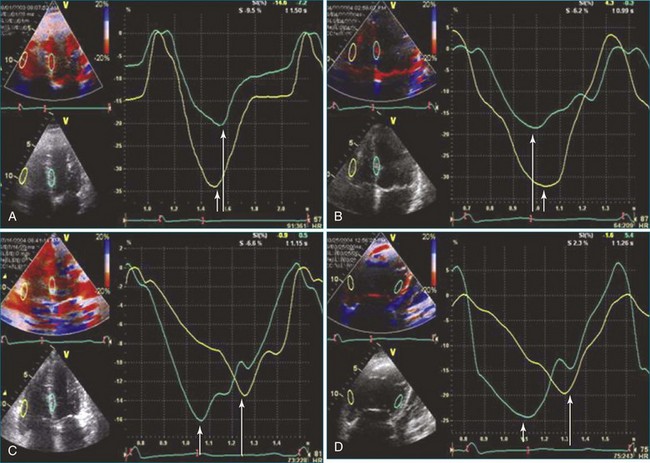
An alternative to assessing endocardial excursion or wall thickening is tissue Doppler imaging for assessment of 2D strain (Figure 13-18). The speckle-tracking echocardiographic modality is angle independent as well as independent of interference from cardiac translation and tethering and can be applied to assess longitudinal contraction, similar to TAPSE. A promising application of speckle tracking is to assess contractile dyssynchrony (see Figure 13-18).
Shape Measurement
Ventricular remodeling is the term applied to the compensatory hypertrophy and dilation that maintain cardiac output in overload states. The term encompasses changes in chamber dimensions, wall thickness, and shape caused by microscopic changes in myocytes and the extracellular matrix. In the LV, the shape changes have been attributed to redistribution of stress.57 The distribution of wall stress in the myocardium affects ventricular function, myocardial oxygen demand, coronary blood flow, vulnerability to injury, remodeling, and action potential shape.58,59 The analysis of regional ventricular stress is currently performed by using mathematical modeling of the determinants, including finite element analysis. Most of the work in this field has been performed on the more easily modeled LV, and the RV was assumed to be similar. Study of the RV has been impeded by its complex shape, which has resisted simple geometric modeling.
Most of the research on RV shape has reported on the effect of pressure overload on the curvature of the interventricular septum as viewed in 2D on a cross-sectional view, which showed that metrics of septal curvature are predictive of elevated pulmonary artery pressure.60
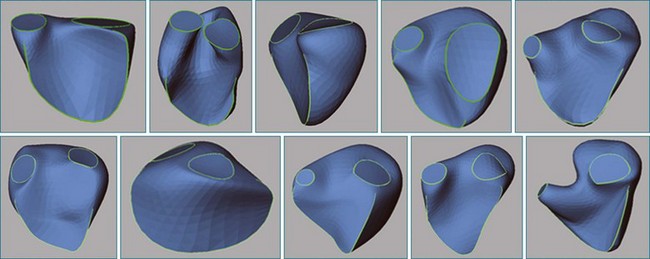
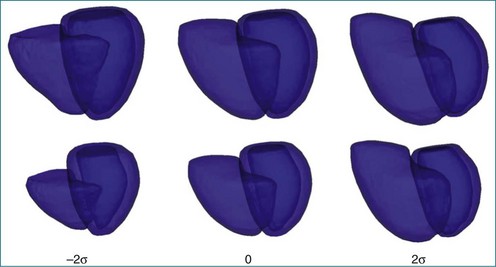
Finite element analysis techniques have been applied to characterize RV shape in 3D in the normal heart and in disease conditions.49,61 However, these studies were performed on parallel short-axis MRI and excluded the basal portion of the RV. Principal component analysis also has been used to characterize RV shape in terms of the modes of shape variation in a population (Figure 13-19).62 In addition, descriptive methods have been developed, as for 2DE, to quantify abnormalities in RV shape that are discernible from visual examination of 3D reconstructions in hemodynamic overload and intrinsic diseases (Figure 13-20).2 Normal values for these and LV shape parameters have been published.63
Conditions Affecting the Right Ventricle
Volume Overload: Tetralogy of Fallot
Tetralogy of Fallot (TOF) (Video 13-2) is the most common cause of cyanotic congenital heart disease. As a result of advanced surgical repair techniques, the rate of survival to adulthood now exceeds 80%. However, the procedure performed to widen the RVOT may destroy pulmonary valve competency. Over time, the volume overload from pulmonary regurgitation leads to RV dilation and dysfunction. RV volume overload has long been known to alter septal shape, as seen in the short-axis view, with changes ranging from slight flattening to curvature reversal (Figure 13-21, A).64 In addition, the free wall bulges at the base (see Figure 13-20, A) and at the apex, producing an “apex-forming” RV (see Figure 13-21, B to D).2,53 The RV cross-section is increased in area and rounded from the apex to the mid-ventricle area (Figure 13-22). Analysis of the RV’s 3D shape reveals an additional change: tilting of the tricuspid annulus (see Figure 13-20, B).2
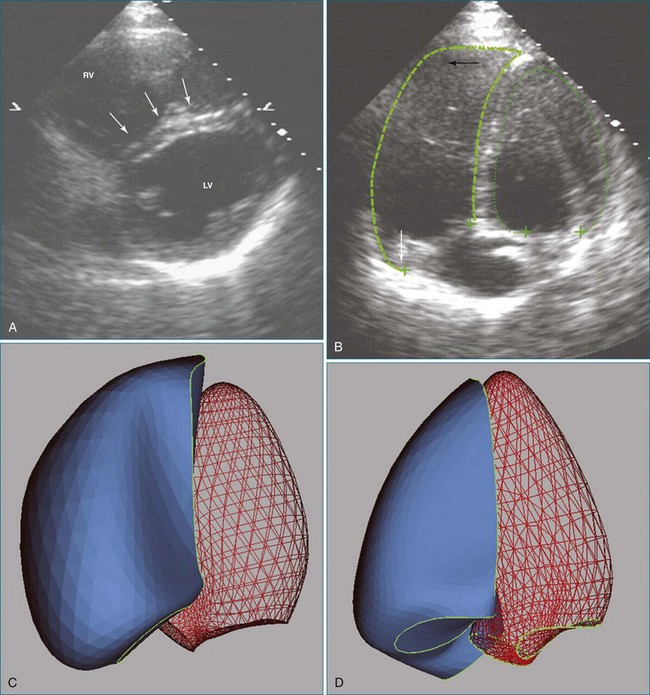
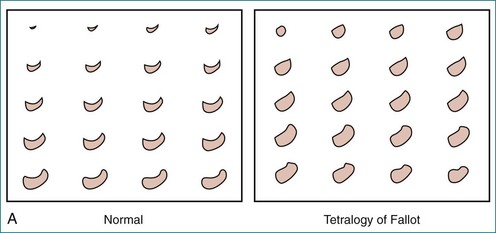
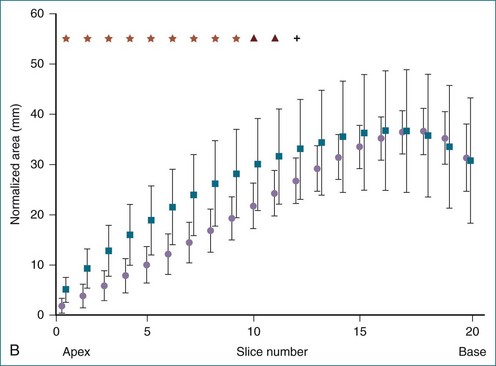
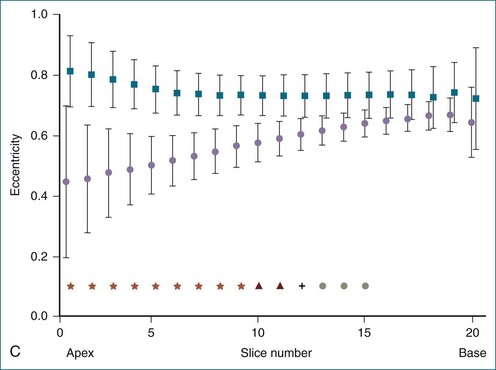
Figure 13-22 Quantitative three-dimensional analysis of right ventricular (RV) shape in tetralogy of Fallot (TOF). A, RV shape at 20 cross-sections created by the method shown in Figure 13-20 in a normal subject and in a patient with TOF. RV dilation and apical rounding in TOF are illustrated. The septal surface is above, the free wall below, the tricuspid valve to the left, and the pulmonary valve to the right. B, Normalized end-diastolic cross-sectional area is significantly (*P < .01) greater in patients with TOF (squares) than normal (circles) in the apical half of the RV. C, Eccentricity of the end-diastolic cross-section. The RV cross-section was more circular in patients with TOF (squares) (*P < .05) than in normal subjects (circles).
(From Sheehan FH, Ge S, Vick GW, III, et al: Three-dimensional shape analysis of right ventricular remodeling in repaired tetralogy of Fallot. Am J Cardiol 101:107–113, 2008.)
The changes in RV shape are accompanied by global dysfunction and altered pattern of region contraction. The EF of the outlet portion is depressed and is associated with increased risk of tachyarrhythmias.53,54 There is hypokinesis at the mid- and apical free wall region, with relative sparing of the basal region.36,52 Both the severity of regional dysfunction and the area of dysfunction contribute to depressing the global EF.54 The alteration in regional contraction pattern may explain the weak correlation of TAPSE with RVEF.36
Pressure Overload: Pulmonary Hypertension
The response of the RV to chronic pressure overload is initial compensatory hypertrophy with preserved function, but continued pressure overload leads to RV and right atrial dilation, tricuspid regurgitation, and failure. Findings seen on 2DE are septal flattening or curvature reversal (Figures 13-23 to 13-25; Videos 13-3 and 13-4), diminished longitudinal contraction (Figure 13-26), and increased dependence of the global EF on transverse contraction.37,60 In the apical four-chamber view, broadening of the apical angle correlates with RV dysfunction measured in terms of fractional area change in the same view (Figure 13-27).65 The observations on RV shape and function from 2DE have been confirmed by 3D analyses showing reduced global RVEF and rounding of the RV in cross-section (Figure 13-28).66
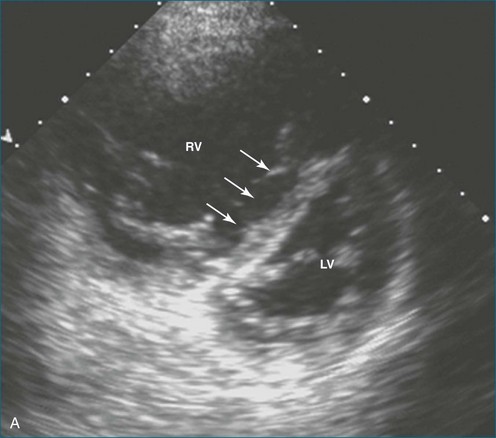
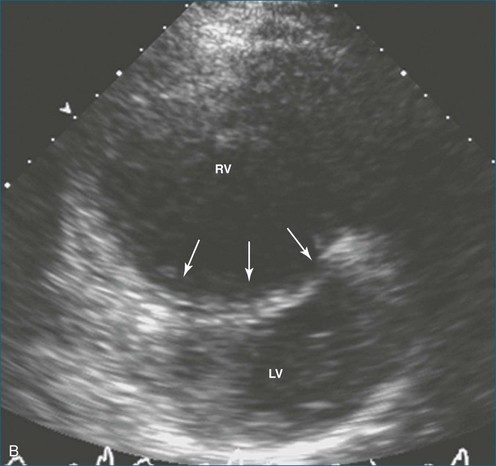
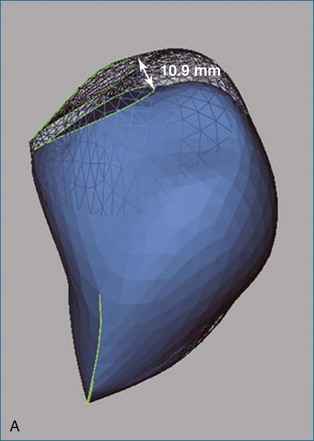
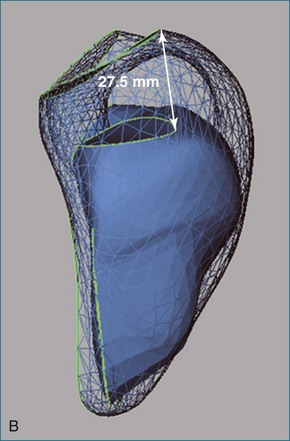
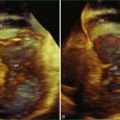
Figure 13-26 Reduced longitudinal contraction in a patient with pulmonary hypertension (A) compared with normal (B).
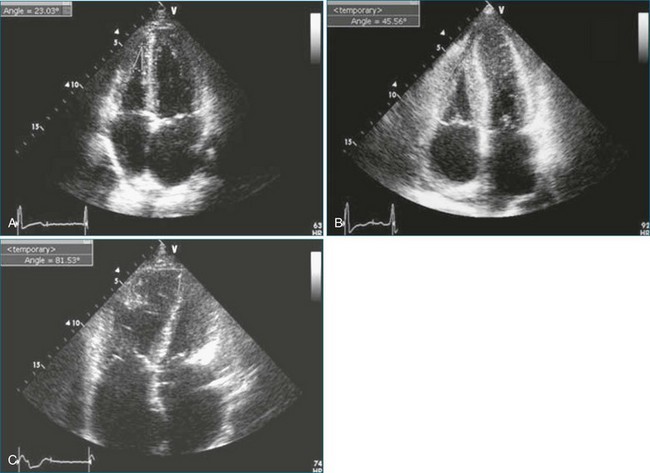
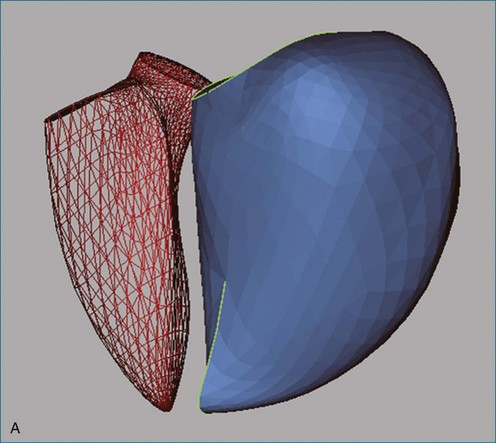
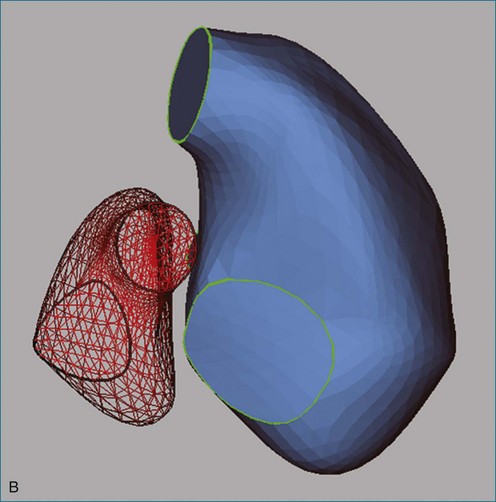
Figure 13-28 The right ventricle (RV) in pulmonary hypertension. A, Rounding of the RV as seen from reconstructions of the left ventricle (LV, red mesh) and RV (blue surface) in the same patient as in Figure 13-3 and in the same orientation. The RV end-diastolic volume index is 134 mL/m2, and the ejection fraction is 10%. B, Reconstructions of the same patient as seen from the atria looking toward the apex. Septal flattening is clear from the shape of the LV.
More recent studies have sought to assess the prognostic power of parameters of shape, function, or both. In a serial study following diagnosis, it was found that patients who died within 4 years had RV dilation and decreased EF; however, the drop in function was caused by diminution of transverse contraction—not of TAPSE—from progressive septal bowing.67 Thus, analysis of RV shape helps elucidate the mechanism of the RV response.
Ischemic Heart Disease and Heart Failure
Attention usually is focused solely on the LV in ischemic heart disease and heart failure. RV dysfunction in ischemic heart disease usually is secondary to elevated filling pressure, but the RV may develop regional hypokinesis from coronary occlusion. Experimental studies have shown that a more proximal occlusion of the right coronary artery produces a larger wall motion defect, but the size of the defect in RV ischemia is excessive for the size of the infarction.68 Despite severe free wall dysfunction, global RV function recovers early after occlusion because of stiffening of the free wall. Clinically, most patients recover, whether or not the right coronary artery is reperfused.69
A segmentation plan has recently been developed on the basis of ischemic dysfunction patterns for the RV (Figure 13-29).1 This plan differs completely from segmentation based on muscle anatomy (see Figure 13-17). RV remodeling appears to follow the former; pulmonary hypertension secondary to LV dysfunction is associated with RV dilation in the basal region, with relative apical sparing (Figure 13-30).70
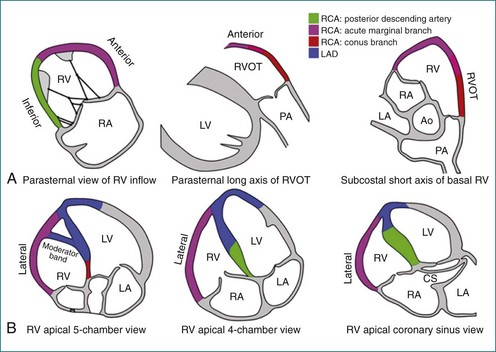
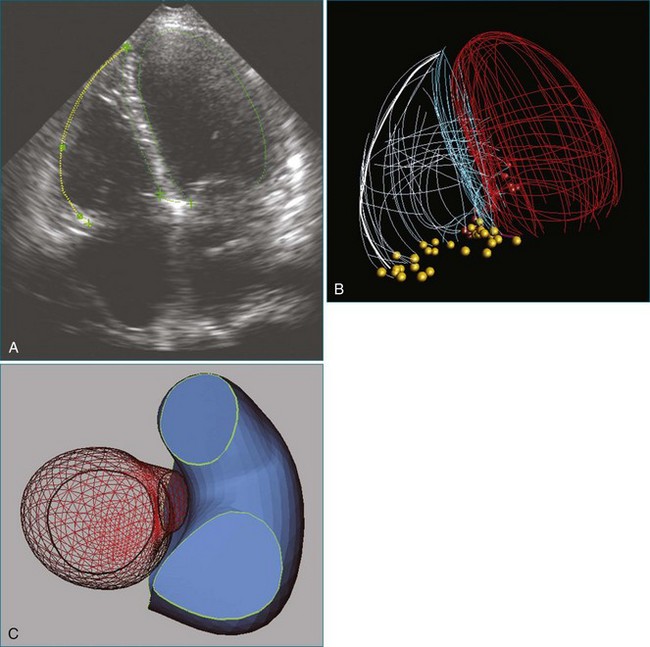
Figure 13-30 The right ventricle (RV) in heart failure. A, Four-chamber view of a patient with ischemic cardiomyopathy. RV dilation (end-diastolic volume index [EDVI] of 122 mL/m2 vs. 93 ± 20 mL/m2 in normal subjects63) is difficult to appreciate visually because the left ventricle (LV) is also dilated (EDVI of 89 mL/m2 vs. 77 ± 17 mL/m2 in normal subjects). B, Wire mesh display of the borders of the RV and LV traced from multiple echocardiographic views in the same patient showing that the four-chamber view (highlighted) is representative of LV and RV areas. C, RV dilation is more evident in three-dimensional reconstructions of the LV and RV viewed from the atria toward the apex. The patient’s RV ejection fraction was 35% (normal, 47% ± 8%); LV ejection fraction was 33% (normal, 56% ± 10%). Ao, aorta; CS, coronary sinus; LA, left atrium; LAD, left anterior descending artery; LV, left ventricle; PA, pulmonary artery; RA, right atrium; RCA, right coronary artery; RVOT, right ventricular outflow tract.
In heart failure, the RV may be involved either directly or secondarily. In a study of patients with acute class III or IV LV failure, 42% had RV failure and were more likely to have right atrial enlargement, elevated pulmonary artery systolic pressure, and tricuspid regurgitation.71 RVEF is lower in nonischemic cardiomyopathy, presumably because both ventricles are involved in the primary condition.72
Many studies have shown that involvement of the RV in ischemic heart disease, heart failure, and other conditions denotes a poorer prognosis.73 The use of imaging to help with identification of those at risk of developing RV failure may be useful in their management. For example, the development of RV failure in patients receiving an LV assist device is a major contributor of morbidity and mortality.74 Also, preoperative assessment of RV function may help predict which patients are likely to require additional resources after bypass surgery.75
1 Rudski LG, Lai WW, Afilalo J, et al. Guidelines for the echocardiographic assessment of the right heart in adults: A report from the American Society of Echocardiography. J Am Soc Echocardiogr. 2010;23:685–713.
2 Sheehan FH, Ge S, Vick GW, III., et al. Three-dimensional shape analysis of right ventricular remodeling in repaired tetralogy of Fallot. Am J Cardiol. 2008;101:107–113.
3 Dodge HT, Sandler H, Ballew DW, Lord JD, Jr. The use of biplane angiocardiography for the measurement of left ventricular volume in man. Am Heart J. 1960;60:762–776.
4 Arcilla RA, Tsai P, Thilenius O, Ranniger K. Angiographic method for volume estimation of right and left ventricles. Chest. 1971;60:446–454.
5 Fisher EA, DuBrow IW, Hastreiter AR. Right ventricular volume in congenital heart disease. Am J Cardiol. 1975;36:67–75.
6 Ferlinz J, Gorlin R, Cohn PF, Herman MW. Right ventricular performance in patients with coronary artery disease. Circulation. 1975;52:608–615.
7 Wellnhofer E, Ewart P, Hug J, et al. Evaluation of new software for angiographic determination of right ventricular volumes. Int J Cardiovasc Imag. 2005;21:575–585.
8 Sheehan FH, Bolson EL. Measurement of right ventricular volume from contrast ventriculograms: In vitro validation by cast and 3 dimensional echo. Cathet Cardiovasc Interven. 2004;62:46–51.
9 Helbing WA, Bosch HG, Maliepaard C, et al. Comparison of echocardiographic methods with magnetic resonance imaging for assessment of right ventricular function in children. Am J Cardiol. 1995;76:589–594.
10 Levine RA, Gibson TC, Aretz T, et al. Echocardiographic measurement of right ventricular volume. Circulation. 1984;69:497–505.
11 Denslow S. An ellipsoidal shell model for volume estimation of the right ventricle from magnetic resonance images. Acad Radiol. 1994;1:345–351.
12 Aebischer N, Meuli R, Jeanrenaud X, et al. An echocardiographic and magnetic resonance imaging comparative study of right ventricular volume determination. Int J Card Imag. 1998;14:271–278.
13 Lang RM, Bierig M, Devereux RB, et al. Recommendations for chamber quantification: A report from the American Society of Echocardiography’s guidelines and standards committee and the chamber quantification writing group, developed in conjunction with the European Association of Echocardiography, a branch of the European Society of Echocardiography. J Am Soc Echocardiogr. 2005;18:1440–1463.
14 Winter MM, Bernink FJP, Groenink M, et al. Evaluating the systemic right ventricle by CMR: the importance of consistent and reproducible delineation of the cavity. J Cardiovasc Magn Res. 2008;10:40.
15 Geva T, Powell AJ, Crawford EC, et al. Evaluation of regional differences in right ventricular systolic function by acoustic quantification echocardiography and cine magnetic resonance imaging. Circulation. 1998;98:339–345.
16 Edwards R, Shurman AJ, Sahn DJ, et al. Determination of right ventricular end systole by cardiovascular magnetic resonance imaging: A standard method of selection. Int J Cardiovasc Imag. 2009;25:791–796.
17 Graham TP, Jarmakani JM, Atwood GF, Canent RV. Right ventricular volume determinations in children: Normal values and observations with volume or pressure overload. Circulation. 1973;47:144–153.
18 Gentzler RD, Briselli MF, Gault JH. Angiographic estimation of right ventricular volume in man. Circulation. 1974;50:324–330.
19 Boak JG, Bove AA, Kreulen T, Spann JF. A geometric basis for calculation of right ventricular volume in man. Cathet Cardiovas Diagn. 1977;3:217–230.
20 Strugnell WE, Slaughter RE, Riley RA, et al. Modified RV short axis series—a new method for cardiac MRI measurement of right ventricular volumes. J Cardiovasc Magn Res. 2005;7:769–774.
21 Moroseos T, Mitsumori L, Kerwin WS, et al. Comparison of Simpson’s method with three-dimensional reconstruction for measurement of right ventricular volume in patients with complete or corrected transposition of the great arteries. Am J Cardiol. 2010;105:1603–1609.
22 Jiang L, de Prada JAV, Handschumacher MD, et al. Three-dimensional echocardiography: In vivo validation for right ventricular free wall mass as an index of hypertrophy. J Am Coll Cardiol. 1994;23:1715–1722.
23 Buckey JC, Beattie JM, Nixon JV, et al. Right and left ventricular volumes in vitro by a new nongeometric method. Am J Cardiac Imag. 1987;1:227–233.
24 Legget ME, Leotta DF, Bolson EL, et al. System for quantitative three dimensional echocardiography of the left ventricle based on a magnetic field position and orientation sensing system. IEEE Trans Biomed Eng. 1998;45:494–504.
25 Hubka M, Bolson EL, McDonald JA, et al. Three-dimensional echocardiographic measurement of left and right ventricular mass and volume: In vitro validation. Int J Cardiovasc Imag. 2002;18:111–118.
26 Chen G, Sun K, Huang G. In vitro validation of right ventricular volume and mass measurement by real-time three-dimensional echocardiography. Echocardiography. 2006;23:395–399.
27 Lu X, Nadvoretskiy V, Bu L, et al. Accuracy and reproducibility of real-time three dimensional echocardiography for assessment of right ventricular volumes and ejection fraction in children. J Am Soc Echocardiogr. 2008;21:84–89.
28 Niemann PS, Pinho L, Balbach T, et al. Anatomically oriented right ventricular volume measurements with dynamic three-dimensional echocardiography validated by 3-tesla magnetic resonance imaging. J Am Coll Cardiol. 2007;50:1668–1676.
29 Johnson TR, Hoch M, Huber A, et al. Quantification of right ventricular function in congenital heart disease: Correlation of 3D echocardiography and MRI as complementary methods. Fortschr Roentgenstr. 2006;178:1014–1021.
30 Sheehan FH, Kilner P, Sahn D, et al, Accuracy of right ventricular volume and function analysis in tetralogy of Fallot using Knowledge Based Reconstruction [abstract]. Presented at the American Heart Association annual meeting, New Orleans, LA, 2008.
31 Fayad ZA, Ferrari VA, Kraitchman DL, et al. Right ventricular regional function using MR tagging: Normals versus chronic pulmonary hypertension. Magn Reson Med. 1998;39:116–123.
32 Naito H, Arisawa J, Harada K, et al. Assessment of right ventricular regional contraction and comparison with the left ventricle in normal humans: A cine magnetic resonance study with presaturation myocardial tagging. Br Heart J. 1995;74:186–191.
33 Kaul S, Tei C, Hopkins J, Shah P. Assessment of right ventricular function using two-dimensional echocardiography. Am Heart J. 1984;107:526–531.
34 Hsiao S-H, Lin S-K, Wang W-C, et al. Severe tricuspid regurgitation shows significant impact in the relationship among peak systolic tricuspid annular velocity, tricuspid annular plane systolic excursion, and right ventricular ejection fraction. J Am Soc Echocardiogr. 2006;19:902–919.
35 Smith JL, Bolson EL, Wong SP, et al. Three-dimensional assessment of two-dimensional technique for evaluation of right ventricular function by tricuspid annulus motion. Int J Card Imag. 2003;19:189–197.
36 Morcos P, Vick GW, Sahn D, et al. Correlation of right ventricular ejection fraction and tricuspid annular plane systolic excursion in tetralogy of Fallot by magnetic resonance imaging. Int J Cardiovasc Imaging. 2008;25:263–270.
37 Kind T, Mauritz G-J, Marcus T, et al. Right ventricular ejection fraction is better reflected by transverse rather than longitudinal wall motion in pulmonary hypertension. J Cardiovasc Magn Res. 2010;12:35.
38 Davlouros PA, Kilner PJ, Hornung TS, et al. Right ventricular function in adults with repaired tetralogy of Fallot assessed with cardiovascular magnetic resonance imaging: Detrimental role of right ventricular outflow aneurysms or akinesia and adverse right-to-left ventricular interaction. J Am Coll Cardiol. 2002;40:2044–2052.
39 Hui W, El Rahman MYA, Dsebissowa F, et al. Comparison of modified short axis view and apical four chamber view in evaluating right ventricular function after repair of tetralogy of Fallot. Int J Cardiol. 2005;105:256–261.
40 Tamborini G, Muratori M, Brusoni D, et al. Is right ventricular systolic function reduced after cardiac surgery? A two- and three-dimensional echocardiographic study. Eur J Echocardiogr. 2009;10:630–634.
41 Erbel R, Schweizer P, Lambertz H, et al. Echoventriculography—a simultaneous analysis of two-dimensional echocardiography and cineventriculography. Circulation. 1983;67:205–215.
42 King DL, Harrison MR, King DL, Jr., et al. Ultrasound beam orientation during standard two-dimensional imaging: Assessment by three-dimensional echocardiography. J Am Soc Echocardiogr. 1992;5:569–576.
43 Dorosz J, Bolson EL, Waiss MS, Sheehan FH. Three-dimensional visual guidance improves the accuracy of calculating right ventricular volume with two-dimensional echocardiography. J Am Soc Echocardiogr. 2003;16:675–681.
44 Gustafsson U, Lindqvist P, Waldenstrom A. Apical circumferential motion of the right and left ventricles in healthy subjects described with speckle tracking. J Am Soc Echocardiogr. 2009;21:1326–1330.
45 Sheehan FH, Mathey DG, Wygant J, et al. Measurement of regional right ventricular wall motion from biplane contrast angiograms using the centerline method. In: Computers in cardiology. Long Beach, CA: IEEE Computer Society; 1985:149–152.
46 Nakasato M, Akiba T, Sato S, et al. Right and left ventricular function assessed by regional wall motion analysis in patients with tetralogy of Fallot. Int J Cardiol. 1997;58:127–134.
47 Yang P, Otto C, Sheehan F. The effect of normalization in reducing variability in regional wall thickening. J Am Soc Echocardiogr. 1997;10:197–204.
48 Tulevski, II., Zijta FM, Smeijers AS, et al. Regional and global right ventricular dysfunction in asymptomatic or minimally symptomatic patients with congenitally corrected transposition. Cardiol Young. 2004;14:168–174.
49 Haber I, Metaxas DN, Geva T, Axel L. Three-dimensional systolic kinematics of the right ventricle. Am J Physiol. 2005;289:H1826–H1833.
50 Klein SS, Graham TPJ, Lorenz CH. Noninvasive delineation of normal right ventricular contractile motion with magnetic resonance imaging myocardial tagging. Ann Biomed Eng. 1998;26:756–763.
51 Young AA, Fayad ZA, Axel L. Right ventricular midwall surface motion and deformation using magnetic resonance tagging. Am J Physiol. 1996;271:H2677–H2688.
52 Menteer J, Weinberg PM, Fogel MA. Quantifying regional right ventricular function in tetralogy of Fallot. J Cardiovasc Magn Res. 2005;7:753–761.
53 Bodhey NK, Beerbaum P, Sarikouch S, et al. Functional analysis of the components of the right ventricle in the setting of Tetralogy. of Fallot. Circ Cardiovasc Imag. 2008;1:141–147.
54 Wald RM, Haber I, Wald R, et al. Effects of regional dysfunction and late gadolinium enhancement on global right ventricular function and exercise capacity in patients with repaired tetralogy of Fallot. Circulation. 2009;119:1370–1377.
55 Yoerger DM, Marcus F, Sherrill D, et al. Echocardiographic findings in patients meeting Task Force criteria for arrhythmogenic right ventricular dysplasia. J Am Coll Cardiol. 2005;45:860–865.
56 Bomma C, Dal D, Tandri H, et al. Regional differences in systolic and diastolic function in arrhythmogenic right ventricular dysplasia/cardiomyopathy using magnetic resonance imaging. Am J Cardiol. 2005;95:1507–1511.
57 Dodge HT, Frimer M, Stewart DK. Functional evaluation of the hypertrophied heart in man. Circ Res. 1974;34-35(Suppl II):II-122–II-127.
58 McCulloch AD. Cardiac biomechanics. In: Bronzino JD, ed. Biomedical engineering handbook. Boca Raton, FL: CRC Press; 1995:149–152.
59 McCulloch AD, Omens JH. Factors affecting the regional mechanics of the diastolic heart. In: Glass L, Hunter R, Mcculloch AD. Theory of heart: Biomechanics, biophysics, and nonlinear dynamics of cardiac function. New York: Springer-Verlag; 1991:87–119.
60 King ME, Braun H, Goldblatt A, et al. Interventricular septal configuration as a predictor of right ventricular systolic hypertension in children: A cross-sectional echocardiographic study. Circulation. 1983;68:68–75.
61 Young AA, Orr R, Smaill BH, Dell’Italia LJ. Three-dimensional changes in left and right ventricular geometry in chronic mitral regurgitation. Am J Physiol. 1996;271:H2689–H2700.
62 Zhang H, Thomas MT, Walker NE, et al. Four-dimensional functional analysis of left and right ventricles using MR images and active appearance models. IEEE Trans Med Imag. 2007;29:350–363.
63 Clark TJ, Sheehan FH, Bolson EL. Characterizing the normal heart using quantitative three-dimensional echocardiography. Physiol Meas. 2006;27:467–508.
64 Weyman AE, Wann S, Feigenbaum H, Dillon JC. Mechanism of abnormal septal motion in patients with right ventricular overload: a cross-sectional echocardiographic study. Circulation. 1976;54:179–186.
65 Lopez-Candales A, Dohi K, Iliescu A, et al. An abnormal right ventricular apical angle is indicative of global right ventricular impairment. Echocardiography. 2006;23:361–368.
66 Kurtz CE, Sheehan FH. Characterization of right ventricular shape and function in pulmonary hypertension with 3D-echocardiography [abstract]. J Am Soc Echocardiogr. 2010;23:B-68.
67 Mauritz G-J, Kind T, Marcus JT, et al. Progressive changes in right ventricular geometric shortening and long-term survival in pulmonary arterial hypertension. Chest. 2011;141(4):935–943.
68 Laster SB, Shelton TJ, Barzilai B, Goldstein JA. Determinants of the recovery of right ventricular performance following experimental chronic right coronary artery occlusion. Circulation. 1993;88:696–708.
69 Goldstein JA. Right heart ischemia: Pathophysiology, natural history, and clinical management. Prog Cardiovasc Dis. 1998;40:325–341.
70 Sukmawan R, Akasaka T, Watanabe N, et al. Quantitative assessment of right ventricular geometric remodeling in pulmonary hypertension secondary to left-sided heart disease using real-time three-dimensional echocardiography. Am J Cardiol. 2004;94:1096–1099.
71 Berkowitz R, Alhaj E, Manchikalapudi RB, et al. Determinants of right ventricular failure in patients admitted with acute left heart failure. Congest Heart Fail. 2010;16:243–248.
72 Guglin M, Verma S. Right side of heart failure. Heart Fail Rev. 2012;17(3):511–527.
73 Hesse B, Asher CR. Time to move to the right: The study of right ventricular performance: Too long neglected. Clin Cardiol. 2005;28:8–12.
74 John R, Lee S, Eckman P, Liao K. Right ventricular failure—a continuing problem in patients with left ventricular assist device support. J Cardiovasc Transl Res. 2010;3:604–611.
75 Maslow AD, Regan MM, Panzica P, et al. Precardiopulmonary bypass right ventricular function is associated with poor outcome after coronary artery bypass grafting in patients with severe left ventricular systolic dysfunction. Anesth Analg. 2002;95:1507–1518.