[level-membership-for-cardiovascular-category]
Chapter 12 Assessment of Left Ventricular Mechanical Dyssynchrony
Real-time three-dimensional echocardiography (RT3DE) has proven to be the most reliable and reproducible echocardiographic measure of left ventricular volumes, ejection fraction (EF), and mass.1,2 The advent of the matrix array transducer and improvements in parallel processing technologies have improved the temporal and spatial resolution of the volumes acquired, and full left ventricle (LV) datasets can now be obtained in a single heartbeat on some commercial systems.3
Mechanical dyssynchrony, an uncoordinated pattern of left ventricular contraction, has been described in a variety of patient cohorts, including those with left ventricular systolic dysfunction and right ventricular pacing. A reliable and reproducible measure of left ventricular mechanical dyssynchrony has proved elusive, as evidenced by the Predictors of Response to CRT (PROSPECT) study, which demonstrated poor agreement between multiple two-dimensional (2D), M-mode echocardiographic, and tissue Doppler measures of dyssynchrony in patients undergoing cardiac resynchronization therapy (CRT).4 The inability to image the entire LV simultaneously also was noted as a drawback to these measures.
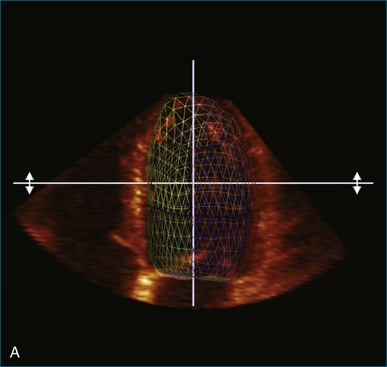
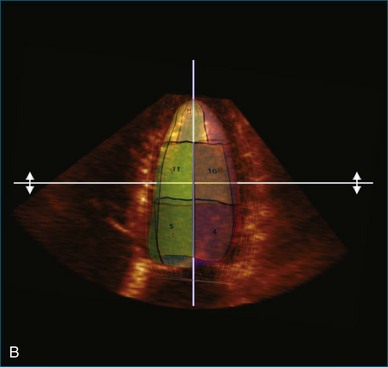
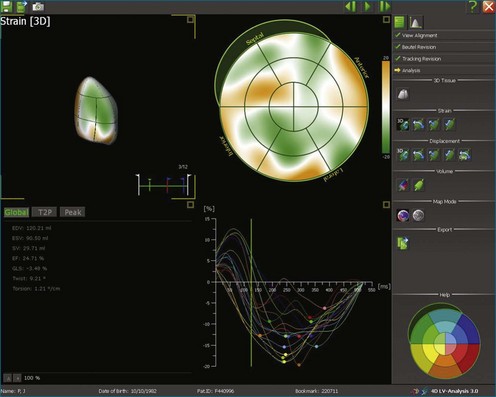
Kapetanakis and colleagues5 proposed RT3DE quantification of regional myocardial function as an accurate measure of left ventricular mechanical dyssynchrony, which might overcome the shortcomings of traditional measures of dyssynchrony. This method is based on the construction of a cast of the LV using semiautomated endocardial border recognition throughout the cardiac cycle. The cast is then segmented into 16 or 17 segments around a central axis, corresponding to American Society of Echocardiology guidelines (Figure 12-1; Video 12-1). Segmental volume or time curves are constructed, and a dyssynchrony index (SDI-16 or SDI-17) is calculated on the basis of the standard deviation of the time to minimal segmental volume as a percentage of the R-R interval (Figure 12-2; Video 12-2). Indexing to the R-R interval allows comparison of the systolic dyssynchrony index (SDI) between subjects with differing heart rates. This method has been validated against cardiac magnetic resonance imaging (MRI) and single-photon emission computed tomography for the assessment of left ventricular dyssynchrony and has been shown to correlate well with other echocardiographic measures of dyssynchrony, such as tissue Doppler.6–8
Time and Volume Curves
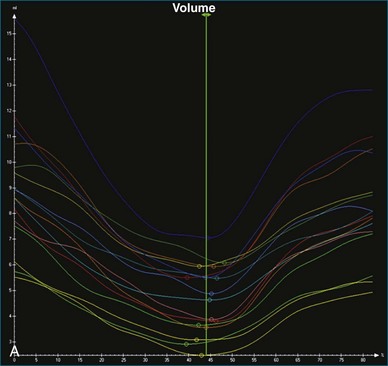
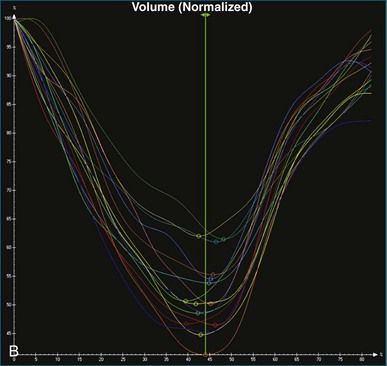
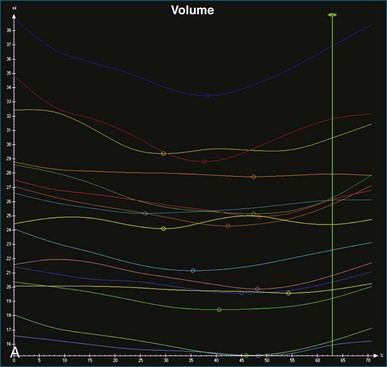
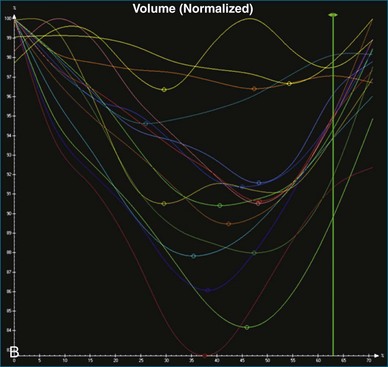
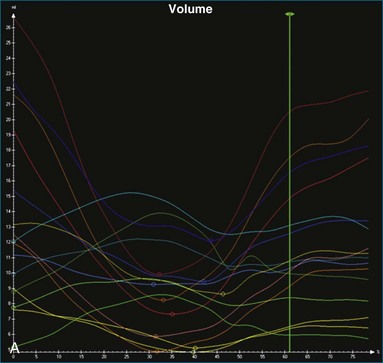
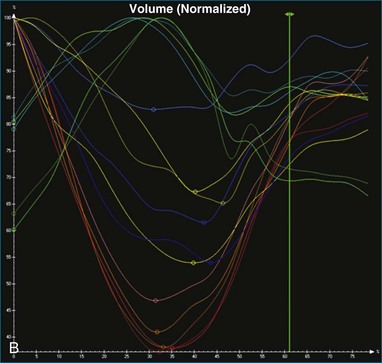
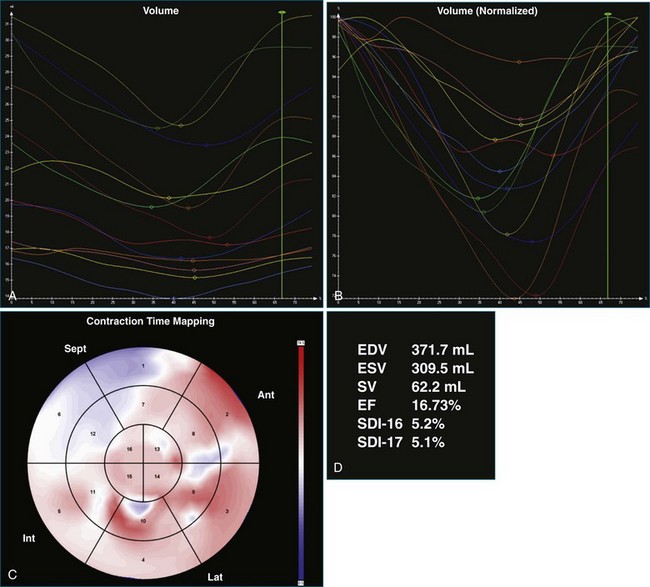
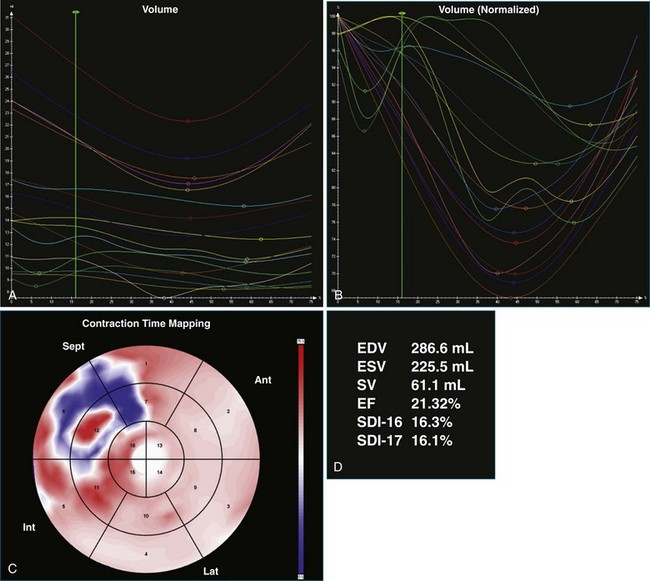
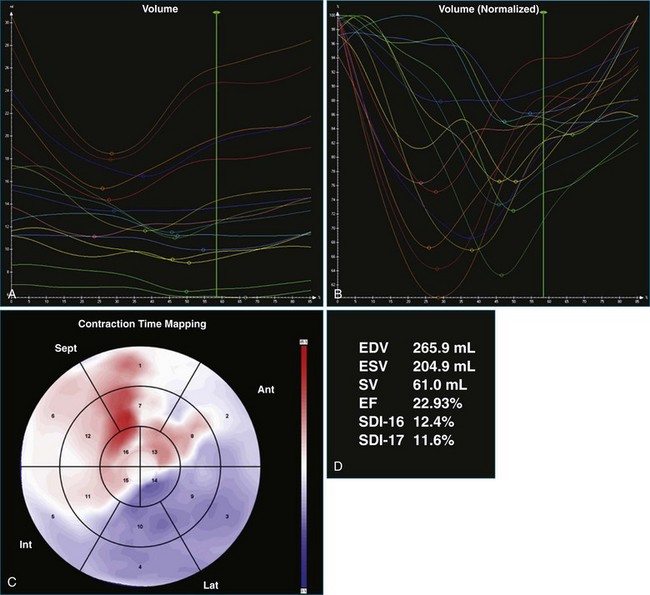
The software for LV analysis produces plots of the absolute segmental volume against time as well as normalized volume curves. When the absolute volumes are normalized such that the greatest volume represents 100%, the difference between 100% and the average of the minimum segmental volumes represents the EF. Segmental volume curves may be viewed individually, but the pattern of segmental contraction is useful and forms the basis of the SDI. The minimum volume point is identified on each curve. In a normal ventricle, the spread of the minimum volume points is narrow, leading to a low standard deviation from the mean time (see Figure 12-2). The volume curves may be used to identify regional wall motion abnormalities due to differences in amplitude between segments (Figure 12-3). A septal flash also is readily identified using the volume curves (Figure 12-4).
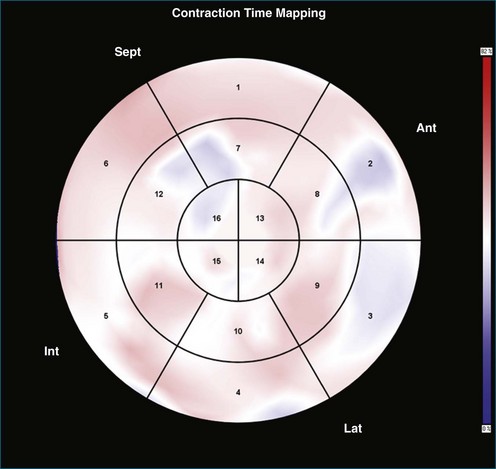
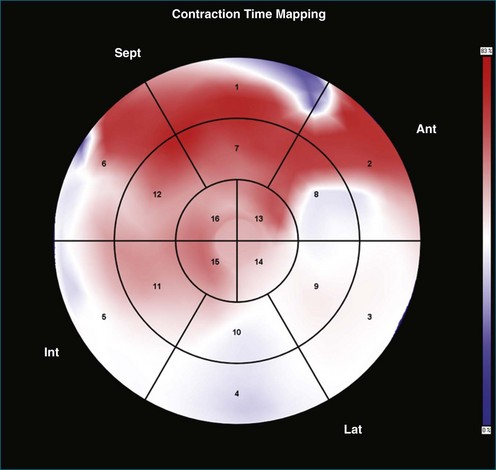
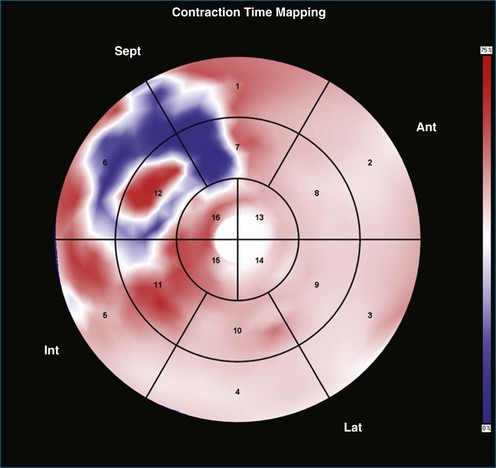
Contraction Front Mapping
Contraction front mapping analyzes temporal and spatial activation of left ventricular contraction, representing the myocardial segments that reach peak contraction every 25 ms on a color-coded polar map of the LV. As the contraction front spreads through the ventricle, the color changes from red to blue, allowing areas of late contraction to be easily identified. The normal left ventricular activation pattern is homogeneous and rapid (Figure 12-5; Video 12-3). The activation pattern in patients with left ventricular systolic dysfunction is variable, but generally a U-shaped activation pattern is noted (Figures 12-6 and 12-7; Videos 12-4 and 12-5). In our experience, the region of maximal delay most commonly appears to be the septum, leading to a predominant left-to-right color transition. No definite pattern has been established in cases of left bundle branch block, although a septal flash may be identified in some cases (Figure 12-8; Video 12-6). This tool also has been used to identify regional wall motion abnormalities at rest and during stress echocardiography.

Reproducibility of Systolic Dyssynchrony Index
Excellent reproducibility was noted in the original description of SDI.5 The authors described test-retest variability ranging from 1% for end-diastolic volume (EDV) to 4.6% for SDI. Intraobserver variability ranged from 0.6% for EDV to 8.1% for SDI, and interobserver variability ranged from 3.5% for EDV to 6.4% for SDI. The investigators further tested the reproducibility of the technique in a two-center study involving institutions in the United Kingdom and Hong Kong.9 To ensure that methods were comparable, a cross-site training program was devised with 20 “training” datasets. The authors reported excellent agreement at the end of the training period. Subsequently, datasets of 62 patients with reduced left ventricular systolic function who were planned for cardiac resynchronization therapy were shared between the two sites and independently analyzed. Intraclass correlation (ICC) coefficients in this study were excellent at greater than 0.8 for all parameters studied (EDV, end-systolic value [ESV], EF, and SDI). Interhospital variability was 2.9% for EDV, 1% for ESV, 7.1% for EF, and 7.6% for SDI.
Soliman and colleagues10 elucidated reproducibility further by categorizing dataset quality in 50 randomly selected patients included in their study and noted the reproducibility of SDI to be better in patients with good-quality datasets (interobserver variability of 9% and ICC of 0.99 in patients with good-quality datasets compared with interobserver variability of 16% and ICC of 0.95 in patients with moderate-quality datasets). Overall excellent reproducibility was noted in this study (interobserver variability of 12%, intraobserver variability of 10% for SDI, and both interclass correlation coefficients >0.95).
Normal Values for Systolic Dyssynchrony Index
A number of studies have sought to establish normal values for SDI. On the basis of current evidence, the normal value of the SDI-16 appears to be approximately 3% to 4%, with a maximal value below 6% in normal individuals.5,10–14 There appears to be a normal apex-to-base contraction gradient, which creates a peristaltic-type contraction pattern in the normal heart.12–13 There does not appear to be a significant difference between genders, and SDI does not appear to change significantly with increasing age. A strong negative correlation between SDI-16 and EF has been shown in several studies, and SDI has been demonstrated to be independent of QRS duration.5,7,12
Clinical Significance of Systolic Dyssynchrony Index
Right Ventricular Pacing
Right ventricular pacing has been shown to increase the SDI and to disrupt the normal apex-to-base contraction gradient of the heart.15 This is particularly true in patients with right ventricular apical pacing and is associated with a reduction in left ventricular ejection fraction. Baseline reduced left ventricular systolic function and high pacing burden appear to worsen this phenomenon.16 This phenomenon suggests a potential mechanism for the worsened left ventricular systolic function observed in patients undergoing right ventricular pacing.
Predicting Response to Cardiac Resynchronization Therapy and Assessing Response
Several studies have shown responders to have a significantly higher baseline SDI and a significantly greater acute drop in SDI after biventricular (BiV) pacemaker implantation. In patients with CRT devices, RT3DE has been used to demonstrate acute changes in left ventricular volumes, EF, and SDI between the CRT-on and CRT-off modes. SDI-16 has been shown to predict response to CRT in single-center studies.17–20 The regional volume curves generated allow identification of the latest contracting segment. There is evidence that siting the left ventricular pacing lead as close as possible to the latest contracting segment provides incremental benefit.21 There is emerging evidence that persistently elevated SDI after CRT can identify a subpopulation of patients who will benefit from device optimization.
Technique for Left Ventricle Analysis
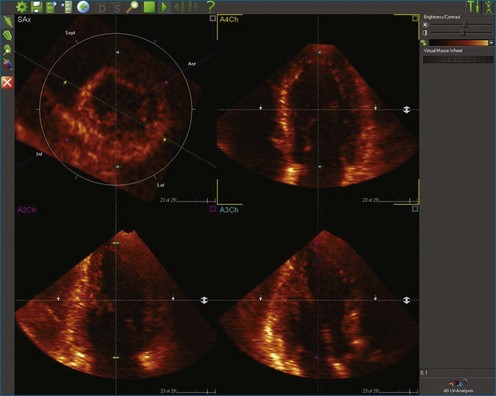
1. The end-systolic and end-diastolic frames are identified, and the axis of the LV is identified using the apex and mitral valve annulus as landmarks (Figure 12-9; Video 12-7).
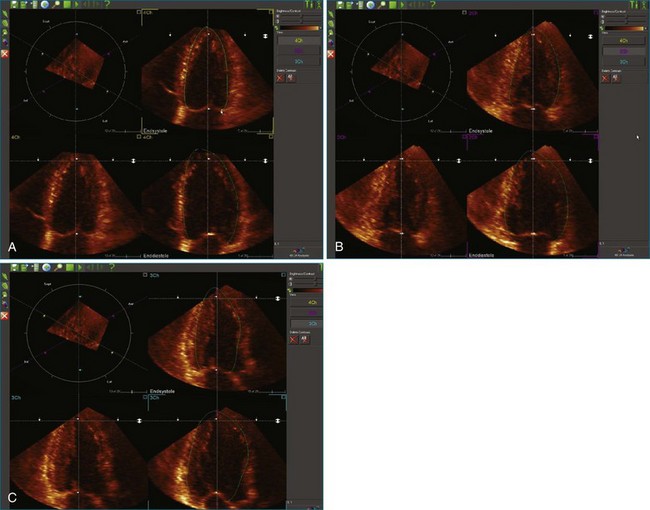
2. The endocardial border is identified at end systole and end diastole in three cut frames corresponding to the traditional 2D apical views (four-chamber, two-chamber, and long-axis views). This is performed in the same manner as Simpson’s biplane view, excluding the endocardial trabeculae and papillary muscles. There is usually a tradeoff between the accuracy of estimated volumes compared with MRI and accuracy of tracking. Placing the border more subendocardially to mid-myocardially improves the correlation between 3D echocardiography and MRI volumes. However, this may be at the cost of accurate tracking, leading to a less accurate SDI. Our practice is initially to place the borders further out. However, if tracking proves inaccurate, we move the border closer to the blood-tissue interface (Figure 12-10; Videos 12-8 to 12-10).
3. These data are then used to generate a model of the LV throughout the cardiac cycle using endocardial border detection software (see Figure 12-1). The model is inspected to ensure accurate identification of the endocardial border and reliable tracking throughout the cardiac cycle. This is done in the short-axis and again in the long-axis views. This step is particularly important because accurate border tracking is essential for identification of the exact timing of the end-systolic subvolumes (Video 12-11).
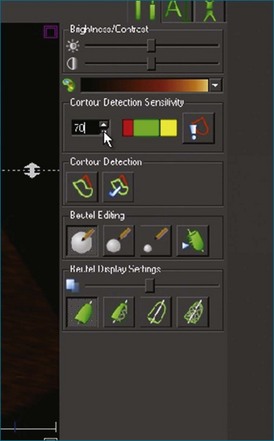
4. If necessary, tracking may be adjusted in a number of ways (Figure 12-11). Initially, the contour detection sensitivity may be adjusted. This step makes the model more “stiff” because it increases dependence on the user-defined planes (Video 12-12). If tracking remains suboptimal, we return to the endocardial border identification stage and adjust the initial cut plane borders in regions where tracking is poor. It sometimes is necessary to define the border closer to the blood-tissue interface, although this does decrease the accuracy of the volume measurements (Video 12-13). Alternatively, the tracking may be adjusted on the Beutel model on a frame-by-frame basis. This method can increase the jerkiness of the Beutel model that is generated, again making the minimum volume more difficult to identify. This difficulty can be overcome by the “smoothing” function (Video 12-14).
5. Once a model that tracks satisfactorily has been achieved, ESV, EDV, EF, and SDI are calculated. At this point, we inspect the individual time-volume curves to ensure that the minimum volume has been accurately identified (Video 12-15). We find this easiest using the normalized time-volume curves because the greater amplitude of the curves makes the minimum volume clearer to identify (see Figures 12-2 to 12-4). If the minimum volume has been attributed to the wrong time, this is adjusted, changing the overall SDI. This process is repeated for both the 16-segment and 17-segment models. If there are outlier curves, the tracking in these segments should again be carefully inspected to ensure its accuracy. Segments that do not track well may be excluded from the final result.
Challenges in Left Ventricle Analysis
Operator Training and Experience
Assessment of left ventricular function is known for the difficulties in achieving consistent results. Formal teaching interventions have been shown to improve interobserver variability in the 2D assessment of EF, thereby ensuring good-quality results.22 Our experience supports this conclusion in the case of 3D analysis of the LV. We have found that consistent methods among operators plays an extremely important role in achieving reproducible results because even small differences in methodology may lead to a systematic bias in results, consistent with published evidence.23 At our institution, all operators are required to undergo a formal training program using a set of 3D datasets representing a spectrum of pathologies and dataset quality. Good agreement with the results of an expert operator is required prior to beginning clinical analysis. This method has proven to be effective for us, as evidenced by the excellent interobserver and interhospital agreement in the previously mentioned study by Kapetanakis et al.9
Dataset Quality
As seen in the study by Soliman and colleagues,10 dataset quality has a large bearing on the accuracy and reproducibility of LV analysis.10 Mor-Avi and colleagues23 also noted poor spatial resolution as a factor accounting for discrepancies between operators. A recent study in a “real world” population by Miller and associates24 has confirmed that image quality has a significant impact on observer variability. Our experience is significantly in keeping with this finding. Up to 15% of datasets may be rejected because of poor quality, with the proportion of unusable scans higher among patients with heart disease.14
Left Ventricle Analysis in Patients with Reduced Systolic Function
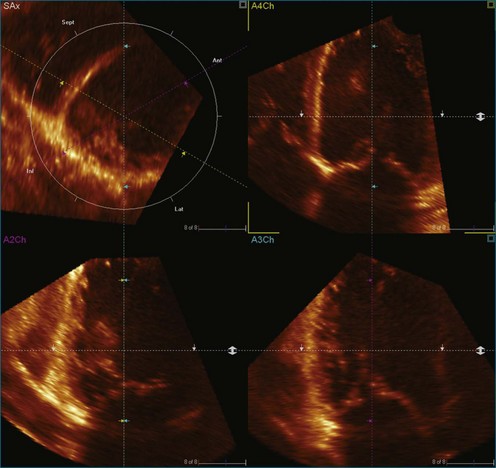
LV analysis is more challenging in patients with reduced LV function. This is caused by a number of factors. First, reduced LV function is associated with LV dilation resulting in larger left ventricular volumes, which are technically more challenging to acquire (Figure 12-12; Video 12-16). The apical echocardiographic window frequently is displaced, and the apex and anterior wall become more difficult to image. Larger volumes result in lower volume rates, a problem that can be partly overcome by four- or seven-beat acquisitions. Alternatively, the high volume rate–low scan line density acquisition option may be used, although it results in reduced spatial resolution.
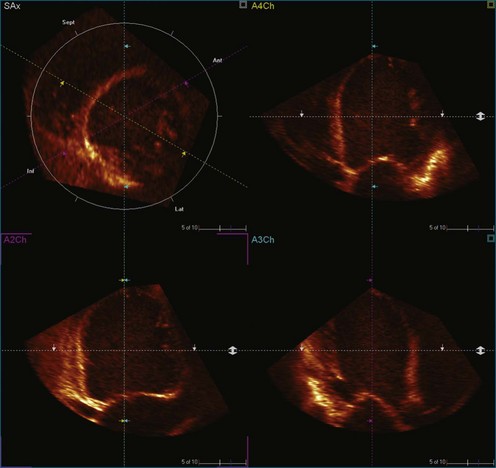
Second, the increasing sphericity index as the LV dilates makes the true apex more difficult to identify and hence the central axis of the LV difficult to align (Figure 12-13; Video 12-17). Because the LV model is subsegmented around this axis, variation in the axis leads to alteration in subsegmental volumes and time to minimum volume.
Future Directions
Development of new software such as speckle tracking potentially allows for more accurate endocardial border tracking. 3D speckle tracking software is now available from a number of vendors and allows assessment of left ventricular global and segmental volumes as well as novel quantification of measures of myocardial deformation. This uses several of the benefits of 3D LV analysis, overcoming 2D limitations such as foreshortening and geometric assumptions of the LV, and offers the added benefit of tracking of speckles moving in all three dimensions (Figure 12-14; Videos 12-20 and 12-21). Initial experience with this software suggests a quicker and simpler workflow. This approach shows promise, with good reproducibility noted in one study using software from a single vendor.25 However, it requires further validation prior to widespread use.
Case 1: Normal Left Ventricular Synchrony with Three-Dimensional Echocardiography and Broad QRS
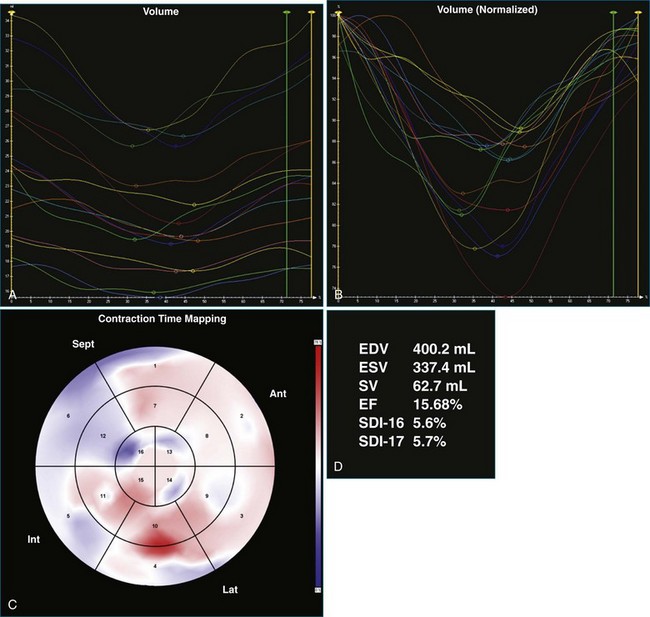
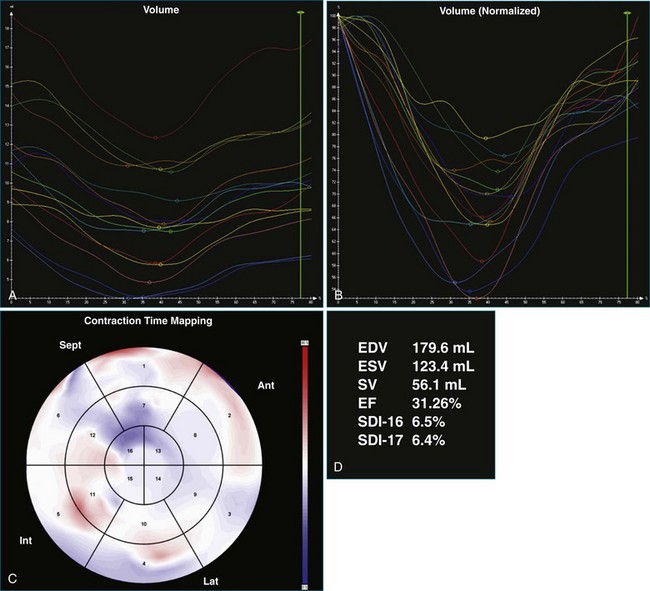
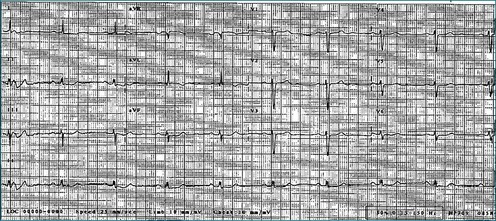
A 65-year-old man with longstanding dilated cardiomyopathy, attributed to a past history of viral myocarditis, presented to the CRT assessment clinic for consideration of upgrade of single-chamber defibrillator after a deterioration in heart failure symptoms. At the time of assessment, resting ECG showed sinus rhythm with left bundle branch block and QRS duration of 141 ms (Figure 12-15). However, 3DE did not suggest significant dyssynchrony, with an SDI-16 measured at 5.6% (Figure 12-16; Video 12-22). He was offered a CRT upgrade on the basis of deteriorating symptoms to New York Heart Association (NHYA) functional class III, broad QRS, and EF measured at 13%. However, the lack of 3D dyssynchrony suggested possible lack of benefit of CRT.
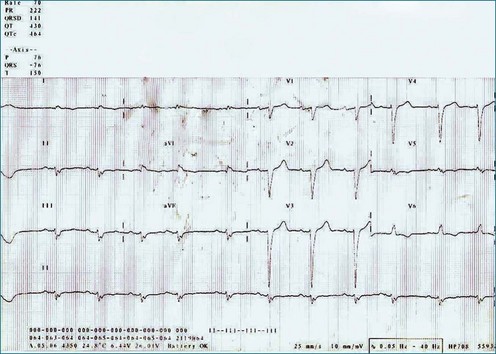
Figure 12-15 Electrocardiogram of the patient in Case 1, showing left bundle branch block with a QRS duration of 141 MS.
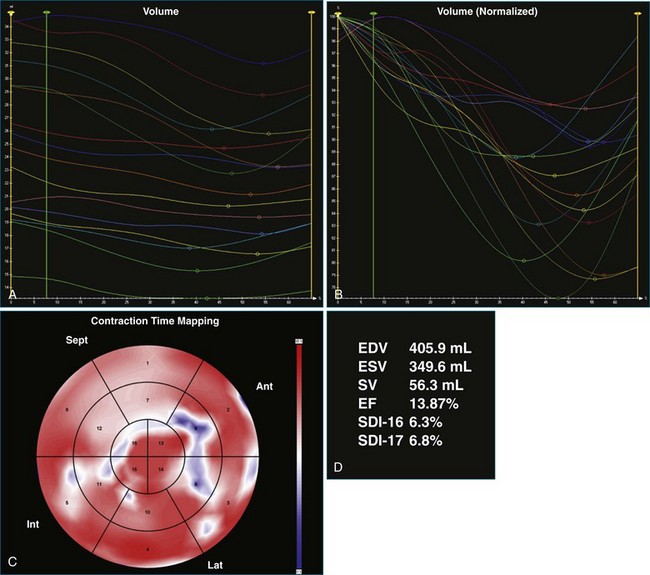
One month after implantation, the patient presented again with worsening heart failure symptoms. On interrogation of his device, he was found to be 93% BiV paced. LV analysis was repeated, and SDI-16 was found to be 6.3% during BiV pacing (Figure 12-17; Video 12-23) compared with 5.2% during intrinsic rhythm (Figure 12-18; Video 12-24). The pacing function of the device was switched off. The patient was referred for ventricular assist device and was placed on the waiting list for cardiac transplantation.
Case 2: Atrial Fibrillation
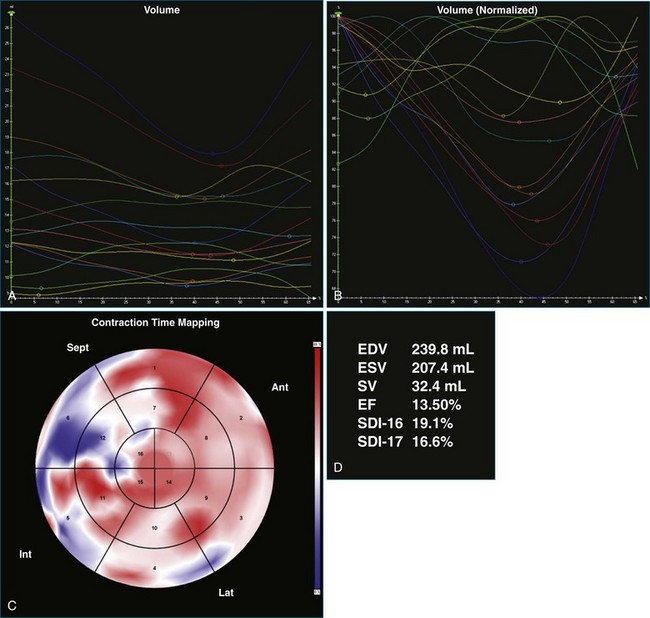
A 61-year-old man with a history of permanent atrial fibrillation, coronary artery disease, and previous coronary artery bypass grafting was referred for consideration of CRT. He had a history of increasing shortness of breath on exertion and paroxysmal nocturnal dyspnea. Adequate 3DE volumes were obtained for analysis and demonstrated severely reduced LV systolic function, with an EF of 13.5%, and gross dyssynchrony, with an SDI at 19.1% (Figure 12-19; Video 12-25). Following CRT-D implantation, he was noted to have poor ventricular rate control despite high-dose β-blocker therapy, with rates ranging from 90 to 100 beats/min. This resulted in inadequate BiV pacing therapy, at just 34% BiV pacing (Figure 12-20; Video 12-26). Atrioventricular node ablation was performed and resulted in 100% BiV pacing. LV analysis performed 4 days after his atrioventricular node ablation showed that the EF had increased, with reduction in SDI to 10.2%, suggesting significant benefit from BiV pacing. This improved further at a follow-up visit 3 months later, with improvement in EF to 30% and reduction in SDI to 5.5% (Figure 12-21; Video 12-27). Symptomatically, the patient had an excellent benefit following his two procedures.
Case 3: Suboptimal Lead Position
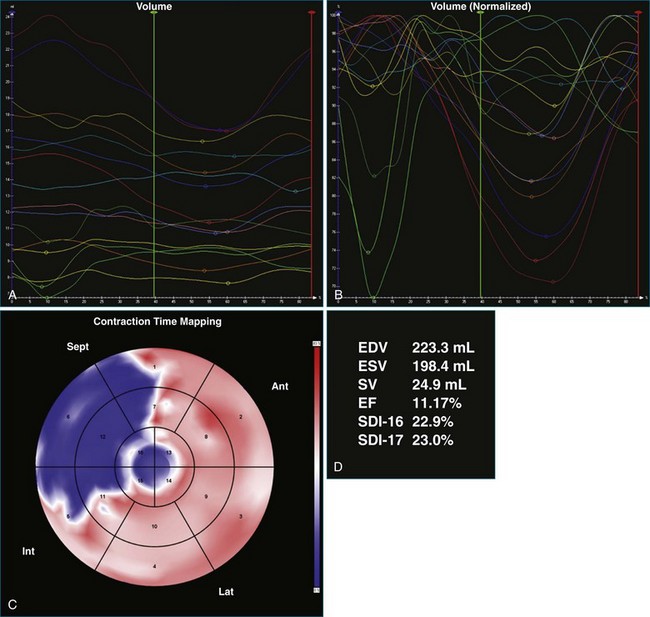
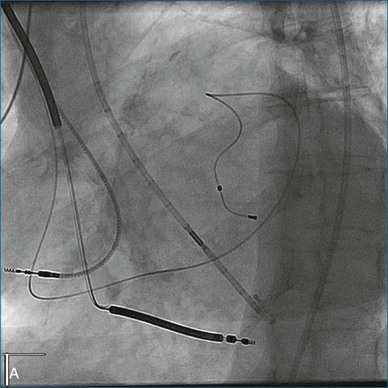
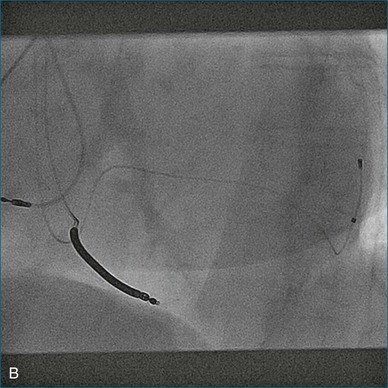
A 77-year-old woman with a history of idiopathic dilated cardiomyopathy, with broad QRS duration and significant dyssynchrony on 3DE assessment (SDI, 16.1%), underwent CRT-defibrillator implantation (Figure 12-22; Video 12-28). Over the subsequent 6 months, she noted a progressive deterioration in heart failure symptoms. Repeat 3DE analysis of the LV indicated persistent dyssynchrony (Figure 12-23; Video 12-29). Postimplantation chest radiograph and coronary sinus venography films from the device were reviewed, and it was noted that the LV lead had been placed in an anteroseptal branch. An alternative posterior vein was noted for lead deployment, and the patient underwent lead repositioning (Figure 12-24). Following device revision, her clinical condition considerably improved, with reduced dose of diuretic and improved exercise capacity. Subsequent repeat measurement of left ventricular SDI demonstrated a significant improvement in dyssynchrony (Figure 12-25; Video 12-30).
Case 4: Dyssynchrony Despite Normal QRS Duration
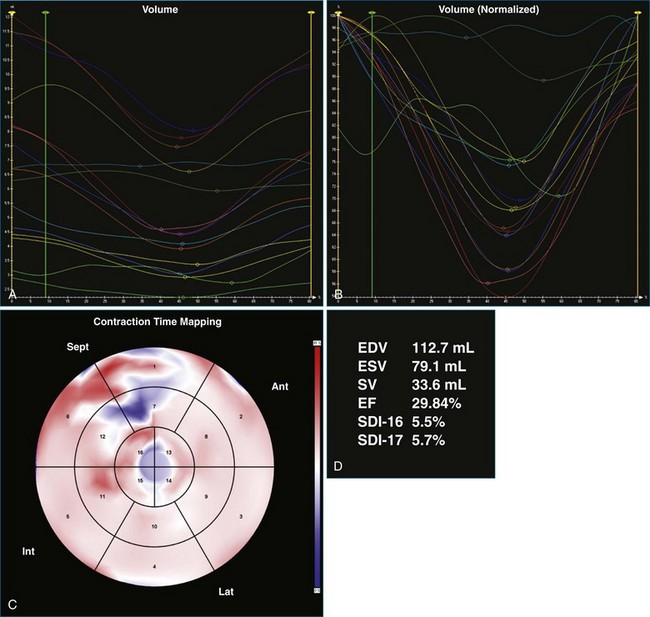
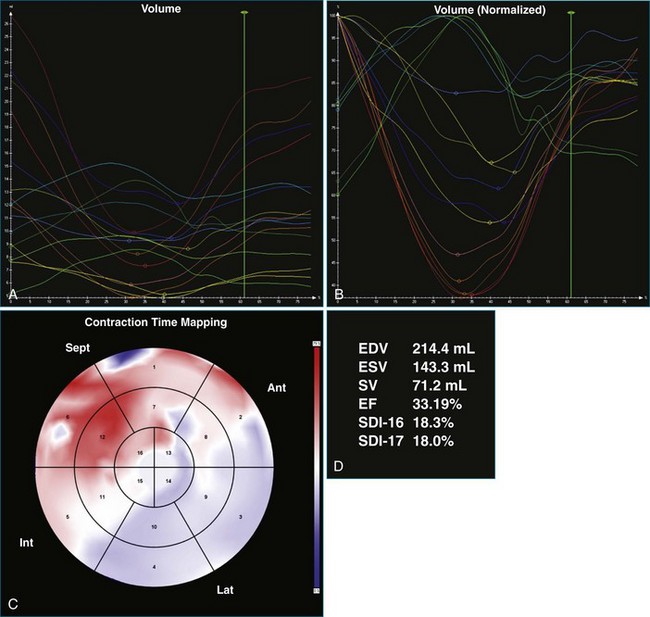
An 80-year-old man with a background of coronary artery disease and previous coronary artery bypass grafting was referred for consideration of implantable cardioverter-defibrillator therapy on primary prevention grounds. He had a history of exertional breathlessness and was in NYHA class III. He was known to have left ventricular systolic impairment, with an EF of approximately 30%. During his assessment, QRS duration was noted to be 96 ms, with delayed precordial R-wave progression (Figure 12-26); 24-hour ECG monitoring revealed four beats of ventricular tachycardia. The patient was referred for 3DE, which showed an EF of 33% and an SDI of 18.8% (Figure 12-27; Video 12-31). This result suggested potential benefit from CRT, although falling outside current guidelines; reimbursement therefore was subsequently denied.
1 Sugeng L, Mor-Avi V, Weinert L, et al. Quantitative assessment of left ventricular size and function: Side-by-side comparison of real-time three-dimensional echocardiography and computed tomography with magnetic resonance reference. Circulation. 2006;114:654–661.
2 Jenkins C, Bricknell K, Hanekom L, Marwick TH. Reproducibility and accuracy of echocardiographic measurements of left ventricular parameters using real-time three-dimensional echocardiography. J Am Coll Cardiol. 2004;44:878–886.
3 Monaghan M, Bax J, Franke A, et al. 3-dimensional echocardiographic assessment of left ventricular dyssynchrony: An alternative viewpoint. JACC Cardiovasc Imag. 2009;2:1334–1335.
4 Chung ES, Leon AR, Tavazzi L, et al. Results of the predictors of response to CRT (PROSPECT) trial. Circulation. 2008;117:2608–2616.
5 Kapetanakis S, Kearney MT, Siva A, et al. Real-time three-dimensional echocardiography: A novel technique to quantify global left ventricular mechanical dyssynchrony. Circulation. 2005;112:992–1000.
6 Marsan NA, Henneman MM, Chen J, et al. Real-time three-dimensional echocardiography as a novel approach to quantify left ventricular dyssynchrony: A comparison study with phase analysis of gated myocardial perfusion single photon emission computed tomography. J Am Soc Echocardiogr. 2008;21:801–807.
7 Takeuchi M, Jacobs A, Sugeng L, et al. Assessment of left ventricular dyssynchrony with real-time 3-dimensional echocardiography: Comparison with Doppler tissue imaging. J Am Soc Echocardiogr. 2007;20:1321–1329.
8 Vieira MLC, Cury AF, Naccarato G, et al. Analysis of left ventricular regional dyssynchrony: Comparison between real time 3D echocardiography and tissue Doppler imaging. Echocardiography. 2009;26:675–683.
9 Kapetanakis S, Bhan A, Murgatroyd F, et al. Real-time 3D echo in patient selection for cardiac resynchronization therapy. JACC Cardiovasc Imag. 2010;4:16–26.
10 Soliman O, II., van Dalen BM, Nemes A, et al. Quantification of left ventricular systolic dyssynchrony by real-time three-dimensional echocardiography. J Am Soc Echocardiogr. 2009;22:232–239.
11 Sonne C, Sugeng L, Takeuchi M, et al. Real-time 3-dimensional echocardiographic assessment of left ventricular dyssynchrony: Pitfalls in patients with dilated cardiomyopathy. JACC Cardiovasc Imag. 2009;2:802–812.
12 De Castro S, Faletra F, Di Angelantonio E, et al. Tomographic left ventricular volumetric emptying analysis by real-time 3-dimensional echocardiography: Influence of left ventricular dysfunction with and without electrical dyssynchrony. Circ Cardiovasc Imag. 2008;1:41–49.
13 Marsan NA, Tops LF, Westenberg JJM, et al. Usefulness of multimodality imaging for detecting differences in temporal occurrence of left ventricular systolic mechanical events in healthy young adults. Am J Cardiol. 2009;104:440–446.
14 Conca C, Faletra FF, Miyazaki C, et al. Echocardiographic parameters of mechanical synchrony in healthy individuals. Am J Cardiol. 2009;103:136–142.
15 Liu W-H, Chen M-C, Chen Y-L, et al. Right ventricular apical pacing acutely impairs left ventricular function and induces mechanical dyssynchrony in patients with sick sinus syndrome: A real-time three-dimensional echocardiographic study. J Am Soc Echocardiogr. 2008;21:224–229.
16 Fang F, Chan JY-S, Yip GW-K, et al. Prevalence and determinants of left ventricular systolic dyssynchrony in patients with normal ejection fraction received right ventricular apical pacing: A real-time three-dimensional echocardiographic study. Eur J Echocardiogr. 2010;11:109–118.
17 Marsan NA, Bleeker GB, Ypenburg C, et al. Real-time three-dimensional echocardiography permits quantification of left ventricular mechanical dyssynchrony and predicts acute response to cardiac resynchronization therapy. J Cardiovasc Electrophysiol. 2008;19:392–399.
18 Ypenburg C, Van Bommel RJ, Marsan NA, et al. Effects of interruption of long-term cardiac resynchronization therapy on left ventricular function and dyssynchrony. Am J Cardiol. 2008;102:718–721.
19 Soliman O, II., Geleijnse ML, Theuns DAMJ, et al. Usefulness of left ventricular systolic dyssynchrony by real-time three-dimensional echocardiography to predict long-term response to cardiac resynchronization therapy. Am J Cardiol. 2009;103:1586–1591.
20 van Dijk J, Knaapen P, Russel IK, et al. Mechanical dyssynchrony by 3D echo correlates with acute haemodynamic response to biventricular pacing in heart failure patients. Europace. 2008;10:63–68.
21 Ypenburg C, van Bommel RJ, Delgado V, et al. Optimal left ventricular lead position predicts reverse remodeling and survival after cardiac resynchronization therapy. J Am Coll Cardiol. 2008;52:1402–1409.
22 Johri AM, Picard MH, Newell J, et al. Can a teaching intervention reduce interobserver variability in LVEF assessment: A quality control exercise in the echocardiography lab. J Am Coll Cardiol Cardiovasc Imag. 2011;4:821–829.
23 Mor-Avi V, Jenkins C, Kuhl HP, et al. Real-time 3-dimensional echocardiographic quantification of left ventricular volumes: Multicenter study for validation with magnetic resonance imaging and investigation of sources of error. J Am Coll Cardiol Cardiovasc Imag. 2008;1:413–423.
24 Miller CA, Pearce K, Jordan P, et al. Comparison of real-time three-dimensional echocardiography with cardiovascular magnetic resonance for left ventricular volumetric assessment in unselected patients. Eur Heart J Cardiovasc Imag. 2012;13:187–195.
25 Kleijn SA, Aly MFA, Terwee CB, et al. Reliability of left ventricular volumes and function measurements using three-dimensional speckle tracking echocardiography. Eur Heart J Cardiovasc Imag. 2012;13:159–168.
[/level-membership-for-cardiovascular-category][not-level-membership-for-cardiovascular-category]
Chapter 12 Assessment of Left Ventricular Mechanical Dyssynchrony
Real-time three-dimensional echocardiography (RT3DE) has proven to be the most reliable and reproducible echocardiographic measure of left ventricular volumes, ejection fraction (EF), and mass.1,2 The advent of the matrix array transducer and improvements in parallel processing technologies have improved the temporal and spatial resolution of the volumes acquired, and full left ventricle (LV) datasets can now be obtained in a single heartbeat on some commercial systems.3
Mechanical dyssynchrony, an uncoordinated pattern of left ventricular contraction, has been described in a variety of patient cohorts, including those with left ventricular systolic dysfunction and right ventricular pacing. A reliable and reproducible measure of left ventricular mechanical dyssynchrony has proved elusive, as evidenced by the Predictors of Response to CRT (PROSPECT) study, which demonstrated poor agreement between multiple two-dimensional (2D), M-mode echocardiographic, and tissue Doppler measures of dyssynchrony in patients undergoing cardiac resynchronization therapy (CRT).4 The inability to image the entire LV simultaneously also was noted as a drawback to these measures.
Kapetanakis and colleagues5 proposed RT3DE quantification of regional myocardial function as an accurate measure of left ventricular mechanical dyssynchrony, which might overcome the shortcomings of traditional measures of dyssynchrony. This method is based on the construction of a cast of the LV using semiautomated endocardial border recognition throughout the cardiac cycle. The cast is then segmented into 16 or 17 segments around a central axis, corresponding to American Society of Echocardiology guidelines (Figure 12-1; Video 12-1). Segmental volume or time curves are constructed, and a dyssynchrony index (SDI-16 or SDI-17) is calculated on the basis of the standard deviation of the time to minimal segmental volume as a percentage of the R-R interval (Figure 12-2; Video 12-2). Indexing to the R-R interval allows comparison of the systolic dyssynchrony index (SDI) between subjects with differing heart rates. This method has been validated against cardiac magnetic resonance imaging (MRI) and single-photon emission computed tomography for the assessment of left ventricular dyssynchrony and has been shown to correlate well with other echocardiographic measures of dyssynchrony, such as tissue Doppler.6–8
Time and Volume Curves
The software for LV analysis produces plots of the absolute segmental volume against time as well as normalized volume curves. When the absolute volumes are normalized such that the greatest volume represents 100%, the difference between 100% and the average of the minimum segmental volumes represents the EF. Segmental volume curves may be viewed individually, but the pattern of segmental contraction is useful and forms the basis of the SDI. The minimum volume point is identified on each curve. In a normal ventricle, the spread of the minimum volume points is narrow, leading to a low standard deviation from the mean time (see Figure 12-2). The volume curves may be used to identify regional wall motion abnormalities due to differences in amplitude between segments (Figure 12-3). A septal flash also is readily identified using the volume curves (Figure 12-4).
Contraction Front Mapping
Contraction front mapping analyzes temporal and spatial activation of left ventricular contraction, representing the myocardial segments that reach peak contraction every 25 ms on a color-coded polar map of the LV. As the contraction front spreads through the ventricle, the color changes from red to blue, allowing areas of late contraction to be easily identified. The normal left ventricular activation pattern is homogeneous and rapid (Figure 12-5; Video 12-3). The activation pattern in patients with left ventricular systolic dysfunction is variable, but generally a U-shaped activation pattern is noted (Figures 12-6 and 12-7; Videos 12-4 and 12-5). In our experience, the region of maximal delay most commonly appears to be the septum, leading to a predominant left-to-right color transition. No definite pattern has been established in cases of left bundle branch block, although a septal flash may be identified in some cases (Figure 12-8; Video 12-6). This tool also has been used to identify regional wall motion abnormalities at rest and during stress echocardiography.
Reproducibility of Systolic Dyssynchrony Index
Excellent reproducibility was noted in the original description of SDI.5 The authors described test-retest variability ranging from 1% for end-diastolic volume (EDV) to 4.6% for SDI. Intraobserver variability ranged from 0.6% for EDV to 8.1% for SDI, and interobserver variability ranged from 3.5% for EDV to 6.4% for SDI. The investigators further tested the reproducibility of the technique in a two-center study involving institutions in the United Kingdom and Hong Kong.9 To ensure that methods were comparable, a cross-site training program was devised with 20 “training” datasets. The authors reported excellent agreement at the end of the training period. Subsequently, datasets of 62 patients with reduced left ventricular systolic function who were planned for cardiac resynchronization therapy were shared between the two sites and independently analyzed. Intraclass correlation (ICC) coefficients in this study were excellent at greater than 0.8 for all parameters studied (EDV, end-systolic value [ESV], EF, and SDI). Interhospital variability was 2.9% for EDV, 1% for ESV, 7.1% for EF, and 7.6% for SDI.
Soliman and colleagues10 elucidated reproducibility further by categorizing dataset quality in 50 randomly selected patients included in their study and noted the reproducibility of SDI to be better in patients with good-quality datasets (interobserver variability of 9% and ICC of 0.99 in patients with good-quality datasets compared with interobserver variability of 16% and ICC of 0.95 in patients with moderate-quality datasets). Overall excellent reproducibility was noted in this study (interobserver variability of 12%, intraobserver variability of 10% for SDI, and both interclass correlation coefficients >0.95).
Normal Values for Systolic Dyssynchrony Index
A number of studies have sought to establish normal values for SDI. On the basis of current evidence, the normal value of the SDI-16 appears to be approximately 3% to 4%, with a maximal value below 6% in normal individuals.5,10–14 There appears to be a normal apex-to-base contraction gradient, which creates a peristaltic-type contraction pattern in the normal heart.12–13 There does not appear to be a significant difference between genders, and SDI does not appear to change significantly with increasing age. A strong negative correlation between SDI-16 and EF has been shown in several studies, and SDI has been demonstrated to be independent of QRS duration.5,7,12
Clinical Significance of Systolic Dyssynchrony Index
Right Ventricular Pacing
Right ventricular pacing has been shown to increase the SDI and to disrupt the normal apex-to-base contraction gradient of the heart.15 This is particularly true in patients with right ventricular apical pacing and is associated with a reduction in left ventricular ejection fraction. Baseline reduced left ventricular systolic function and high pacing burden appear to worsen this phenomenon.16 This phenomenon suggests a potential mechanism for the worsened left ventricular systolic function observed in patients undergoing right ventricular pacing.
Predicting Response to Cardiac Resynchronization Therapy and Assessing Response
Several studies have shown responders to have a significantly higher baseline SDI and a significantly greater acute drop in SDI after biventricular (BiV) pacemaker implantation. In patients with CRT devices, RT3DE has been used to demonstrate acute changes in left ventricular volumes, EF, and SDI between the CRT-on and CRT-off modes. SDI-16 has been shown to predict response to CRT in single-center studies.17–20 The regional volume curves generated allow identification of the latest contracting segment. There is evidence that siting the left ventricular pacing lead as close as possible to the latest contracting segment provides incremental benefit.21 There is emerging evidence that persistently elevated SDI after CRT can identify a subpopulation of patients who will benefit from device optimization.
Technique for Left Ventricle Analysis
1. The end-systolic and end-diastolic frames are identified, and the axis of the LV is identified using the apex and mitral valve annulus as landmarks (Figure 12-9; Video 12-7).
2. The endocardial border is identified at end systole and end diastole in three cut frames corresponding to the traditional 2D apical views (four-chamber, two-chamber, and long-axis views). This is performed in the same manner as Simpson’s biplane view, excluding the endocardial trabeculae and papillary muscles. There is usually a tradeoff between the accuracy of estimated volumes compared with MRI and accuracy of tracking. Placing the border more subendocardially to mid-myocardially improves the correlation between 3D echocardiography and MRI volumes. However, this may be at the cost of accurate tracking, leading to a less accurate SDI. Our practice is initially to place the borders further out. However, if tracking proves inaccurate, we move the border closer to the blood-tissue interface (Figure 12-10; Videos 12-8 to 12-10).
3. These data are then used to generate a model of the LV throughout the cardiac cycle using endocardial border detection software (see Figure 12-1
[/not-level-membership-for-cardiovascular-category]
