[level-membership-for-hematology-oncology-and-palliative-medicine-category]
Chapter 5 Assessing Response to Therapy
Introduction
Cancer continues to be a major health problem as one in four deaths in the United States is due to cancer. However, we continue to see incremental improvements over time with the relative 5-year survival rate for cancer in the United States at 68%, up from 50% in the mid 1970s. Cancer death rates fell 21.0% among men and 12.3% among women during the 1991 to 2006 period in the United States. The American Cancer Society estimates that the cancer incidence decreased 1.3%/yr among men from 2000 to 2006 and 0.5%/yr from 1998 to 2006 among women. This decline is attributed mainly to falling smoking rates, improved cancer treatments, and earlier detection of cancer.1
For both the individual patient and clinical trial patients, close communication between the interpreting doctor and the referring physician is necessary for deciding the most appropriate imaging technique to use and when to perform a follow-up study to assess response. Appropriate care in planning the imaging component of clinical trials is essential, which may include proper imaging techniques, analysis, reporting, image transfer, and designing forms that may need to be filled out for these studies. Ideally, these imaging modalities and measurements are identical in both individual and trial patients, which may make clinical imaging research easier to perform or even to incorporate an individual patient into a clinical trial. Such planning will avoid added costs of repeat imaging or the need to go back and reanalyze images. Many of these imaging strategies could be made easier by accreditation of the imaging facility by the ACR (American College of Radiology) because it will ensure that the imaging equipment and qualifications of staff and physicians are registered, which then makes it easier to participate in clinical imaging trials such as ACRIN (American College of Radiology Imaging Network). Ensuring the high quality of imaging benefits primarily our patients but also allows easy participation in clinical research, which is the foundation of continuing improvement in our various specialties.
General Imaging Strategies
Key Points
• Multidisciplinary approach to cancer care will require multimodality, subspecialty imaging.
• Novel therapies will require improved imaging indices to assess extent of disease and response.
• Multimodality imaging expertise and rapid communication between physicians and reporting are a must.
• Integration of imaging into clinical trial planning and accreditation is encouraged.
Why do We Need to Monitor Tumor Response?
History of an Evolving Imaging-based Response Assessment
An early study to assess response was done by Moertel and Hanley,2 in which 16 experienced oncologists were asked to measure 12 simulated tumors, placed underneath foam, using their clinical methods, which entailed physical examination with a ruler or caliper. Although seemingly crude, this was an appropriate simulation of the clinical setting in which a physician will palpate a tumor and then estimate its size before and after administering the treatment. This paper suggested that a 50% reduction in the perpendicular diameters of the tumors done at approximately 2 months is an acceptable objective response rate. This 50% reduction in bidimensional measurement of a single lesion was adopted in the World Health Organization (WHO) guidelines in 1979. Miller3 and coworkers recommended that a partial response be identified if there is a 50% reduction in the bidimensional measure of tumor area or, if multiple tumors are present, the sum of the product of the diameters. This study also described unidimensional measurements for “measurable” disease, bone metastases, and criteria for “nonmeasurable” disease. Tumor volume estimates were based on conventional radiography techniques by measuring the two longest perpendicular diameters and their product. Although widely used, obvious shortcomings of the WHO guidelines were the clinical foundation of the criteria without accounting for the improvements in imaging to determine tumor volumes. Tumors are rarely round or symmetrical, thus making these measurements difficult to implement, particularly by using a ruler or calipers. The lack of distinction between a complete versus a partial response in 50% to 90% decrease in tumor volume was an obvious flaw.
The European Organization of Research and Treatment of Cancer (EORTC) and the National Cancer Institute (NCI) of the United States and Canada set up a study group (RECIST)4 to standardize assessment criteria in cancer treatment trials. The objective was to simplify and standardize the methods to assess tumor response by more precisely defining tumor targets with proposed guidelines on imaging methods. Revisions on complete response, partial response, stable disease, and progressive disease were done. Unidimensional measurements were established for lesions of 2 cm or larger for CT, MRI, plain film, and physical examination and 1 cm or larger for spiral CT scan. The sum of the unidimensional tumor measurements was used for evaluation of response, which may decrease the sources of error.
RECIST 1.1: The Current Standard
The major changes of RECIST 1.1 include the number of lesions required to assess tumor burden for response determination has been reduced to a maximum of five total (and two per organ, maximum). Assessments of pathologic lymph nodes with a short axis of 15 mm are considered measurable and assessable as target lesions. The short-axis measurement should be included in the sum of lesions in calculation of tumor response. Nodes that shrink to less than 10 mm on the short axis are considered normal. Confirmation of response is required for trials with response primary endpoint but is no longer required in randomized studies because the control arm serves as appropriate means of interpretation of data. Disease progression is clarified in several aspects: in addition to the previous definition of progression in target disease of 20% increase in sum, a 5-mm absolute increase is now required as well to guard against overcalling progressive disease when the total sum is very small. Furthermore, guidance is offered on what constitutes “unequivocal progression” of nonmeasurable/nontarget disease, a source of confusion in the original RECIST guidelines. Finally, a section on detection of new lesions, including the interpretation of 2-[18F] fluoro-2-deoxy-D-glucose (FDG)–PET scan assessment, is included. Finally, the revised RECIST 1.1 includes a new imaging appendix with updated recommendations on the optimal anatomical assessment of lesions.5
Although these anatomic criteria have been evolving to affect better response criteria, the RECIST criteria and now, quite likely, the RECIST 1.1 criteria are or will be used in virtually every clinical trial of new solid tumor therapeutics, because response is essentially always measured. Regulatory agencies have accepted RECIST as the standard in response assessment for clinical trials in most countries. Familiarity with the implications of trials in which response is measured using the WHO, RECIST, and RECIST 1.1 criteria is essential because they are not identical and do not produce identical results. Table 5-1 presents RECIST 1.1 overall response criteria for both measurable and nonmeasurable lesions.
| Objective response | RECIST 1.1 target lesions* change in sum of LDs, maximum of two per organ up to five total. |
| Complete response |
CT, computed tomography; FDG, fluoro-2-deoxy-D-glucose; LD, lesion diameter; RECIST, Response Evaluation Criteria in Solid Tumors.
* Measurable lesion, unidimensional (LD only: size with conventional techniques ≥ 20 mm, with spiral CT ≥ 10 mm; nodes: target short axis ± 15 mm, nontarget 10- to 15-mm nodes, normal < 10 mm). Nonmeasurable: all other lesions, including small lesions; evaluable is not recommended.
From Eisenhauer EA, Therasse P, Bogaerts J, et al. New response evaluation criteria in solid tumours: revised RECIST guideline (version 1.1). Eur J Cancer. 2009;45:228-247.
Highlighting Sources of Errors in Response Evaluation
Possible Problems Related to Image Acquisition
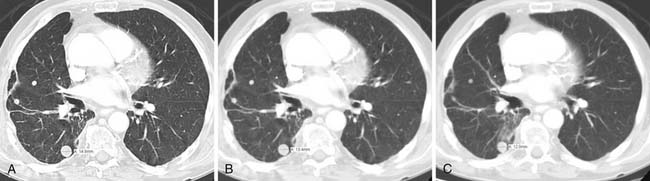
Multiple imaging modalities are utilized and are continuously updated over time, presenting differences in equipment capabilities from within a manufacturer and across competing imaging equipment makers. CT has undergone significant evolution in a short period of time and it is the most commonly used modality for therapeutic clinical trials. Image acquisition protocols vary as to body region or organ being evaluated. The proper phase of contrast has to be consistently used, as is proper windowing and ensuring that the entire tumor or organ is imaged (Figure 5-1). Breathing and cardiac motion can induce variations in tumor measurement. MRI is commonly used in certain tumor types not amenable to CT evaluation. There is a wide range of MRI acquisition techniques, which can make comparisons between studies difficult. Rigorous attention to protocol has to be enforced to prevent these problems, particularly if repeated examinations are done in the same and, worse, different machines. It is imperative that those patients who are for clinical trials or individual patients referred for response evaluation are identified and the appropriate imaging acquisition is applied. Most important for clinical trials incorporating imaging for response is the proper consultation and selection of imaging experts up front to ensure that the proper endpoints for both baseline and follow-up for response are identified; the imaging protocol be consistent; time and effort to make these measurements, forms to be filled out, and images to be transferred be properly anticipated and funded.
Errors Due to Target Selection
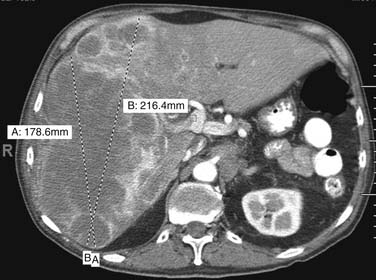
There are very few well demarcated, uniform, round tumors. Most tumors are difficult to measure precisely and reproducibly. Tumors could be difficult to delineate from normal structures, including blood vessels. Intravenous contrast administration, timing of acquisition, proper phase selection, and windowing are crucial in minimizing this problem. A potential problem would be using a chest CT to measure liver lesions and, conversely, using abdominal scans to measure lung base lesions. Some tumors are difficult to measure because they are heterogenous and cystic (Figure 5-2). Complex tumor spread such as in peritoneal carcinomatosis is difficult to incorporate into measurements, but this may be used to assess for progression and/or response. Tumor involvement of organs such as the ovary present complex problems because it may be difficult to distinguish tumor from normal tissue after therapy; thus, complete response is difficult or impossible to assess. Bone metastases should not be included as measurable lesions because they would calcify and enlarge. Certain tumors such as gastrointestinal stromal tumor (GIST) could respond to therapy with cystic changes and sometimes enlargement of these cystic lesions. Pleural and peritoneal lesions may have a predominantly liquid component and could be loculated, making them difficult to measure and assess for response.
Errors in Tumor Measurement
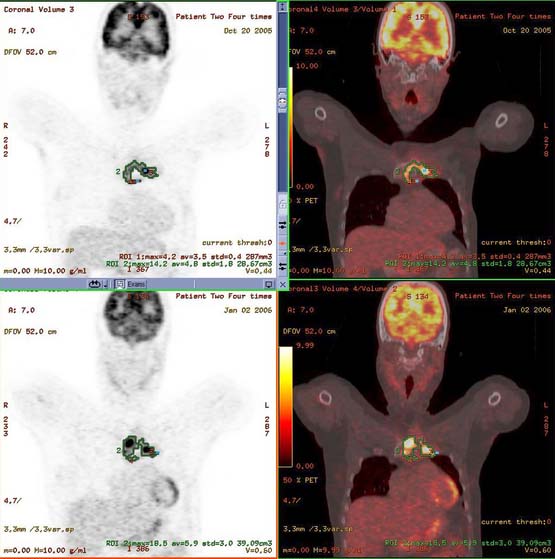
Minimum size requirements, usually 10 mm, plus measurement of the largest cross-section of the tumor should be kept in mind. Liver lesions should be measured using the proper enhancement or even nonenhancement technique consistently. Cystic and necrotic components of tumors will evolve and may have a different response from that of the solid component of the tumor. Thus, it may be difficult to assess response in these heterogenous tumors (Figure 5-3).
Errors Related to Nontumor Conditions
How Is Response Determined on PET?
Qualitative Technique
The best implementation of the qualitative technique is in the Revised Response Criteria for Malignant Lymphoma, developed through the International Harmonization Project. Juweid and colleagues6 classified FDG-PET results into visual findings as positive or negative relative to the intensity of tumor tracer uptake, as compared with the blood pool or nearby normal structures. These dichotomized findings are for interpretation of scans at the end of standard therapy, specifying minimum times after treatment to avoid inflammatory changes. Guidance to interpretation is provided for specific areas such as the lungs, liver, and bone marrow, which can provide consistency in response evaluation but is cognizant of the limitations of FDG-PET in identifying low-grade tumors as in the marrow.
However, the difficulty still lies in the intermediate pattern or minimal residual uptake described by Mikhaeel and associates,7 in which in a study of 102 patients evaluated with FDG-PET at midtreatment for aggressive lymphoma, 19 patients had scans with minimal residual uptake and had an estimated 5-year progression-free survival of 59.3%, closer to the 88.8% for the PET-negative group (n = 50) than to the 16.2% for the PET-positive group (n = 52).
Hicks and MacManus and coworkers8,9 have used the visual qualitative analysis criteria to predict outcomes at the end of therapy for non–small cell lung cancer with excellent risk stratification capability between FDG-positive and FDG-negative scans. Hicks10 has argued for qualitative assessments and has emphasized that a reduction in tissue FDG retention, however it is measured and at whatever time after treatment it is recorded, is more likely to be associated with both a pathologic response and improved survival than is a lack of change.
Quantitative Technique
PET is inherently a quantitative imaging technique and the measurement of treatment-induced changes is an attractive tool for assessing early response to therapy (before anatomic changes are seen).11
There are numerous quantitative techniques developed, but the nonlinear regression (NLR) of the full compartment model is theoretically the most accurate quantitative measure of glucose metabolic rate. It may be the best but is also the most technically demanding because it would require dynamic imaging for 60 minutes (imaging over the area of interest) during tracer injection, multiple blood samples to measure whole blood, plasma FDG concentration (in a well counter), as well as an arterial input function from either the images or arterial blood samples. The Amsterdam Group has done an illustrative study in 20 women with advance breast cancer and compared the NLR with 10 simplified quantitative techniques. They noted that the Patlak, Simplified Kinetic Method, and the standardized uptake value (SUV) normalized for lean body mass and blood glucose were the most promising alternatives to the NLR technique.12
The SUV is a widely used metric for assessing tissue accumulation of tracers defined as the ratio of radioactivity in tissue per milliliter (in mCi/mL) divided by the decay corrected activity injected to the patient (in mCi/body weight in g). The body weight is the parameter most commonly used, but body surface area (BSA), standardized uptake value corrected for lean body mass (SUL), and others may also be employed.13 BSA and SUL are less dependent on body habitus across populations than is SUV based on total body mass. The determination of SUV is dependent on identical patient preparation and adequate scan quality that is similar between the baseline and the follow-up studies. Absolute and rigorous standardization of the protocol for PET is required to achieve reproducible SUVs. Differences between image reconstruction parameters and imaging pediatric patients can also result in significant SUV changes. Ramos and colleagues14 demonstrated that the use of different reconstruction methods such as iterative reconstruction and segmented attenuation correction (IRSAC) seem to give more accurate SUVs than are obtained from conventional filtered backprojection images. Yeung and associates15 demonstrated that SUV calculations on the basis of BSA is a more uniform parameter than SUV based on body weight in pediatric patients and is probably most appropriate in the follow-up of these patients. It is important to remember that significant differences occur in SUV measurements between dedicated PET scans and PET/CT scans. More recently, FDG-PET/CT studies are being acquired in conjunction with intravenous contrast, which can alter SUVs. It is worth noting that studies have shown no significant difference in the diagnostic accuracy of scan interpretation when readers are blinded to the reconstruction method using CT with or without intravenous contrast.16 Recent software reconstruction enhancements have allowed the FDG-PET/CT scans to be less susceptible to the effects of orally administered contrast or the presence of prosthetic devices.17 Motion-correction techniques such as average CT have been proposed to allow correction for both pulmonary and cardiac motion.18 These SUV changes appear magnified at the lung bases, where obviously, the motion is largest. These motion-correction techniques not only allow more accurate SUV measurement but also improve PET and CT tumor matching, which may facilitate interpretation. These are applicable not only to lung lesions but also in esophageal cancers and lesions involving the upper abdominal organs such as the liver, adrenals, and spleen.19 These motion-correction techniques have had applications in radiotherapy planning particularly for tumor volume delineation in thoracic tumors.20
Standardization has been well summarized in guidelines set by the Society of Nuclear Medicine (SNM) and the European Association of Nuclear Medicine (EANM) for FDG-PET/CT imaging in oncology. This is a concerted effort to standardize imaging performance, including quality assurance/quality control procedures in an effort to allow improved consistency of imaging and interpretation, and more importantly, allow improved quantification of response using SUVs.21,22
The PERCIST 1.0 was drafted by Wahl and coworkers23 as a framework that may be useful for consideration in clinical trials or individual patients. An important premise offered by PERCIST is that cancer response assessed by PET is a continuous and time-dependent variable. An important concept is that a reduction in FDG uptake in tumor is expected to decline after effective therapy; hence, the change from baseline and the time it was obtained are important. RECIST confines us to four bins (CR [complete response], PR [partial response], SD [stable disease], and PD [progressive disease]) in a dynamic continuous process of response assessment.
PERCIST mandates standardized imaging as outlined by Shankar and colleagues24 on the recommendations of the NCI for the performance of FDG-PET scans for clinical trials. This would require standard FDG doses (±20%), uptake time (50-70 min), patient preparation (fasting 4-6 hr), fasting blood sugar (FBS) less than 200 mg/dL, uniform image acquisition, and reconstruction parameters.
Wahl and coworkers23 suggest that early after treatment (i.e., after one cycle, just before the next cycle) may be a reasonable time for monitoring response to determine whether the tumor shows no primary resistance to the treatment. This was supported by multiple studies, one on ovarian cancer, showing that 60% to 70% of the total SUV decline occurs after just one cycle of effective treatment.25 Performing the PET scan at the end of treatment can provide evidence that resistance to therapy was present during treatment. End-of-therapy PET scans are most commonly performed as restaging examinations to determine whether additional treatment should be performed.26
Progressive metabolic disease (PMD) requires a 30% increase in FDG SUL peak, with greater than 0.8 SUL unit increase in tumor SUV peak from baseline scan. This may be documented with a visible increase in extent of FDG tumor uptake or new FDG-avid lesions that are typical of cancer and not related to treatment effect or infection. PMD other than new visceral lesions should be confirmed on follow-up study within 1 month unless PMD also is clearly associated with progressive disease by RECIST 1.1. Additional clarification on the nuances of assessing progression could be found in the article and a summary of the categories of response is presented in Table 5-2.
| CATEGORY OF RESPONSE | PERCIST 1.0 |
|---|---|
| Complete metabolic response |
FDG, fluoro-2-deoxy-D-glucose; PERCIST, PET Response Evaluation Criteria in Solid Tumors; SUL, standardized uptake value corrected for lean body mass; TLG, tumor lesion glycolysis.
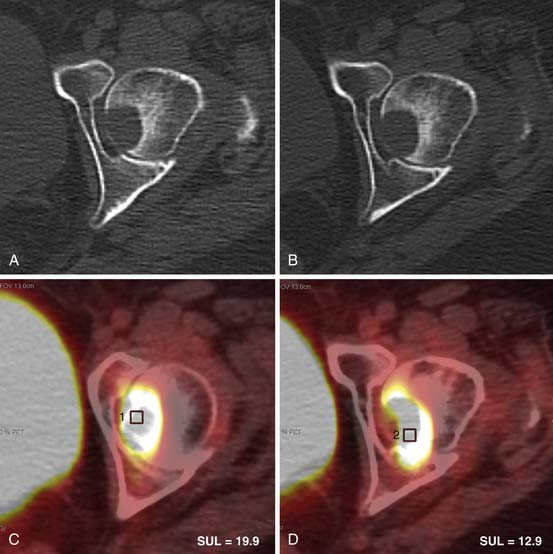
Bone metastases are a common manifestation of advanced disease and can be detected by plain films, bone scanning, CT, MRI, and FDG-PET. RECIST 1.1 currently considers bone metastases with soft tissue masses greater than 10 mm to be measurable disease. The University of Texas M. D. Anderson Cancer Center criteria (MDA criteria) were developed specifically for bone metastases and can be used to assess response (Table 5-3). The MDA criteria divide response into four standard categories (CR, PR, PD, and SD) and include quantitative and qualitative assessments of the behavior of bone metastases (Table 5-4). A recent review by Costelloe and associates27 shows that the MDA criteria in some studies better differentiate responders from nonresponders after chemotherapy. The MDA criteria can also show correlation with progression-free survival in breast cancer patients. MDA bone response criteria more closely reflect the behavior of bone metastases on radiography and CT and can be used as guidelines for the interpretation of these studies whether or not a patient is enrolled in a therapeutic trial (Figure 5-4).
Table 5-3 RECIST 1.1 Nontarget Lesion Response Criteria
| Objective response | RECIST 1.1 nontarget lesions |
| Complete response | Disappearance of all nontarget lesions and normalization of tumor markers, confirmed at ≥ 4 wk. |
| Nonprogressive disease | Persistence of one or more nontarget lesions or tumor markers above normal limits. |
| Progressive disease |
PD, progressive disease; PET, positron-emission tomography; RECIST, Response Evaluation Criteria in Solid Tumors.
* Stably positive PET is not PD if it corresponds to anatomic non-PD.
From Costelloe CM, Chuang HH, Madewell JE, Ueno NT. Cancer response criteria and bone metastases: RECIST 1.1, MDA and PERCIST. J Cancer. 2010;1:80-92.
Table 5-4 M. D. Anderson Response Criteria for Bone Metastases
| CATEGORY OF RESPONSE | M. D. ANDERSON CRITERIA FOR BONE METASTASES |
|---|---|
| Complete response |
Development of a sclerotic rim or partial sclerotic fill-in of lytic lesions on x-ray or CT.
Osteoblastic flare: Interval visualization of lesions with sclerotic rims or new sclerotic lesions in the setting of other signs of PR and absence of progressive bony disease.
≥50% decrease in measurable lesions on x-ray, CT, or MRI.
≥50% subjective decrease in the size of ill-defined lesions on x-ray, CT, or MRI.
CT, computed tomography; MRI, magnetic resonance imaging; PR, partial response; SS, skeletal scintigraphy.
From Costelloe CM, Chuang HH, Madewell JE, Ueno NT. Cancer response criteria and bone metastases: RECIST 1.1, MDA and PERCIST. J Cancer. 2010;1:80-92.
Beyond these upcoming indices discussed which are essentially CT and FDG-PET parameters, multiple new techniques including a range of functional magnetic resonance imaging (fMRI) techniques, CT perfusion, novel PET/SPECT (single-photon emission computed tomography) tracers, and microbubble ultrasonography are being developed. These multiple parameters may be selectively incorporated in the future as standards in evaluating response to therapy.28
Key Points
• RECIST 1.1 criteria will be adopted by multiple investigators, cooperative groups, and industry and government entities in assessing treatment outcomes.
• PERCIST 1.0 is a proposed plan to use FDG-PET in assessing treatment response and may be adopted and incorporated into clinical trials.
• Familiarity and use of RECIST and PERCIST criteria will allow participation in clinical trials and application of similar guidelines may improve individual patient care.
1. Jemal A., Siegel R., Xu J., Ward E. Cancer statistics, 2010. CA Cancer J Clin. 2010;60:277-300.
2. Moertel C.G., Hanley J.A. The effect of measuring error on the results of therapeutic trials in advanced cancer. Cancer. 1976;38:388-394.
3. Miller A.B., Hoogstraten B., Staquet M., Winkler A. Reporting results of cancer treatment. Cancer. 1981;47:207-214.
4. Therasse P., Arbuck S.G., Eisenhauer E.A., et al. New guidelines to evaluate the response to treatment in solid tumors. European Organization for Research and Treatment of Cancer, National Cancer Institute of the United States, National Cancer Institute of Canada. J Natl Cancer Inst. 2000;92:205-216.
5. Eisenhauer E.A., Therasse P., Bogaerts J., et al. New response evaluation criteria in solid tumours: revised RECIST guideline (version 1.1). Eur J Cancer. 2009;45:228-247.
6. Juweid M.E., Wiseman G.A., Vose J.M., et al. Response assessment of aggressive non-Hodgkin’s lymphoma by integrated International Workshop Criteria and fluorine-18-fluorodeoxyglucose positron emission tomography. J Clin Oncol. 2005;23:4652-4661.
7. Mikhaeel N.G., Hutchings M., Fields P.A., et al. FDG-PET after two to three cycles of chemotherapy predicts progression-free and overall survival in high-grade non-Hodgkin lymphoma. Ann Oncol. 2005;16:1514-1523.
8. Hicks R.J., MacManus M.P., Matthews J.P., et al. Early FDG-PET imaging after radical radiotherapy for non-small-cell lung cancer: inflammatory changes in normal tissues correlate with tumor response and do not confound therapeutic response evaluation. Int J Radiat Oncol Biol Phys.. 2004;60:412-418.
9. MacManus M.P., Hicks R.J., Matthews J.P., et al. Positron emission tomography is superior to computed tomography scanning for response-assessment after radical radiotherapy or chemoradiotherapy in patients with non-small-cell lung cancer. J Clin Oncol. 2003;21:1285-1292.
10. Hicks R.J. Role of 18F-FDG PET in assessment of response in non-small cell lung cancer. J Nucl Med. 2009;50(suppl 1):S31-S42.
11. Weber W.A., Wieder H. Monitoring chemotherapy and radiotherapy of solid tumors. Eur J Nucl Med Mol Imaging. 2006;33(suppl 1):27-37.
12. Krak N.C., van der Hoeven J.J., Hoekstra O.S., et al. Measuring [18F]FDG uptake in breast cancer during chemotherapy: comparison of analytical methods. Eur J Nucl Med Mol Imaging. 2003;30:674-681.
13. Graham M.M., Peterson L.M., Hayward R.M. Comparison of simplified quantitative analyses of FDG uptake. Nucl Med Biol.. 2000;27:647-655.
14. Ramos C.D., Erdi Y.E., Gonen M., et al. FDG-PET standardized uptake values in normal anatomical structures using iterative reconstruction segmented attenuation correction and filtered back-projection. Eur J Nucl Med. 2001;28:155-164.
15. Yeung H.W., Sanches A., Squire O.D., et al. Standardized uptake value in pediatric patients: an investigation to determine the optimum measurement parameter. Eur J Nucl Med Mol Imaging. 2002;29:61-66.
16. Mawlawi O., Erasmus J.J., Munden R.F., et al. Quantifying the effect of IV contrast media on integrated PET/CT: clinical evaluation. AJR Am J Roentgenol. 2006;186:308-319.
17. Mawlawi O., Pan T., Macapinlac H.A. PET/CT imaging techniques, considerations, and artifacts. J Thorac Imaging. 2006;21:99-110.
18. Pan T., Mawlawi O., Luo D., et al. Attenuation correction of PET cardiac data with low-dose average CT in PET/CT. Med Phys.. 2006;33:3931-3938.
19. Tonkopi E., Chi P.C., Mawlawi O., et al. Average CT in PET studies of colorectal cancer patients with metastasis in the liver and esophageal cancer patients. J Appl Clin Med Phys.. 2010;11:3073.
20. Chi P.C., Mawlawi O., Luo D., et al. Effects of respiration-averaged computed tomography on positron emission tomography/computed tomography quantification and its potential impact on gross tumor volume delineation. Int J Radiat Oncol Biol Phys.. 2008;71:890-899.
21. Delbeke D., Coleman R.E., Guiberteau M.J., et al. Procedure guideline for tumor imaging with 18F-FDG PET/CT 1.0. J Nucl Med. 2006;47:885-895.
22. Boellaard R., O’Doherty M.J., Weber W.A., et al. FDG PET and PET/CT: EANM procedure guidelines for tumour PET imaging: version 1.0. Eur J Nucl Med Mol Imaging. 2010;37:181-200.
23. Wahl R.L., Jacene H., Kasamon Y., Lodge M.A. From RECIST to PERCIST: evolving considerations for PET response criteria in solid tumors. J Nucl Med. 2009;50(suppl 1):S122-S150.
24. Shankar L.K., Hoffman J.M., Bacharach S., et al. Consensus recommendations for the use of 18F-FDG PET as an indicator of therapeutic response in patients in National Cancer Institute Trials. J Nucl Med. 2006;47:1059-1066.
25. Avril N., Sassen S., Schmalfeldt B., et al. Prediction of response to neoadjuvant chemotherapy by sequential F-18-fluorodeoxyglucose positron emission tomography in patients with advanced-stage ovarian cancer. J Clin Oncol. 2005;23:7445-7453.
26. Cheson B.D., Pfistner B., Juweid M.E., et al. Revised response criteria for malignant lymphoma. J Clin Oncol. 2007;25:579-586.
27. Costelloe C.M., Chuang H.H., Madewell J.E., Ueno N.T. Cancer response criteria and bone metastases: RECIST 1.1, MDA and PERCIST. J Cancer. 2010;1:80-92.
28. Padhani A.R., Miles K.A. Multiparametric imaging of tumor response to therapy. Radiology. 2010;256:348-364.
[/level-membership-for-hematology-oncology-and-palliative-medicine-category][not-level-membership-for-hematology-oncology-and-palliative-medicine-category]
Chapter 5 Assessing Response to Therapy
Introduction
Cancer continues to be a major health problem as one in four deaths in the United States is due to cancer. However, we continue to see incremental improvements over time with the relative 5-year survival rate for cancer in the United States at 68%, up from 50% in the mid 1970s. Cancer death rates fell 21.0% among men and 12.3% among women during the 1991 to 2006 period in the United States. The American Cancer Society estimates that the cancer incidence decreased 1.3%/yr among men from 2000 to 2006 and 0.5%/yr from 1998 to 2006 among women. This decline is attributed mainly to falling smoking rates, improved cancer treatments, and earlier detection of cancer.1
For both the individual patient and clinical trial patients, close communication between the interpreting doctor and the referring physician is necessary for deciding the most appropriate imaging technique to use and when to perform a follow-up study to assess response. Appropriate care in planning the imaging component of clinical trials is essential, which may include proper imaging techniques, analysis, reporting, image transfer, and designing forms that may need to be filled out for these studies. Ideally, these imaging modalities and measurements are identical in both individual and trial patients, which may make clinical imaging research easier to perform or even to incorporate an individual patient into a clinical trial. Such planning will avoid added costs of repeat imaging or the need to go back and reanalyze images. Many of these imaging strategies could be made easier by accreditation of the imaging facility by the ACR (American College of Radiology) because it will ensure that the imaging equipment and qualifications of staff and physicians are registered, which then makes it easier to participate in clinical imaging trials such as ACRIN (American College of Radiology Imaging Network). Ensuring the high quality of imaging benefits primarily our patients but also allows easy participation in clinical research, which is the foundation of continuing improvement in our various specialties.
General Imaging Strategies
Key Points
• Multidisciplinary approach to cancer care will require multimodality, subspecialty imaging.
• Novel therapies will require improved imaging indices to assess extent of disease and response.
• Multimodality imaging expertise and rapid communication between physicians and reporting are a must.
• Integration of imaging into clinical trial planning and accreditation is encouraged.
Why do We Need to Monitor Tumor Response?
History of an Evolving Imaging-based Response Assessment
An early study to assess response was done by Moertel and Hanley,2 in which 16 experienced oncologists were asked to measure 12 simulated tumors, placed underneath foam, using their clinical methods, which entailed physical examination with a ruler or caliper. Although seemingly crude, this was an appropriate simulation of the clinical setting in which a physician will palpate a tumor and then estimate its size before and after administering the treatment. This paper suggested that a 50% reduction in the perpendicular diameters of the tumors done at approximately 2 months is an acceptable objective response rate. This 50% reduction in bidimensional measurement of a single lesion was adopted in the World Health Organization (WHO) guidelines in 1979. Miller3 and coworkers recommended that a partial response be identified if there is a 50% reduction in the bidimensional measure of tumor area or, if multiple tumors are present, the sum of the product of the diameters. This study also described unidimensional measurements for “measurable” disease, bone metastases, and criteria for “nonmeasurable” disease. Tumor volume estimates were based on conventional radiography techniques by measuring the two longest perpendicular diameters and their product. Although widely used, obvious shortcomings of the WHO guidelines were the clinical foundation of the criteria without accounting for the improvements in imaging to determine tumor volumes. Tumors are rarely round or symmetrical, thus making these measurements difficult to implement, particularly by using a ruler or calipers. The lack of distinction between a complete versus a partial response in 50% to 90% decrease in tumor volume was an obvious flaw.
The European Organization of Research and Treatment of Cancer (EORTC) and the National Cancer Institute (NCI) of the United States and Canada set up a study group (RECIST)4 to standardize assessment criteria in cancer treatment trials. The objective was to simplify and standardize the methods to assess tumor response by more precisely defining tumor targets with proposed guidelines on imaging methods. Revisions on complete response, partial response, stable disease, and progressive disease were done. Unidimensional measurements were established for lesions of 2 cm or larger for CT, MRI, plain film, and physical examination and 1 cm or larger for spiral CT scan. The sum of the unidimensional tumor measurements was used for evaluation of response, which may decrease the sources of error.
RECIST 1.1: The Current Standard
The major changes of RECIST 1.1 include the number of lesions required to assess tumor burden for response determination has been reduced to a maximum of five total (and two per organ, maximum). Assessments of pathologic lymph nodes with a short axis of 15 mm are considered measurable and assessable as target lesions. The short-axis measurement should be included in the sum of lesions in calculation of tumor response. Nodes that shrink to less than 10 mm on the short axis are considered normal. Confirmation of response is required for trials with response primary endpoint but is no longer required in randomized studies because the control arm serves as appropriate means of interpretation of data. Disease progression is clarified in several aspects: in addition to the previous definition of progression in target disease of 20% increase in sum, a 5-mm absolute increase is now required as well to guard against overcalling progressive disease when the total sum is very small. Furthermore, guidance is offered on what constitutes “unequivocal progression” of nonmeasurable/nontarget disease, a source of confusion in the original RECIST guidelines. Finally, a section on detection of new lesions, including the interpretation of 2-[18F] fluoro-2-deoxy-D-glucose (FDG)–PET scan assessment, is included. Finally, the revised RECIST 1.1 includes a new imaging appendix with updated recommendations on the optimal anatomical assessment of lesions.5
Although these anatomic criteria have been evolving to affect better response criteria, the RECIST criteria and now, quite likely, the RECIST 1.1 criteria are or will be used in virtually every clinical trial of new solid tumor therapeutics, because response is essentially always measured. Regulatory agencies have accepted RECIST as the standard in response assessment for clinical trials in most countries. Familiarity with the implications of trials in which response is measured using the WHO, RECIST, and RECIST 1.1 criteria is essential because they are not identical and do not produce identical results. Table 5-1 presents RECIST 1.1 overall response criteria for both measurable and nonmeasurable lesions.
| Objective response | RECIST 1.1 target lesions* change in sum of LDs, maximum of two per organ up to five total. |
| Complete response |
CT, computed tomography; FDG, fluoro-2-deoxy-D-glucose; LD, lesion diameter; RECIST, Response Evaluation Criteria in Solid Tumors.
* Measurable lesion, unidimensional (LD only: size with conventional techniques ≥ 20 mm, with spiral CT ≥ 10 mm; nodes: target short axis ± 15 mm, nontarget 10- to 15-mm nodes, normal < 10 mm). Nonmeasurable: all other lesions, including small lesions; evaluable is not recommended.
From Eisenhauer EA, Therasse P, Bogaerts J, et al. New response evaluation criteria in solid tumours: revised RECIST guideline (version 1.1). Eur J Cancer. 2009;45:228-247.
Highlighting Sources of Errors in Response Evaluation
Possible Problems Related to Image Acquisition
Multiple imaging modalities are utilized and are continuously updated over time, presenting differences in equipment capabilities from within a manufacturer and across competing imaging equipment makers. CT has undergone significant evolution in a short period of time and it is the most commonly used modality for therapeutic clinical trials. Image acquisition protocols vary as to body region or organ being evaluated. The proper phase of contrast has to be consistently used, as is proper windowing and ensuring that the entire tumor or organ is imaged (Figure 5-1
[/not-level-membership-for-hematology-oncology-and-palliative-medicine-category]
