[level-membership-for-pediatrics-category]
chapter 3 Assessing Physical Growth and Nutrition
Measurements and Growth Charts
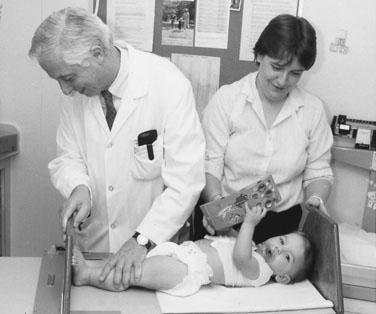
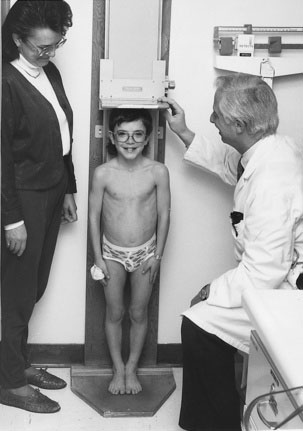
Recumbent length versus height
Because most babies younger than 10 to 12 months cannot stand alone and most toddlers refuse to stand still, any child younger than 2 years should be measured for length in the recumbent position. In children of this age group, recumbent length and standing height are not the same, the former being significantly greater. Standard growth charts for younger children are based on measurements of recumbent length. Various accurate measuring devices—some cheap, others more expensive—are available for determining recumbent length and height. The essential point is to use a stable, accurate, fixed device if both individual and serial measurements are to mean anything (Figs. 3-1 and 3-2). Accuracy is a must, but never more so than when there is the slightest concern about the child’s growth. To be absolutely sure, check all measurements at least twice, and never accept anyone else’s measurements as reliable.
Head circumference
The technique for measuring head circumference is described in Chapter 7. Be sure to check the measurement at least once to be certain it is accurate.
Large and Small Heads
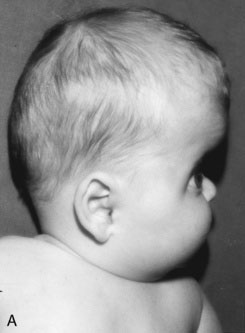
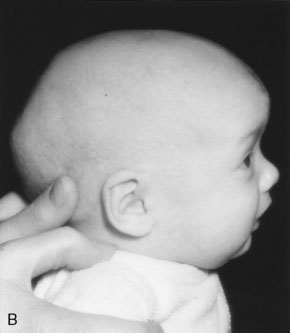
Remember that skull bones grow in a direction perpendicular to the suture lines. The directions in which the skull can and cannot grow after synostosis of a suture are therefore predictable, as is the shape of the resulting cranial distortion. For example, if the sagittal suture fuses prematurely, further lateral growth of the skull is prevented. Anteroposterior growth continues (perpendicular to the coronal sutures), and the skull will become long and narrow (a condition known as dolichocephaly) (Fig. 3-3).
Graphic recording of measurements
The child’s recumbent length or standing height, body weight, and head circumference should be recorded and plotted on appropriate age- and sex-specific growth charts. In North America, the growth charts currently used almost universally are those published in 2000 by the National Center for Health Statistics in collaboration with the National Center for Chronic Disease Prevention and Health Promotion (Fig. 3-4). These charts permit plotting of length-for-age, weight-for-age, and head circumference–for-age measurements along percentile lines, as well as plotting of body mass index (BMI) on a percentile chart.*
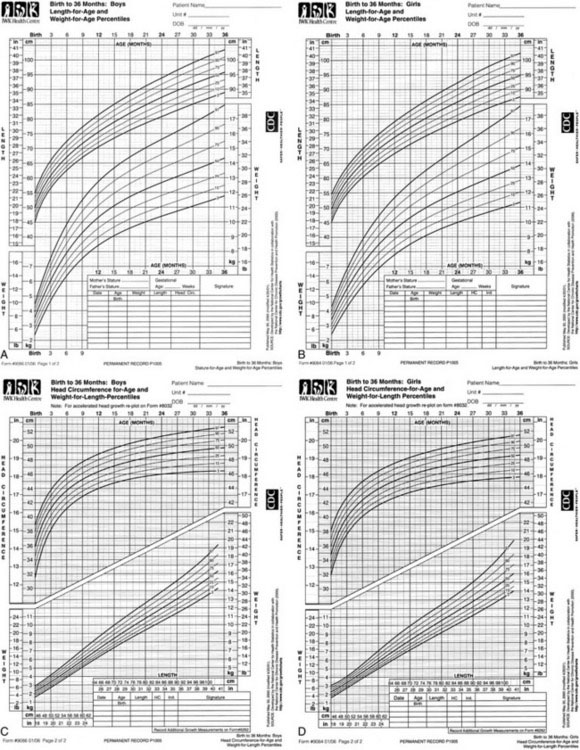
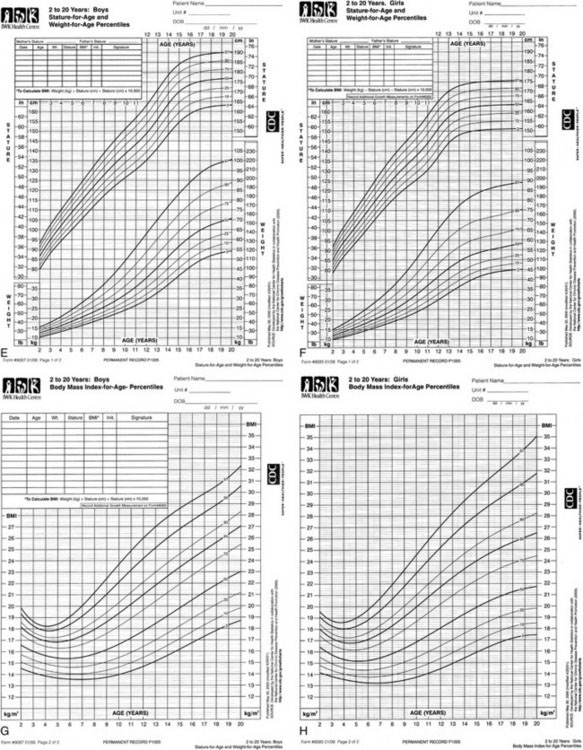
FIGURE 3-4 Growth charts for children from birth to 20 years.
(Developed by the National Center for Health Statistics in collaboration with the National Center for Chronic Disease Prevention and Health Promotion, 2000; available at http://www.cdc.gov/growthcharts.)
BMI is determined using the following formula:
Mid-parental height
Special growth charts have been developed for children with certain dysmorphic conditions, including Down syndrome, Turner syndrome, and achondroplasia (see Recommended Reading).
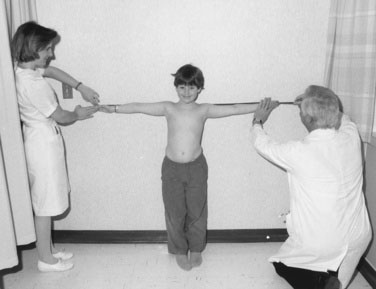
Arm span and its relationships
If a child is old enough to cooperate, you can measure the arm span by having the youngster stand with the back and heels touching the wall and the arms fully extended parallel to the floor, with the palms facing forward. With parental assistance and using a steel tape measure, measure the distance between the third fingers of each hand. The span-height difference and span-to-height ratio then can be determined (Fig. 3-5).
Measuring the upper and lower segments
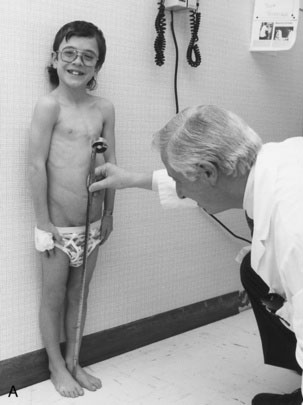
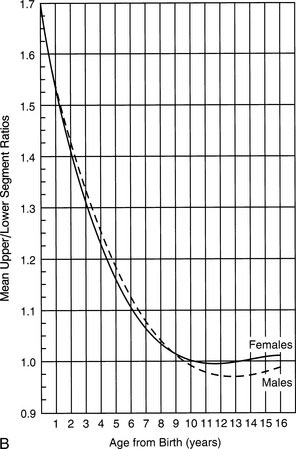
Measuring a child’s upper and lower segments is tricky and is not always supremely accurate. Obtaining these measurements requires identifying the top of the pubic ramus and marking it on the skin with a pen or wax pencil. This procedure sounds easier than it is, especially in a chubby youngster, in whom you must indent the adipose lower abdominal-suprapubic area to locate the top of the pubic bone. After you make the mark and release the pressure, the abdominal wall springs back and the mark does not always stay where you thought it was relative to the pubis. Make sure the youngster does not bend forward to look, because this movement can distort the measurement. Measure the lower segment by dropping a steel tape perpendicularly from the mark to the floor (Fig. 3-6, A). Then determine the length of the upper segment by subtracting the lower segment length from the height. Part B of Figure 3-6 shows the average upper-to-lower segment ratio at different ages. Remember that there are ethnic and familial differences in these ratios, so it is sometimes necessary to measure the parents as well.
A Language for Communicating Information About Children’s Growth
Several ways of expressing growth measurements are more meaningful and useful. One is to determine the child’s “height-age” or “weight-age” (i.e., the age for which a particular measurement represents the 50th percentile on a standard growth chart) (Fig. 3-7). Figure 3-7 shows that the boy in question, whose chronologic age is 10 years 4 months, has a height-age of 7 years and a weight-age of 5 years 2 months. Stating each measurement in these terms immediately communicates the image of a child who is a little shorter than average but is also underweight or undernourished, even in relation to his reduced height.
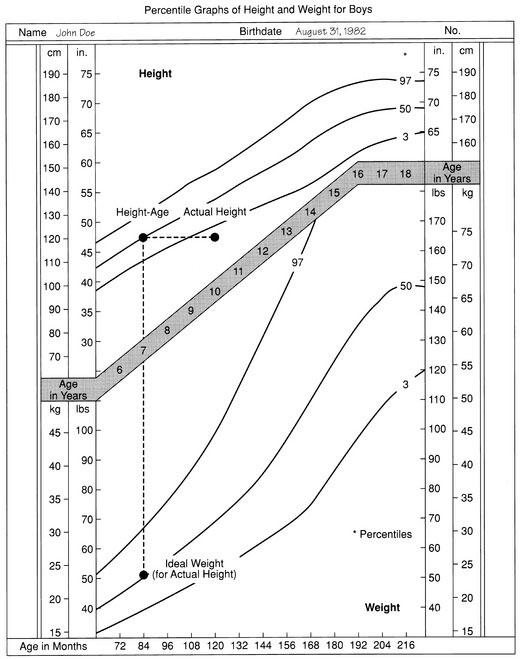
Weight As a Percentage of Ideal
A useful way to express the ponderal aspect of a child’s nutritional status is weight as a percentage of ideal. Ideal, in this case, means the ideal (average) weight for the child’s actual recumbent length or standing height. This value is simple to determine, as illustrated in Figure 3-7. The boy’s height is 120 cm. Extrapolating horizontally to the 50th percentile shows that he has a height-age of 7 years. If you drop a perpendicular line to the weight graph from his height-age until it meets the 50th percentile weight line, you see that the ideal weight for his actual height is approximately 23.5 kg.
You can express his actual weight as a percent of ideal as shown in the following equation:

Table 3-1 shows the classification of protein-energy malnutrition according to McLaren and Read’s arbitrary system. This system of expression conveys an immediate and vivid image of the severity of a child’s undernutrition, irrespective of the underlying cause.
| Classification | Weight as Percentage of Ideal (for Actual Height) |
|---|---|
| Normal | 90–110 |
| Mild protein-calorie malnutrition | 85–90 |
| Moderate protein-calorie malnutrition | 75–85 |
| Severe protein-calorie malnutrition | <75 |
From McLaren DS, Read WC: Classification of nutritional status in early childhood, Lancet 2:146, 1972.
Children With Delayed Growth
There are many causes of growth delay; those due to growth hormone or thyroxine deficiency are discussed in Chapter 16.
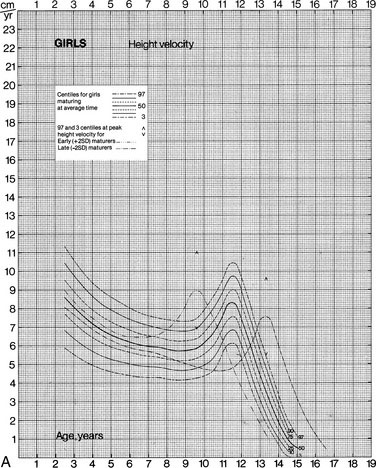
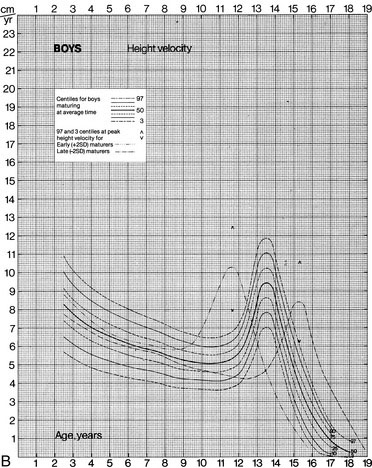
Growth (Height) Velocity
For children who have significant disturbances of growth, for those receiving treatments that may impair growth, and for those being treated for growth disturbances, measurement of growth velocity can provide far more meaningful information than static measurements of height and weight. Tanner and Davies have pointed out that once puberty has begun, the use of cross-section population curves to plot the growth of children is misleading because, for example, the course of the 50th percentile line is not always followed by individual children. If a child happens to be an early or late maturer, the deviation is particularly marked. The growth velocity charts devised by Tanner and Davies include standard curves for early and late maturers (Fig. 3-8). When you use this system to record height velocity, remember that the height increments on which the charts are based are whole-year increments.
Staging Pubertal Development
Tanner and Davies divided the process of breast and pubic hair development into stages, as outlined in Figure 3-9. Their system of staging these elements of pubertal development is now used worldwide. In most girls, breast budding is the earliest physical manifestation of puberty, although in some perfectly normal girls, adrenarche (pubic and axillary hair development) may precede thelarche (breast development). The idea that girls enter puberty much earlier than boys has been somewhat overstated, simply because the physical manifestations of the onset of puberty are more obvious in girls. On average, girls show their earliest secondary sexual changes only about 6 months ahead of the earliest manifestations in boys. The first pubertal change in most girls takes the form of breast budding. In boys, however, the typical earliest evidence of secondary sexual development is testicular enlargement. Thus, unless you make it a regular practice to use an orchidometer or other means to measure the size of testes, you can easily miss a 1- or 2-mL increase in testicular volume between visits, whereas you would rarely miss a newly evident breast nodule.

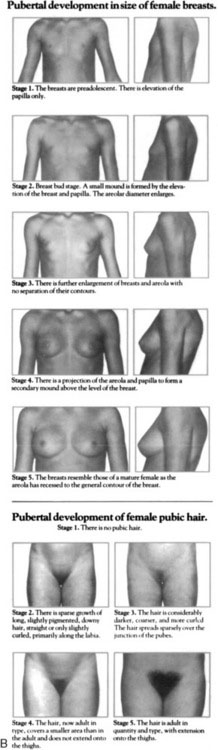
FIGURE 3-9 Tanner stages of breast and pubic hair development in boys (A) and girls (B).
(From Johnson TR, Moore WM, Jeffries JE: Children Are different: physiology, 2nd ed. Columbus, Ohio, Ross Laboratories, 1978.)
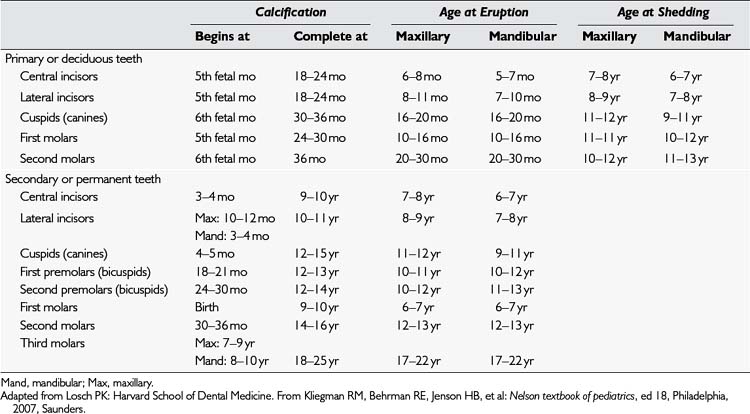
Dental Development
Children vary considerably in the ages at which their teeth erupt, depending partly on genetic factors. Table 3-2 summarizes the average ages for calcification and eruption of primary and secondary dentition and, for primary dentition, the usual ages of tooth shedding.
Clinical Assessment of the Child With Possible Iron Deficiency
Evaluating the Obese Child
Special features of the obese child’s history
I usually avoid questioning the child about food intake at the first interview for three reasons:
Physical examination of the obese child
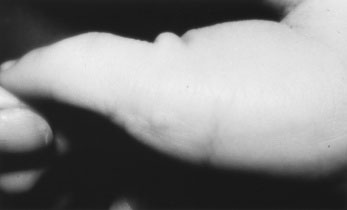
A useful way to begin is by examining the child’s hands and feet. In obese children, always check the area of skin over the base of the fifth finger and fifth toe. The presence of a small stellate scar is a telltale sign that a skin tag was removed soon after birth with a suture tied tightly around it (Fig. 3-10). In fact, such a skin tag was almost certainly a rudimentary supernumerary digit. This finding, coupled with obesity, raises the likelihood that the child has Laurence-Moon-Biedl syndrome, in which obesity is often associated with polydactyly, retinitis pigmentosa, progressive loss of vision, some developmental delay, and, often, a progressive nephropathy.
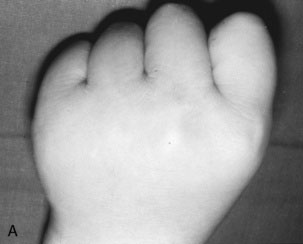
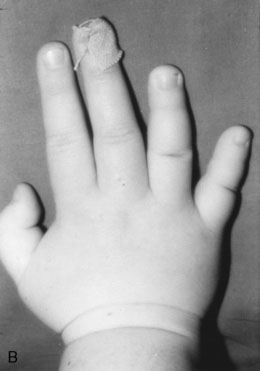
Another uncommon but important sign to look for in the hands of obese children is the metacarpal sign. Children with pseudohypoparathyroidism (a syndrome associated with obesity) often have strikingly short fourth and fifth metacarpals and metatarsals. Elicit the metacarpal sign by having the youngster make a fist. When the fourth and fifth metacarpals are hypoplastic, the relevant knuckles are absent and are often replaced by dimples (Fig. 3-11). Incidentally, this sign also is seen in girls with Turner syndrome (XO anomaly).
Stretch marks often are observed in the skin of the abdomen and thighs of obese children. (See Chapter 16 for the distinction between Cushing syndrome and obesity of other causes.)
Evaluating the Child With Failure to Thrive
When there are no clear-cut signs suggesting organic disease, a complete psychosocial history and direct observation of the child and family (as described in Chapter 1) usually allow a diagnosis of deprivational growth failure and malnutrition to be made on distinct positive grounds rather than by exclusion.
Energy intake and requirements
Average daily energy intakes at different ages are listed in Table 3-3. Whether a child’s growth and nutritional deficits are rooted in organic or psychosocial disease, the final common pathway leading to failure to thrive is usually that insufficient kilocalories are being consumed. As Keys and colleagues showed in their classic studies of experimental human starvation, the problem is complicated by the fact that one of the prime clinical manifestations of prolonged undernutrition is anorexia. The combination of anorexia and a greatly increased energy requirement for recovery makes for a major challenge, which explains why hyperalimentation methods (enteral or parenteral) are so often required at the outset to induce nutritional and growth recovery in these children.
| Age | Sex | Units (kcal/kg/day) |
|---|---|---|
| 0–2 mo | Both sexes | 100–120 |
| 3–5 mo | Both sexes | 95–100 |
| 6–8 mo | Both sexes | 95–97 |
| 9–11 mo | Both sexes | 97–99 |
| 1 yr | Both sexes | 101 |
| 2–3 yr | Both sexes | 94 |
| 4–6 yr | Both sexes | 100 |
| 7–9 yr | Male | 88 |
| Female | 76 | |
| 10–12 yr | Male | 73 |
| Female | 61 | |
| 13–15 yr | Male | 57 |
| Female | 46 | |
| 16–18 yr | Male | 51 |
| Female | 40 |
Modified from Canada Bureau of Nutritional Sciences: Recommended nutrient intakes for Canadians, Ottawa, Health and Welfare Canada, 1983, Canadian Government Publication Centre.
* The 2000 Centers for Disease Control and Prevention (CDC) Growth Charts are available on the Internet (http://www.cdc.gov/growthcharts) and on the CDC’s Epi Info software (http://www.cdc.gov/epiinfo/), in which both exact percentiles and z scores can be calculated.
[/level-membership-for-pediatrics-category][not-level-membership-for-pediatrics-category]
chapter 3 Assessing Physical Growth and Nutrition
Measurements and Growth Charts
Recumbent length versus height
Because most babies younger than 10 to 12 months cannot stand alone and most toddlers refuse to stand still, any child younger than 2 years should be measured for length in the recumbent position. In children of this age group, recumbent length and standing height are not the same, the former being significantly greater. Standard growth charts for younger children are based on measurements of recumbent length. Various accurate measuring devices—some cheap, others more expensive—are available for determining recumbent length and height. The essential point is to use a stable, accurate, fixed device if both individual and serial measurements are to mean anything (Figs. 3-1 and 3-2). Accuracy is a must, but never more so than when there is the slightest concern about the child’s growth. To be absolutely sure, check all measurements at least twice, and never accept anyone else’s measurements as reliable.
Head circumference
The technique for measuring head circumference is described in Chapter 7. Be sure to check the measurement at least once to be certain it is accurate.
Large and Small Heads
Remember that skull bones grow in a direction perpendicular to the suture lines. The directions in which the skull can and cannot grow after synostosis of a suture are therefore predictable, as is the shape of the resulting cranial distortion. For example, if the sagittal suture fuses prematurely, further lateral growth of the skull is prevented. Anteroposterior growth continues (perpendicular to the coronal sutures), and the skull will become long and narrow (a condition known as dolichocephaly) (Fig. 3-3).
Graphic recording of measurements
The child’s recumbent length or standing height, body weight, and head circumference should be recorded and plotted on appropriate age- and sex-specific growth charts. In North America, the growth charts currently used almost universally are those published in 2000 by the National Center for Health Statistics in collaboration with the National Center for Chronic Disease Prevention and Health Promotion (Fig. 3-4). These charts permit plotting of length-for-age, weight-for-age, and head circumference–for-age measurements along percentile lines, as well as plotting of body mass index (BMI) on a percentile chart.*
FIGURE 3-4 Growth charts for children from birth to 20 years.
(Developed by the National Center for Health Statistics in collaboration with the National Center for Chronic Disease Prevention and Health Promotion, 2000; available at http://www.cdc.gov/growthcharts.)
BMI is determined using the following formula:
Mid-parental height
Special growth charts have been developed for children with certain dysmorphic conditions, including Down syndrome, Turner syndrome, and achondroplasia (see Recommended Reading).
Arm span and its relationships
If a child is old enough to cooperate, you can measure the arm span by having the youngster stand with the back and heels touching the wall and the arms fully extended parallel to the floor, with the palms facing forward. With parental assistance and using a steel tape measure, measure the distance between the third fingers of each hand. The span-height difference and span-to-height ratio then can be determined (Fig. 3-5).
Measuring the upper and lower segments
Measuring a child’s upper and lower segments is tricky and is not always supremely accurate. Obtaining these measurements requires identifying the top of the pubic ramus and marking it on the skin with a pen or wax pencil. This procedure sounds easier than it is, especially in a chubby youngster, in whom you must indent the adipose lower abdominal-suprapubic area to locate the top of the pubic bone. After you make the mark and release the pressure, the abdominal wall springs back and the mark does not always stay where you thought it was relative to the pubis. Make sure the youngster does not bend forward to look, because this movement can distort the measurement. Measure the lower segment by dropping a steel tape perpendicularly from the mark to the floor (Fig. 3-6, A). Then determine the length of the upper segment by subtracting the lower segment length from the height. Part B of Figure 3-6 shows the average upper-to-lower segment ratio at different ages. Remember that there are ethnic and familial differences in these ratios, so it is sometimes necessary to measure the parents as well.
