1. Sonomura, T, et al. N-butyl cyanoacrylate embolization with blood flow control of an arterioportal shunt that developed after radiofrequency ablation of hepatocellular carcinoma. Korean J Radiol. 2014; 15(2):250–253.
2. Kim, TK, et al. Hepatocellular nodules in liver cirrhosis: contrast-enhanced ultrasound. Abdom Imaging. 2011; 36(3):244–263.
3. Nakamura, Y, et al. Clinical significance of the transitional phase at gadoxetate disodium-enhanced hepatic MRI for the diagnosis of hepatocellular carcinoma: preliminary results. J Comput Assist Tomogr. 2011; 35(6):723–727.
4. Vogl, TJ, et al. Portal vein thrombosis and arterioportal shunts: effects on tumor response after chemoembolization of hepatocellular carcinoma. World J Gastroenterol. 2011; 17(10):1267–1275.
5. Ahn, JH, et al. Nontumorous arterioportal shunts in the liver: CT and MRI findings considering mechanisms and fate. Eur Radiol. 2010; 20(2):385–394.
6. Mita, K, et al. Diagnostic sensitivity of imaging modalities for hepatocellular carcinoma smaller than 2 cm. World J Gastroenterol. 2010; 16(33):4187–4192.
7. Yoo, HJ, et al. Hepatocellular carcinoma in cirrhotic liver: double-contrast-enhanced, high-resolution 3.0T-MR imaging with pathologic correlation. Invest Radiol. 2008; 43(7):538–546.
8. Goto, T, et al. Osler-Weber-Rendu disease with esophageal varices and hepatic nodular change. Intern Med. 2007; 46(12):849–854.
9. Kitade, M, et al. Intrahepatic cholangiocarcinoma associated with central calcification and arterio-portal shunt. Intern Med. 2005; 44(8):825–828.
10. Sakata, H, et al. Prognostic factors for hepatocellular carcinoma presenting with macroscopic portal vein tumor thrombus. Hepatogastroenterology. 2004; 51(60):1575–1580.
11. Yoshimitsu, K, et al. Pitfalls in the imaging diagnosis of hepatocellular nodules in the cirrhotic and noncirrhotic liver. Intervirology. 2004; 47(3–5):238–251.
12. Yoshimitsu, K, et al, Unusual hemodynamics and pseudolesions of the noncirrhotic liver at CT. Radiographics. 2001;(21 Spec No):S81–S96.
13. Koizumi, J, et al. Computed tomography during arterial portography under temporary balloon occlusion of the hepatic artery: evaluation of pseudolesions caused by arterio-portal venous shunts. Abdom Imaging. 2000; 25(6):583–586.


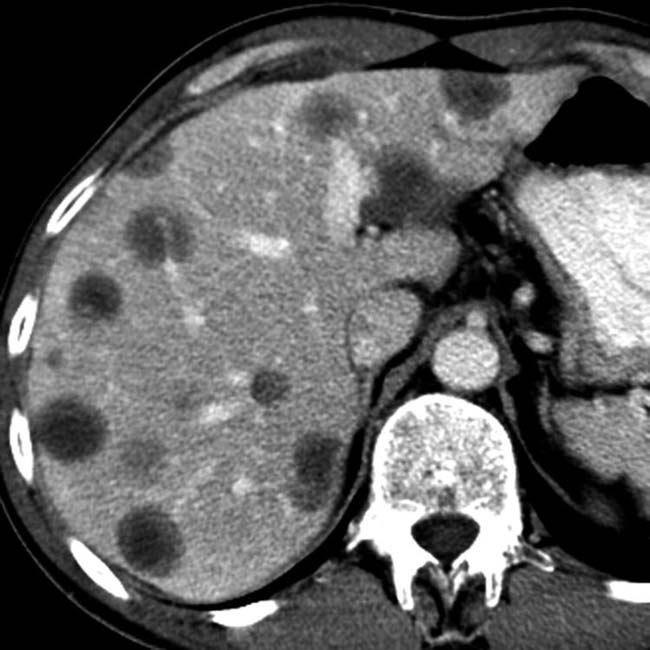
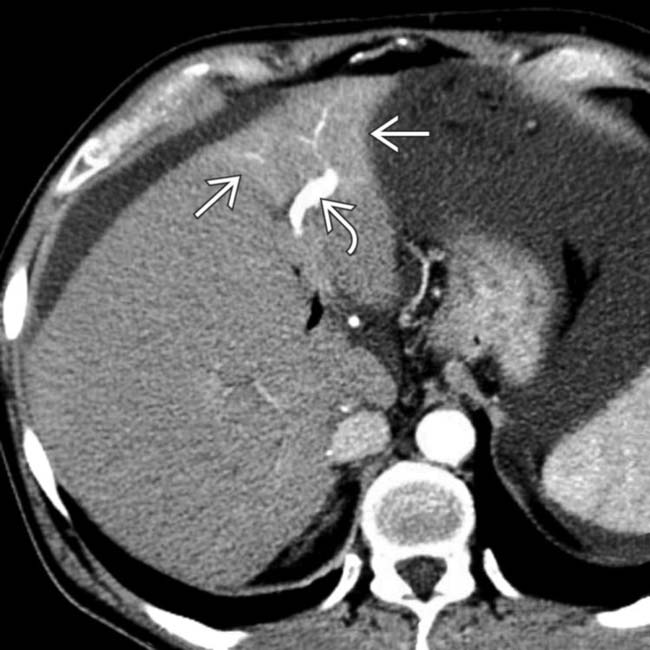
 in this 60-year-old man with cirrhosis due to chronic viral hepatitis.
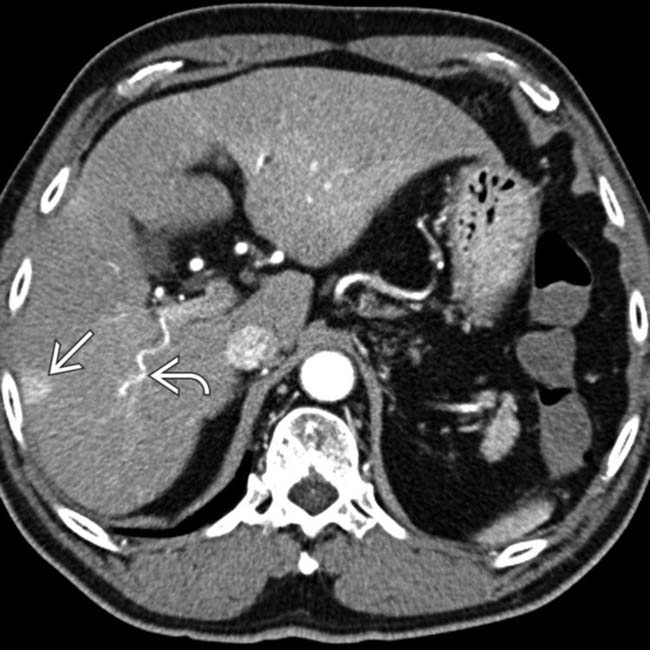
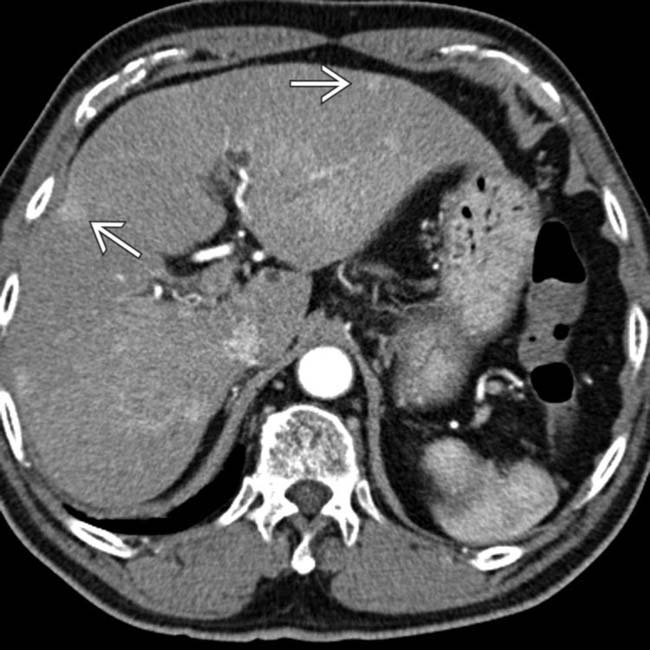
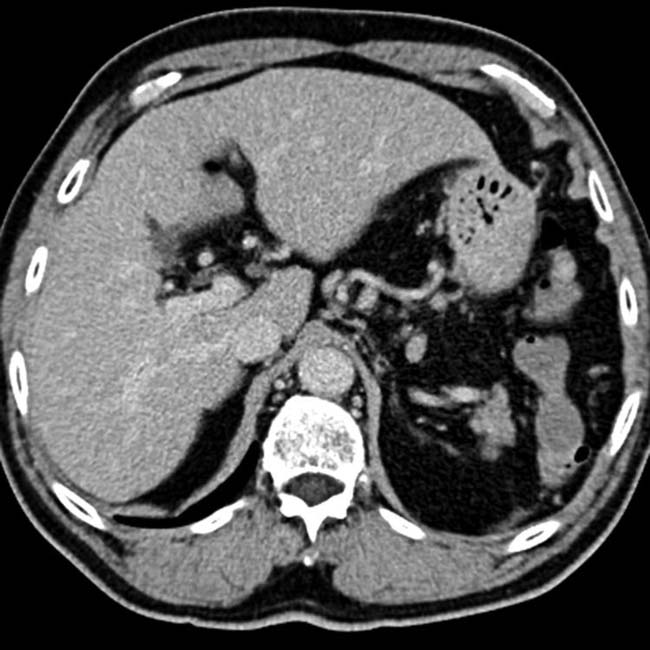
 . Also note the large, “corkscrew” hepatic arterial branch
  , a typical feature of cirrhosis. The liver has a cirrhotic morphology with wide fissures.
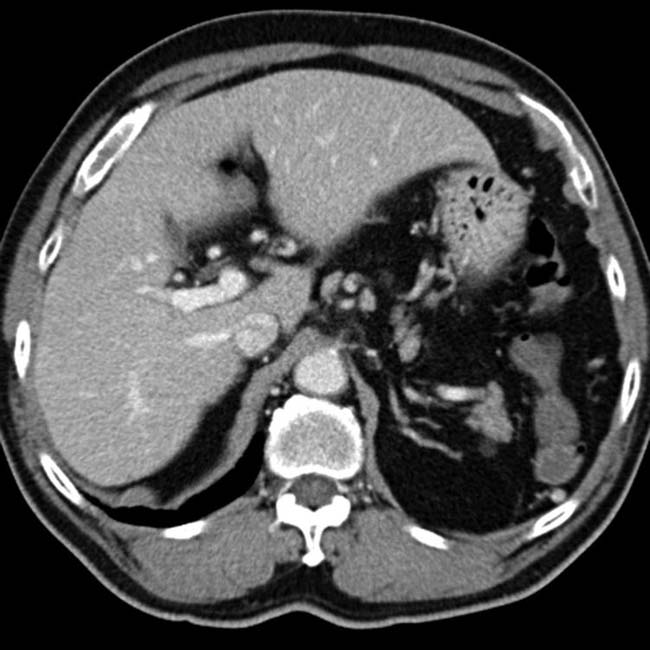


 .
.
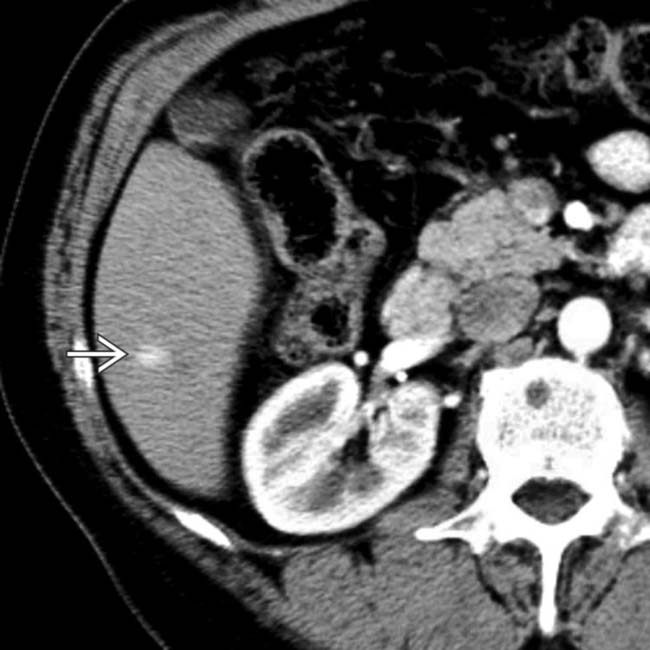
 and early enhancement of the portal vein branch that drains this segment
  , representing an arterioportal shunt, probably due to the prior liver biopsy at this site.
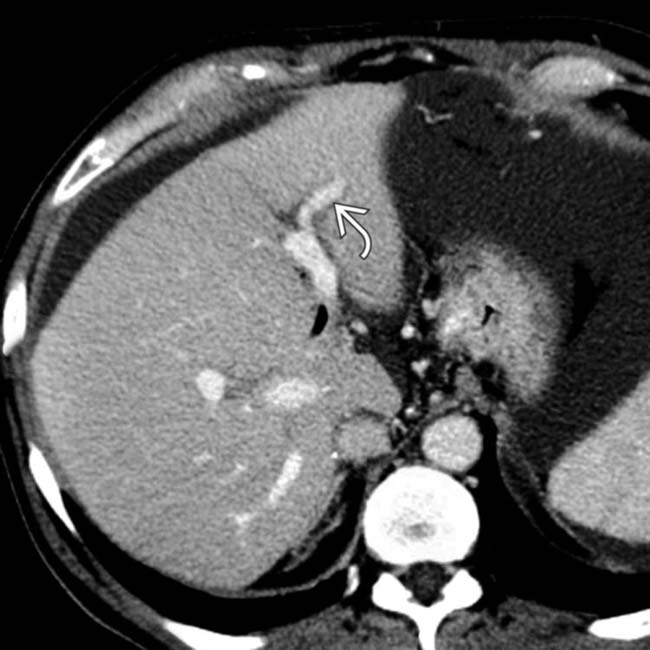
 but otherwise appears normal.
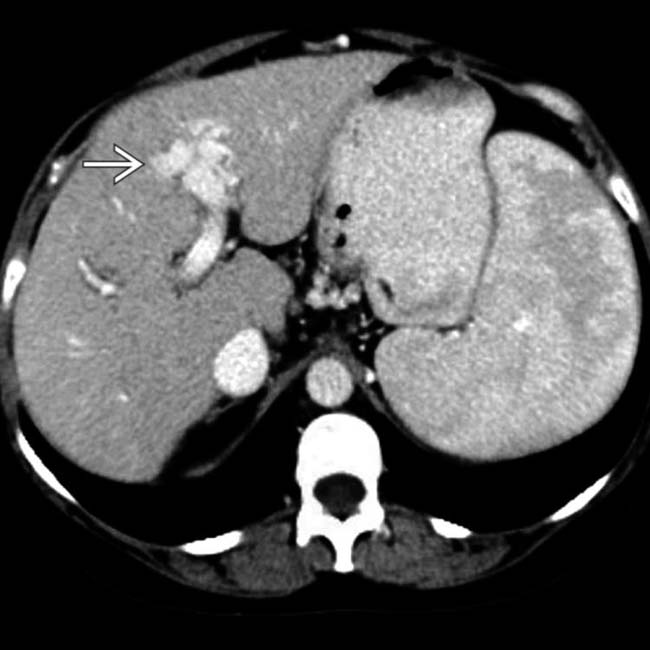
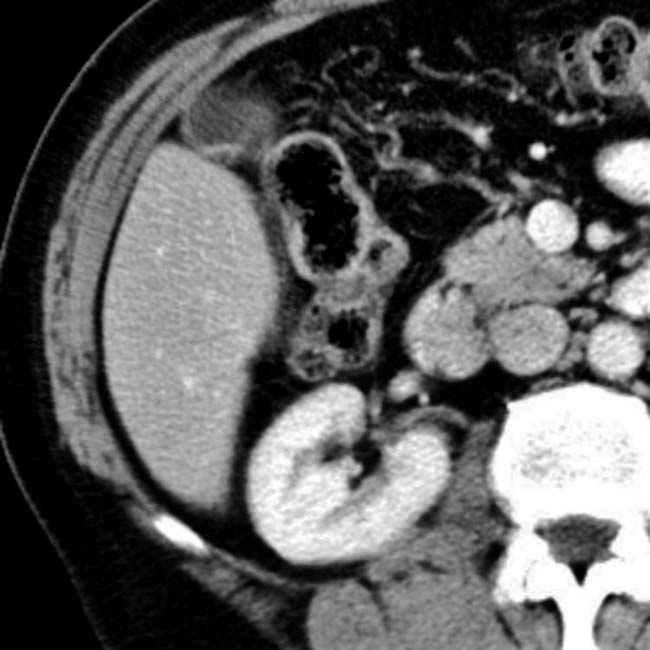
 in the left lobe, most likely the result of a prior liver biopsy at this site.
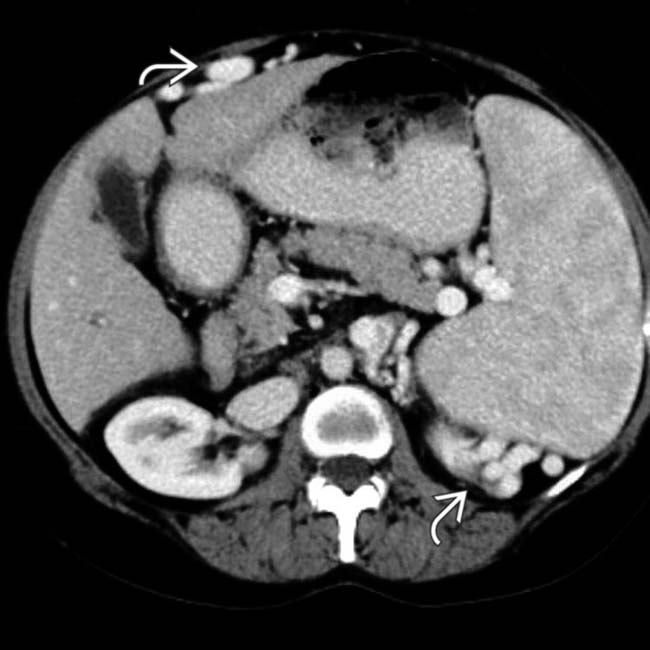
 .
.