CHAPTER 6 Advanced imaging
6.1 Confocal endomicroscopy
Key Points
Introduction
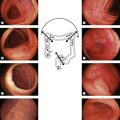
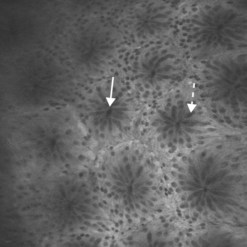
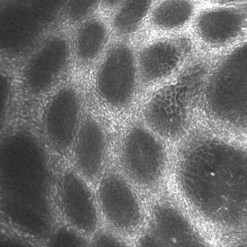
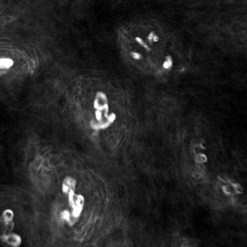
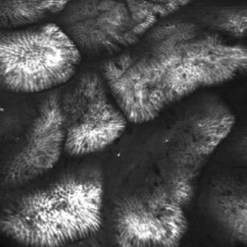
Confocal laser endomicroscopy (CLE) is one of the newer advanced imaging methods for the gastrointestinal tract. Microscopic images of the gastrointestinal mucosa are obtained by illuminating the mucosa with blue laser light (488 nm), which causes fluorescence. The light reflected is collected through a pinhole-sized aperture and processed, creating a microscopic image. The laser light and collected light are ‘confocal’, meaning they are in the same focal plane. The images produced allow visualization of small structures, such as capillaries and colonic crypts and gastric pits (Figs 1–4), as well as individual cells, such as epithelial cells and red blood cells.
2 Equipment
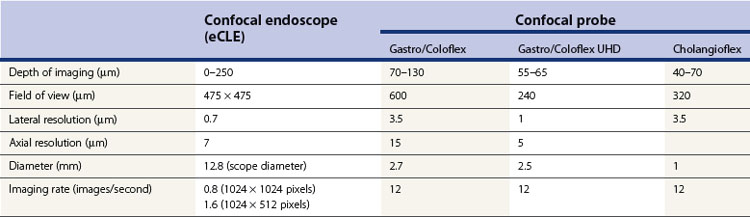
There are currently two endomicroscopy systems available (Table 1). One is an endoscope-based endomicroscopy (eCLE) system, the EC-3870CIFK colonoscope, and EG-3870CIK upper endoscope (Pentax, Tokyo, Japan). A probe-based endomicroscopy (pCLE) system, the Cellvizio (Mauna Kea Technologies, Paris, France) is also available. Both systems allow standard endoscopic imaging while providing the ability to obtain microscopic views of the mucosa, but there are several differences between the two systems. Each system has an endomicroscopic image processor and separate screen for viewing endomicroscopic images. The confocal endoscope comes in lengths appropriate for colonoscopy and one for upper endoscopy, although the colonoscope-length endoscope can also be used for investigation of the upper GI tract. The confocal endoscope has the standard wheels, air, water, suction and photo buttons, and a standard-size biopsy channel. The miniprobes for pCLE can be used with a standard endoscope that has a 2.8 mm channel and the probes are attached to a special processor. They come in lengths appropriate for upper endoscopy, colonoscopy, and cholangioscopy. Both systems require a contrast agent to be used to collect images. The confocal endoscope can image sequentially from the surface, down to a depth of 250 µm, while the confocal probes have set ranges of imaging depth, ranging from 55–65 µm from the surface for the Gastroflex UHD probe to 70–130 µm for the Gastroflex probe. The resolution of the images is higher with the confocal endoscope than the probes, with a lateral resolution of 0.7 µm compared with 1–3.5 µm. The imaging rate for the confocal probe is higher than the confocal endoscope, with an imaging rate of 12 images per second compared with 0.8–1.6 images per second. The pCLE system also creates a ‘mosaic’ of images collected together to show a larger portion of the mucosa. Both systems allow image capture and export.
4 Technique
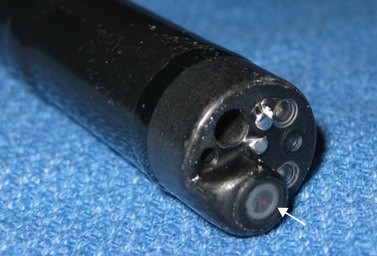
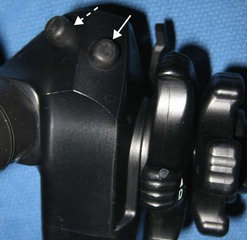
When ready to obtain eCLE images, place the tip of the confocal endoscope directly on the mucosa. The imaging window is located on the lower left portion of the tip and can be seen on the edge of the endoscopic image (Fig. 5). Applying suction using the endoscope can help stabilize your position. Once a stable position is obtained, press the home button (button 3), which will return the imaging to the surface (Fig. 6). Press button 4 to begin sectioning down through the mucosa. Depressing the button moves the imaging plane 4 µm deeper. The direction of imaging can be reversed towards the surface by quickly depressing button 4 twice. Microscopic images can be captured using the foot pedal, the mouse, or the touch screen.
6 Special considerations
6.3 Further research
Bojarski C, Gunther U, Rieger K, et al. In vivo diagnosis of acute intestinal graft-versus-host disease by confocal endomicroscopy. Endoscopy. 2009;41:433-438.
Dunbar KB, Okolo P3rd, Montgomery E, et al. Confocal laser endomicroscopy in Barrett’s esophagus and endoscopically inapparent Barrett’s neoplasia: a prospective, randomized, double-blind, controlled, crossover trial. Gastrointest Endosc. 2009;70:645-654.
Kiesslich R, Burg J, Vieth M, et al. Confocal laser endoscopy for diagnosing intraepithelial neoplasias and colorectal cancer in vivo. Gastroenterology. 2004;127:706-713.
Kiesslich R, Goetz M, Burg J, et al. Diagnosing Helicobacter pylori in vivo by confocal laser endoscopy. Gastroenterology. 2005;128:2119-2123.
Kiesslich R, Goetz M, Lammersdorf K, et al. Chromoscopy-guided endomicroscopy increases the diagnostic yield of intraepithelial neoplasia in ulcerative colitis. Gastroenterology. 2007;132:874-882.
Kiesslich R, Hoffman A, Goetz M, et al. In vivo diagnosis of collagenous colitis by confocal endomicroscopy. Gut. 2006;55:591-592.
Kitabatake S, Niwa Y, Miyahara R, et al. Confocal endomicroscopy for the diagnosis of gastric cancer in vivo. Endoscopy. 2006;38:1110-1114.
Leong RW, Nguyen NQ, Meredith CG, et al. In vivo confocal endomicroscopy in the diagnosis and evaluation of celiac disease. Gastroenterology. 2008;135:1870-1876.
Lipson BK, Yannuzzi LA. Complications of intravenous fluorescein injections. Int Ophthalmol Clin. 1989;29:200-205.
Pech O, Rabenstein T, Manner H, et al. Confocal laser endomicroscopy for in vivo diagnosis of early squamous cell carcinoma in the esophagus. Clin Gastroenterol Hepatol. 2008;6:89-94.
Trovato C, Sonzogni A, Fiori G, et al. Confocal laser endomicroscopy for the detection of mucosal changes in ileal pouch after restorative proctocolectomy. Dig Liver Dis. 2009;41:578-585.
Wallace MB, Meining A, Canto MI, et al. The safety of intravenous fluorescein for confocal laser endomicroscopy in the gastrointestinal tract. Aliment Pharmacol Ther. 2010;31:548-552.
6.2 New endoscopic imaging modalities
Key Points
Introduction
To achieve the first of these objectives, NBI and AFI techniques are undergoing clinical validation, while for the second, methods involving CLE, endocytoscopy, OCT or elastic or non-elastic light-scattering spectroscopy (LSS) are being developed. NBI, AFI and CLE methods are currently available commercially, while OCT and other methods are only at the prototype stage of development. The use of these technologies is set to expand, but there are currently few controlled, randomized comparative studies to determine precisely the utility of these new tools in endoscopy. The range of potential applications is wide, but for the moment the main focus is on areas as outlined in Box 1.
1 Technical principles
1.1 Principle of narrow band imaging (FICE or NBI system)
The penetration of the mucosa and submucosa by light depends on its wavelength and increases as the wavelength approaches infrared. Target tissues can be illuminated by specific wavelengths or a spectral band corresponding to the absorption spectrum of specific structures in the illuminated tissue. Preference may be given to wavelengths with known absorption by certain tissue components. NBI endoscopy conventionally uses three wavelengths at around 430, 460, and 575 nm; the shorter (blue) wavelengths provide better visualization of vascular structures, particularly in the mucosa and, to a lesser degree, the submucosa (Fig. 1). There are several ways of preferentially using these wavelengths and their narrow spectral band (usually 30 or 50 nm), which can be limited to three bands or, by contrast, a range of 9–12 narrow spectral bands can be offered; a combination of these predetermined (by the manufacturer) or chosen (by the gastroenterologist) provides a wider palette of virtual color and enhancement of the vascular structures and mucosal crypt orifices. Of the methods currently available, the one developed by Fujinon offers a choice of nine narrow bands (FICE system); the method developed by Olympus uses three fixed narrow bands (NBI system); and the iSCAN system from Pentax similarly has nine ‘tone enhancement’ modes. These are obtained using a mechanical light filter (NBI) or an electronic selection technique based on spectral analysis of the pixels forming the image in each spectral band, which are then reallocated (selected or deleted) to reconstitute an image corresponding to the narrow band selected (FICE). These selections are made for each of the narrow bands and are then fused to produce a single image. One of the current advantages of FICE technology is that it can be used with a standard endoscope or a high resolution videoendoscope with zoom (>400 000 or up to 800 000–1 million pixels), whereas the advantage of the NBI system is that the narrow band imaging endoscopy can be connected to high definition television (HDTV), which doubles the number of horizontal lines of pixels, producing better horizontal resolution. The drawback of the FICE technique is that it needs a light source and a 4400 series processor, whereas the drawback of the NBI system is that it uses the Exera II system, i.e. a dedicated light source, processor, and specific videoendoscopes. Magnifying videoendoscopes are required in both cases, since fine structures can be enhanced for analysis of fourth-order vessels in the mucosa or the crypt orifice pattern (Figs 2, 3). There is no universally agreed classification system specifically for mucosal lesions using narrow band imaging but most have used magnifying videoendoscopes to examine the superficial vessel networks and crypt openings in the lower esophagus or colon (Table 1).
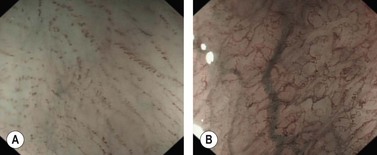
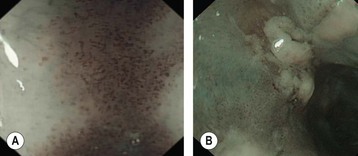
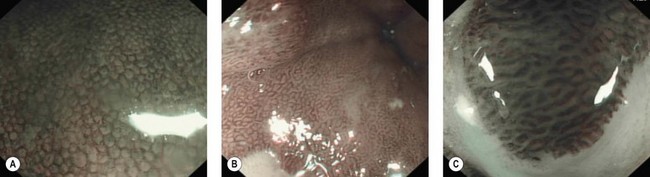
Table 1 Classification used in narrow band imaging endoscopy or electronic, optical chromoendoscopy (without staining)
| Narrow band imaging endoscopy of the esophagus |
| Squamous cancer of the esophagus |
| According to Kumagai et al 2002: |
| IPCL: intrapapillary capillary loops, from fourth-order branching vessels (×80) in the lamina propria of comparable homogeneous appearance. |
| Spread of squamous cancers of the esophagus. |
Note: there is no universally agreed or validated classification specifically for narrow band imaging using FICE or NBI. Most of the classifications described are based on using magnifying videoendoscopes.
 Clinical Tip
1.2 Principle of confocal laser endomicroscopy and endocytoscopy
Confocal laser endomicroscopy is discussed in Chapter 6.1. Endocytoscopy is a contact microscopy technique. After dye spraying with methylene blue, a probe is passed through the operating channel of a standard videoendoscope, with approximately ×1100 magnification and this allows cytological analysis and visualization of the density of cell nuclei.
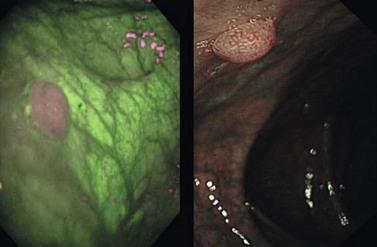
1.4 Principle of autofluorescence imaging
Autofluorescence is based on the stimulation of endogenous fluorophores (e.g. NADPH, flavones and collagen) with a short wavelength or ultraviolet light beam that is reflected by fluorophores with a longer wavelength. Some biological processes and changes in tissue composition are associated with specific autofluorescence, with mucosal and submucosal collagen showing green autofluorescence, while dysplastic or neoplastic changes show red or purple autofluorescence (Fig. 4). Early studies with autofluorescence used an excitation probe through the operating channel of a fiberoptic endoscope, using a spectral filter, to emit and receive the fluorescent beams. This approach has been replaced more recently by endoscopic detection of the autofluorescence, using a CCD detector with a simultaneous increase in image resolution and, above all, detection of fluorescence emitted in proximity to its reflection. In this way a good signal : noise ratio can be obtained and signal intensity loss due to photon transmission by the optical fibers can be prevented. In videoendoscopy, by using a single CCD, the conventional image can first be visualized in white light, then detected in autofluorescence, whereas the use of an optical fiber probe requires a filter upstream of the fibers as well as two separate CCDs to capture a conventional image and an autofluorescence image. The only advantage of using optical fibers and spectral filters is that a choice can be made from a larger sample of filters. This is currently more of a theoretical than clinical advantage.
 Clinical Tip
2 Clinical applications of new imaging techniques
2.1 Clinical studies (FICE or NBI system)
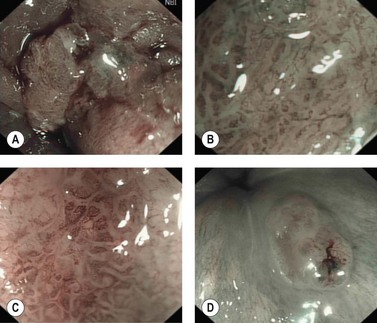
Most clinical studies relate to Barrett’s esophagus or characterization of colonic polyps. Narrow band imaging in the esophagus examines the vascular network of the lower esophagus and the appearance of mucosal crypts based on descriptions of glands seen during studies of chromoendoscopy. This method was better able to visualize the gastroesophageal junction than standard endoscopy (58% and 17% good quality images, respectively) and was more powerful for detecting areas of intestinal metaplasia with sensitivities of 56% and 24%, and specificities of 95% and 67%, respectively. Numerous other studies have shown that, in Barrett’s esophagus, NBI endoscopy can define intestinal metaplasia and detect low- or high-grade dysplasia or early cancer (Fig. 5) with comparable accuracy to chromoendoscopy. For squamous esophageal neoplasia, NBI can detect high-grade dysplasia (Fig. 2) and differentiate mucosal from submucosal involvement as accurately as high resolution magnifying endoscopy. These studies suggest that narrow band imaging endoscopy is an alternative to systematic four-quadrant biopsy protocols for Barrett’s surveillance; targeted biopsies of abnormal areas may increase the yield of dysplasia with fewer biopsies.
In the colon, narrow band imaging endoscopy analyses the crypt pattern (Figs 6–8) in a manner similar to chromoendoscopy but also allows definition of vascular network changes (Fig. 9). It has been compared with conventional colonoscopy with chromoendoscopy using 0.2% indigo carmine in 34 patients with 43 polyps to distinguish hyperplastic polyps from adenomas. These two methods had equivalent sensitivity and specificity (100% and 75%, respectively) for diagnosing colonic neoplasia. Both techniques were superior to conventional endoscopy alone, with sensitivity and specificity of 83% and 44%, compared with histological examination. In two further studies, including 43 and 30 patients with 32 and 30 polyps, narrow band imaging endoscopy had a sensitivity and a positive predictive value (PPV) of 94% and 83%, respectively, for the diagnosis of adenoma, whereas the PPV and NPV were 74% and 81% in a study of 31 patients, eight of whom had 18 adenomas.
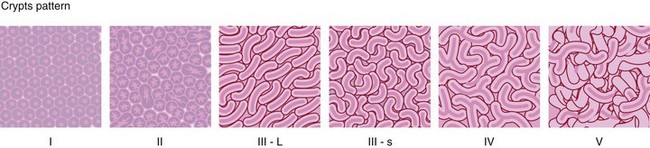
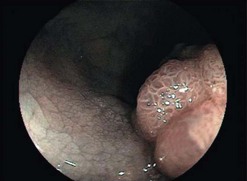
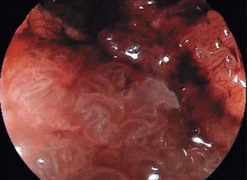
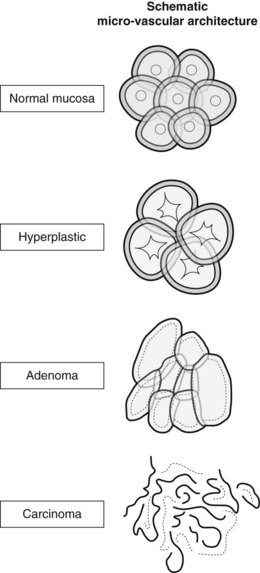
Figure 9 Microvascular network of colonic mucosa and polyps at narrow band imaging (NBI).
(Modified from Sano Y, Horimatsu T, Fu KI, Katagiri A, Muto M, Ishikawa H. Magnifying observation of microvascular architecture of colorectal lesions using a narrow-band imaging system. Digestive Endoscopy 2006; 18 (Suppl. 1): S44-S51.)
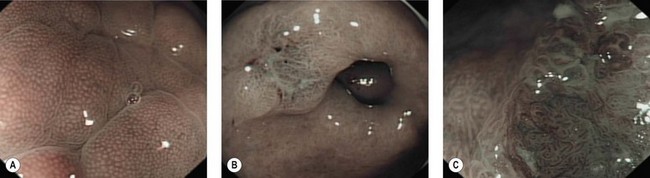
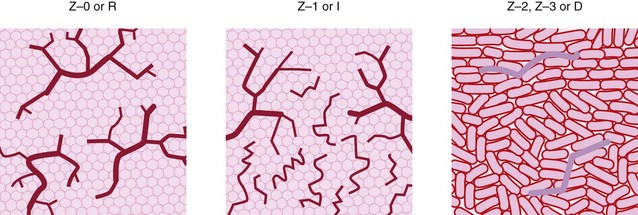
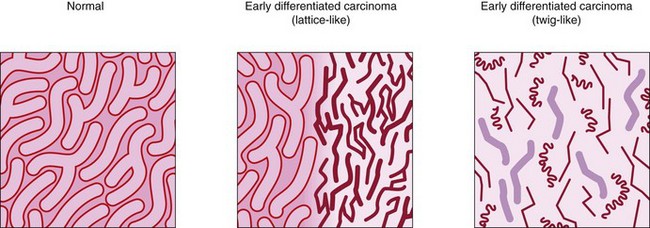
In the stomach, NBI can recognize normal crypts (Fig. 10A), vascular changes in gastritis (Fig. 11) but also well- or poorly-differentiated gastric carcinomas (Figs 12, 10B). Few studies have been published but NBI is used mainly by experts in assessment of lesions prior to endoscopic mucosal resection or submucosal dissection of early gastric cancers.
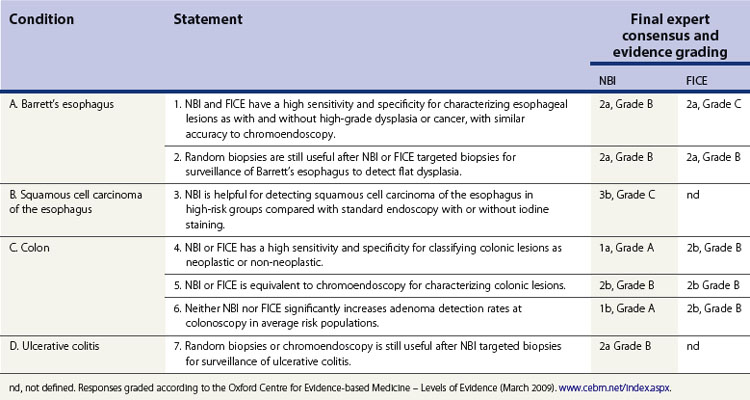
These studies show that for the diagnosis of high-grade dysplasia or early cancer in Barrett’s esophagus, NBI is more than simply a clinical practice aid and could be an alternative to the Seattle protocol of systematic four-quadrant biopsies every 1–2 cm. For the detection of dysplasia in UC, emerging data could also support this method as an alternative to multiple random biopsies every 10 cm. For the characterization of polyps, particularly adenomas, NBI is equivalent to chromoendoscopy but, like the latter, its NPV is too low to replace pathological analysis. Recently, a group of international experts has reached a consensus on the relevance of NBI or FICE in daily endoscopic practice (Table 2).
2.2 Clinical application of endoscopy with autofluorescence
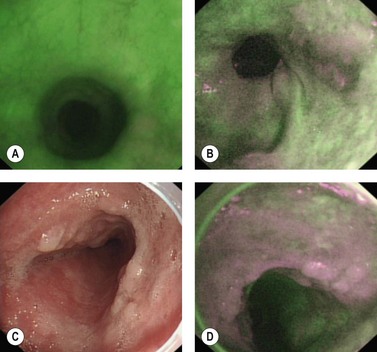
In the colon, first-generation LIFE-I system autofluorescence has been compared with standard fiberoptic colonoscopy in 20 patients, six of whom had chronic inflammatory bowel disease. A total of 22 of the 42 samples showed flat dysplasia or a polyp with a PPV for AFI and for standard endoscopy, 91% and 85%, respectively, and a NPV of 90% and 100%. The principle of AFI with image reconstitution has been developed more recently using a videoendoscope in the esophagus and colon (Fig. 13). The CCD detected the various fluorescences, while the filter was positioned at the tip of the videoendoscope (prototype developed by Olympus).
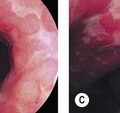
Compared with a standard videoendoscopy in the examination of 23 patients with high-grade dysplasia or early cancer and 18 patients after endoscopic treatment of these lesions, the PPV and NPV of videoendoscopy with AFI were 49% and 89%, respectively. If low-grade dysplasia lesions were included, the PPV increased to 59% and the NPV remained the same. The false positives responsible for a low PPV resulted from acute inflammation. A final study used a prototype Olympus videocolonoscope with AFI to characterize 168 colon polyps as hyperplastic or adenomatous. The sensitivity and specificity of AFI were 89% and 81%, with the adenomas appearing magenta against a green colonic mucosa (Fig. 13), whereas hyperplastic polyps appeared pink: 37 of the 168 polyps were examined using the LIFE-II system with a sensitivity and specificity for the diagnosis of adenoma of 87% and 71%. Color and contrast intensity were better with the videoendoscopy AFI system, compared with optical fibers, accounting for the difference in specificity of 10%.
2.3 Clinical application of confocal laser endoscopy (CLE) or endocytoscopy
See Chapter 6.1 for a discussion on the results of confocal laser endomicroscopy studies. This technique will probably have more of a future for CLE probes used through the operating channel of a videoendoscope, additionally equipped with a detection system such as autofluorescence or narrow band imaging endoscopy. Endocytoscopy, even although it uses a vital stain (methylene blue) instead of a fluorochrome injection, can be likened to confocal laser endoscopy. This technique has been tested in 87 patients with neoplasia (38 of the esophagus, 18 of the stomach, and 35 of the colon). Visualization of cell nucleus size and the nuclear-cytoplasmic ratio was of very good quality in 95% of cases. There are currently no clinical or comparative studies that define its positive and negative predictive value in comparison with chromoendoscopy or standard histology.
Adler A, Aschenbeck J, Yenerim T, et al. Narrow-band versus white-light high definition television endoscopic imaging for screening colonoscopy: a prospective randomised trial. Gastroenterology. 2009;136:410-416.
Curvers W, Baak L, Kiesslich R, et al. Chromoendoscopy and narrow-band imaging compared with high-resolution magnification endoscopy in Barrett’s esophagus. Gastroenterology. 2008;134:670-679.
Curvers WL, van den Broek FJ, Reitsma JB, et al. Systematic review of narrow-band imaging for the detection and differentiation of abnormalities in the esophagus and stomach. Gastrointest Endosc. 2009;69:307-317.
East JE, Suzuki N, Bassett P, et al. Narrow band imaging with magnification for the characterization of small and diminutive colonic polyps: pit pattern and vascular pattern intensity. Endoscopy. 2008;40:811-817.
East JE, Tan EK, Bergman JJ, et al. Meta-analysis: narrow band imaging for lesion characterization in the colon, esophagus, duodenal ampulla and lung. Aliment Pharmacol Ther. 2008;28:854-867.
Endo T, Nosho K, Arimura Y, et al. Study of the tumor vessels in depressed-type early gastric cancers using narrow band imaging magnifying endoscopy and cDNA array analysis. Digest Endosc. 2005;17:210-217.
Evans JA, Poneros JM, Bouma BE, et al. Optical coherence tomography to identify intramucosal carcinoma and high-grade dysplasia in Barrett’s esophagus. Clin Gastroenterol Hepatol. 2006;4:38-43.
Haringsma J, Tytgat GN, Yano H, et al. Autofluorescence endoscopy: feasibility of detection of GI neoplasms unapparent to white light endoscopy with an evolving technology. Gastrointest Endosc. 2001;53:642-650.
Inoue H, Cho JY, Satodate H, et al. Development of virtual histology and virtual biopsy using laser-scanning confocal microscopy. Scand J Gastroenterol. 2003;38:37-39.
Kara MA, Peters FP, Rosmolen WD, et al. High-resolution endoscopy plus chromoendoscopy or narrow-band imaging in Barrett’s esophagus: a prospective randomised crossover study. Endoscopy. 2005;37:929-936.
Kara MA, Peters FP, Ten Kate FJ, et al. Endoscopic video autofluorescence imaging may improve the detection of early neoplasia in patients with Barrett’s esophagus. Gastrointest Endosc. 2005;61:679-685.
Kara MA, Smits ME, Rosmolen WD, et al. A randomised crossover study comparing light-induced fluorescence endoscopy with standard videoendoscopy for the detection of early neoplasia in Barrett’s esophagus. Gastrointest Endosc. 2005;61:671-678.
Kiesslich R, Burg J, Vieth M, et al. Confocal laser endoscopy for diagnosing intraepithelial neoplasias and colorectal cancer in vivo. Gastroenterology. 2004;127:706-713.
Konerding MA, Fait E, Gaumann A. 3D microvascular architecture of pre-cancerous lesions and invasive carcinomas of the colon. Br J Cancer. 2001;84:1354-1362.
Kudo S, Hirota S, Nakajima T, et al. Colorectal tumors and pit-pattern. J Clin Pathol. 1994;47(10):880-885.
Kudo S, Rubio CA, Teixeira CR, et al. Pit pattern in colorectal neoplasia: endoscopic magnifying view. Endoscopy. 2001;33:367-373.
Kumagai Y, Inoue H, Nagai K, et al. Magnifying endoscopy, stereoscopic microscopy, and the microvascular architecture of superficial esophageal carcinoma. Endoscopy. 2002;45:369-375.
Machida H, Sano Y, Hamamoto Y, et al. Narrow-band imaging in the diagnosis of colorectal mucosal lesions: a pilot study. Endoscopy. 2004;36:1094-1098.
Nakayoshi T, Tajiri H, Matsuda K, et al. Magnifying endoscopy combined with narrow band imaging system for early gastric cancer: correlation of vascular pattern with histopathology. Endoscopy. 2004;36:1080-1084.
Poneros JM, Brand S, Bouma BE, et al. Diagnosis of specialized intestinal metaplasia by optical coherence tomography. Gastroenterology. 2001;120:7-12.
Sakaki N, Iida Y, Okazaki Y, et al. Magnifying endoscopic observation of the gastric mucosa, particularly in patients with atrophic gastritis. Endoscopy. 1978;10:269-274.
Sakashita M, Inoue H, Kashida H, et al. Virtual histology of colorectal lesions using laser-scanning confocal microscopy. Endoscopy. 2003;35:1033-1038.
Sano Y, Horimatsu T, Fu KI, et al. Magnifying observation of microvascular architecture of colorectal lesions using a narrow-band imaging system. Dig Endosc. 2006;18(Suppl. 1):S44-S51.
Sharma P, Weston AP, Topalovski M, et al. Magnification chromoendoscopy for the detection of intestinal metaplasia and dysplasia in Barrett’s esophagus. Gut. 2003;52:24-27.
Singh R, Anagnostopoulos GK, Yao K, et al. Narrow-band imaging with magnification in Barrett’s esophagus: validation of a simplified grading system of mucosal morphology patterns against histology. Endoscopy. 2008;40:457-463.
Sivak MVJr, Kobayashi K, Izatt JA, et al. Narrow-band imaging with magnification in Barrett’s esophagus: validation of a simplified grading system of mucosal morphology patterns against histology. Gastrointest Endosc. 2000;51:474-479.
Song LM, Adler DG, Conway JD, et al. Narrow band imaging and multiband imaging. ASGE Technology Committee. Gastrointest Endosc. 2008;67:581-589.
Tischendorf JJ, Wasmuth HE, Koch A, et al. Value of magnifying chromoendoscopy and narrow band imaging (NBI) in classifying colorectal polyps: a prospective controlled study. Endoscopy. 2007;39:1092-1096.
Uedo N, Iishi H, Tatsuta M, et al. A novel videoendoscopy system by using autofluorescence and reflectance imaging for diagnosis of oesophagogastric cancers. Gastrointest Endosc. 2005;62:521-528.
van den Broek FJ, Fockens P, Dekker E. Review article. New developments in colonic imaging. Aliment Pharmacol Ther. 2007;26(Suppl 2):91-99.
van den Broek FJ, Fockens P, van Eeden S, et al. Endoscopic tri-modal imaging for surveillance in ulcerative colitis: randomised comparison of high-resolution endoscopy and autofluorescence imaging for neoplasia detection; and evaluation of narrow-band imaging for classification of lesions. Gut. 2008;57(8):1083-1089.
van den Broek FJ, Reitsma JL, Curvers WL, et al. Systematic review of narrow-band imaging for detection and differentiation of neoplastic and non neoplastic lesion in the colon. Gastrointest Endosc. 2009;69(1):124-135.
Wolfsen HC, Crook JE, Krishna M, et al. Prospective, controlled tandem endoscopy study of narrow band imaging for dysplasia detection in Barrett’s esophagus. Gastroenterology. 2008;135:24-31.
Yagi K, Nakamura A, Sekine A. Comparison between magnifying endoscopy and histological, culture and urease test findings from the gastric mucosa of the corpus. Endoscopy. 2002;34:376-381.
Yao K, Oishi T. Microgastroscopic findings of mucosal microvascular architecture as visualized by magnifying endoscopy. Digest Endosc. 2001;13:S27-S33.
Yao K, Oishi T, Matsui T, et al. Novel magnified endoscopic findings of microvascular architecture in intramucosal gastric cancer. Gastrointest Endosc. 56, 2002. 279–278
Yoshida T, Inoue H, Usui S, et al. Narrow-band imaging system with magnifying endoscopy for superficial esophageal lesions. Gastrointest Endosc. 2004;59:288-295.