[level-membership-for-neurology-category]
Chapter 3 Acute Stroke Imaging
There was a time, not too long ago, when acute brain imaging in patients with suspected stroke was thought to be useful only to exclude hemorrhage or obvious stroke mimickers, such as tumors. The introduction of effective acute stroke therapies changed this conception completely, however. Today emergency brain imaging is essential for the management of acute stroke patients. We have learned that computed tomography (CT) scans can offer valuable information even when obtained within the first few hours of the ischemic event (dispelling the notion that CT scans are not useful for ischemic strokes until 1 or 2 days after onset). New CT-based protocols, including CT perfusion (CTP) scans and CT angiograms, are rapidly gaining ground in clinical practice. Diffusion-weighted and perfusion-weighted (DWI and PWI) magnetic resonance imaging (MRI) provide the ability to depict the penumbra and promise expansion of the therapeutic window for vessel opening on individual cases based on the subsistence of salvageable tissue. Conventional angiography has been transformed from a purely diagnostic test into a means for therapeutic intervention. Even transcranial Doppler may have an important role in the emergent evaluation and management of acute ischemic stroke, providing proof of large intracranial vessel occlusion and possibly improving the chances of recanalization with thrombolysis when continuous insonation is employed.
The uses of various neuroimaging techniques in acute stroke are multiple and continue to expand. The most common current indications and purposes of acute neuroimaging in stroke patients are listed in Table 3-1.
TABLE 3-1 Indications and purposes of emergency neuroimaging in patients with suspected acute ischemic stroke
| Indication/purpose | Imaging modality |
|---|---|
| Confirmation of diagnosis (TIA vs. stroke vs. stroke mimics) | CT/MRI |
| Differentiation of ischemia vs. hemorrhage | CT/MRI |
| Visualization of established infarction (as contraindication for thrombolysis) | CT |
| Localization of ischemia/stroke pattern (which may guide evaluation of stroke mechanism) | CT/MRI |
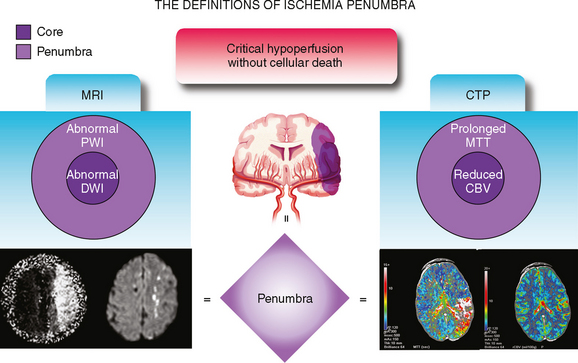
| Evaluation of penumbra (which may extend therapeutic window for acute revascularization) | DWI-PWI/CTP |
| Identification of early prognostic markers (e.g., HDMCA sign, extensive high ASPECTS score, large volume of DWI restriction) | CT/MRI |
| Visualization of arterial site of occlusion | MRA/CTA/catheter angiography |
| Documentation of recanalization | MRA/CTA/catheter angiography/TCD |
| US-assisted intravenous thrombolysis | TCD |
| Access and information to make endovascular treatment possible | Catheter angiography |
ASPECTS, Alberta Stroke Program Early CT Score; CT, computed tomography; CTA, CT angiography; CTP, CT perfusion; DWI, diffusion-weighted imaging; HDMCA, hyperdense middle cerebral artery; MRA, magnetic resonance angiography; MRI, magnetic resonance imaging; PWI, perfusion-weighted imaging; TCD, transcranial Doppler; TIA, transient ischemic attack; US, ultrasound.
COMPUTED TOMOGRAPHY
CT Signs of Acute Ischemia
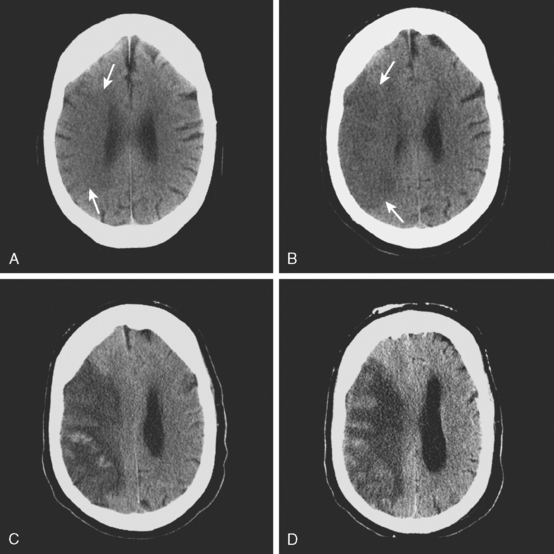
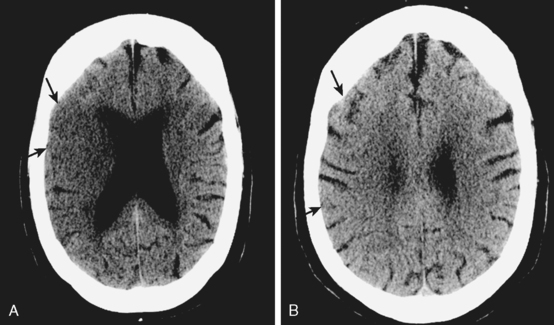
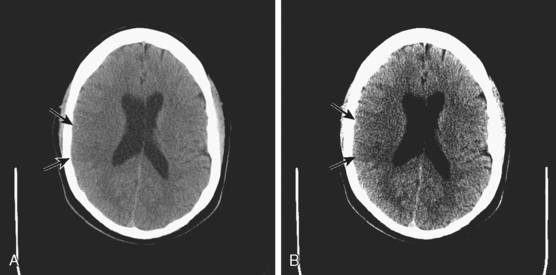
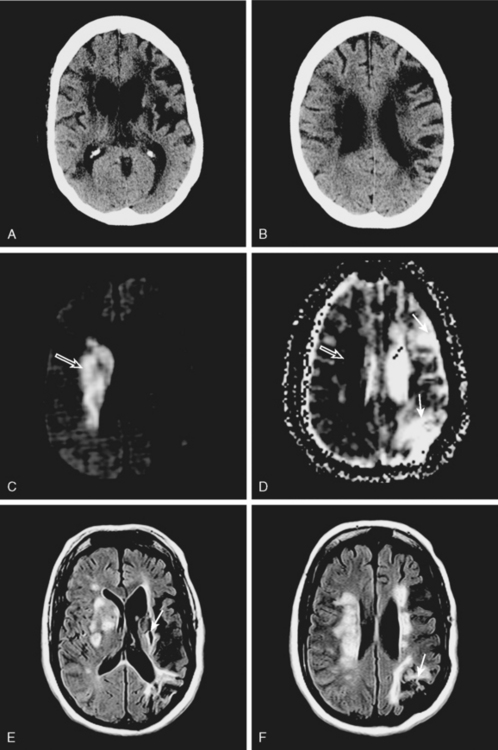
A 50-year-old man with a history of hypertension and rapid palpitations presented to the emergency department with acute left hemiparesis. Neurological examination showed right gaze preference, left homonymous hemianopia, left hemiparesis, and left hemineglect. Initial CT scan obtained 5 hours and 20 minutes after symptom onset revealed early signs of edema and infarction throughout the territory of the right middle cerebral artery (Figure 3-1, upper row). Because of the presence of these radiological findings, endovascular revascularization treatments were not attempted. On Day 3, he was more somnolent, and a repeat CT scan showed spontaneous hemorrhage in the area of infarction (Figure 3-1, lower row). The patient was diagnosed with atrial fibrillation, and anticoagulation was subsequently started for secondary stroke prevention. He survived his stroke but remained moderately disabled.
| Sign | Significance |
|---|---|
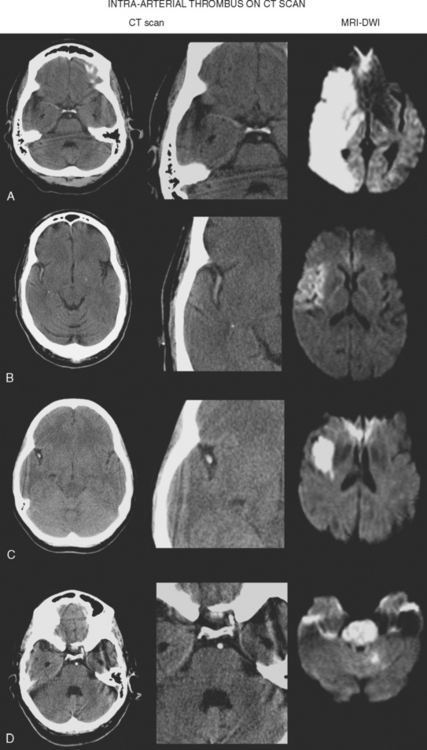
| Hyperdense vessel sign | Intraluminal thrombus |
| Loss of insular ribbon | Focal tissue edema |
| Obscuration of the lenticular nucleus | Focal tissue edema |
| Loss of gray–white matter distinction | Focal tissue edema |
| Sulcal effacement | Focal tissue edema |
| Areas of hypoattenuation | Tissue infarction |
CT Perfusion
TABLE 3-3 Relative advantages of CT perfusion and DWI-PWI MRI for the assessment of ischemic penumbra.
| CT perfusion |
| Easier access |
| Rapid acquisition of images |
| Robust quantitative physiological measurements |
| Feasible in patients with contraindication for MRI |
| DWI-PWI MRI |
| May be easier to visualize the penumbra |
| Depiction of cellular edema |
| Greater spatial resolution (whole brain imaging) |
| Does not require iodine contrast |
CT, computed tomography; DWI, diffusion-weighted imaging; MRI, magnetic resonance imaging; PWI, perfusion-weighted imaging.
CT Angiogram
MAGNETIC RESONANCE IMAGING
Furthermore, MRI (with DWI and susceptibility weighted sequence) has been proved superior to CT scanning for the detection of acute ischemia and chronic hemorrhage and at least comparable to CT for the diagnosis of acute hemorrhage.36 Thus solid arguments support the use of MRI as the primary imaging modality for the emergency evaluation of acute stroke patients if the study can be performed without delay.
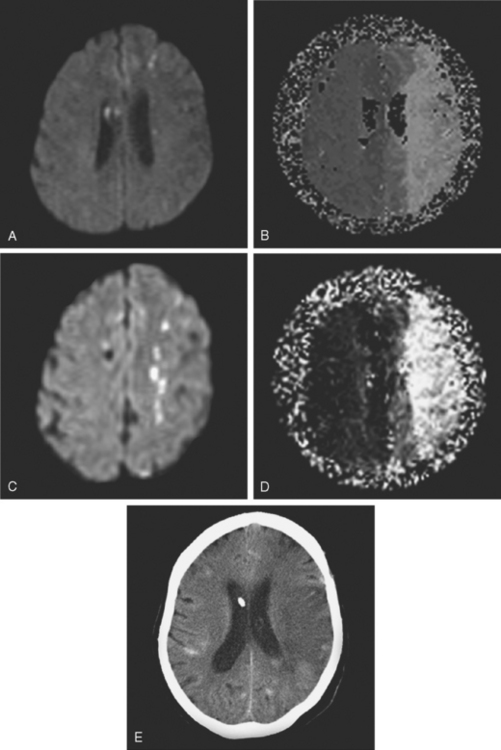
Diffusion-Weighted and Perfusion-Weighted Imaging
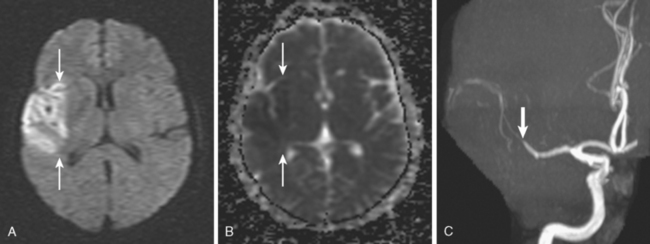
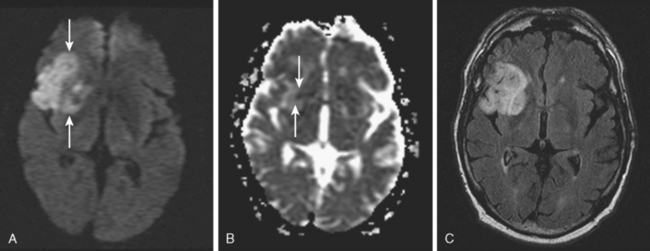
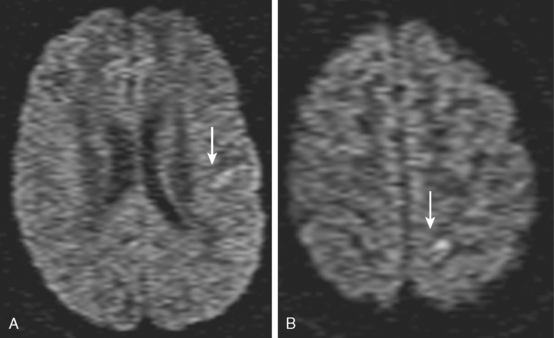
TABLE 3-4 Main practical uses of DWI in patients with acute stroke presentation.
| Hyperacute and acute diagnostic confirmation of ischemic stroke |
| Differentiation of acute vs. subacute vs. chronic ischemic lesions |
| Assessment of ischemic penumbra (in combination with PWI) |
| Acute differential diagnosis between TIA and minor stroke with reversible neurological deficits |
| Distinction of cytotoxic and vasogenic edema (in conditions such as eclampsia or hyperperfusion syndrome) |
| Identification of patients at risk of severe reperfusion hemorrhage |
DWI, diffusion-weighted imaging; MRI, magnetic resonance imaging; PWI, perfusion-weighted imaging; TIA, transient ischemic attack.
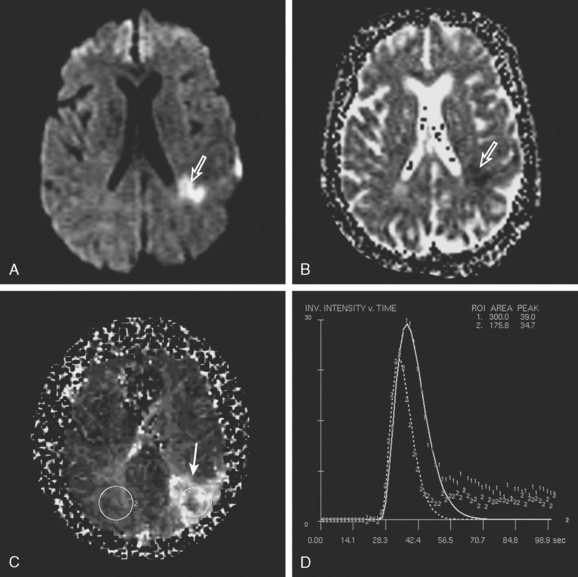
PWI-DWI Mismatch
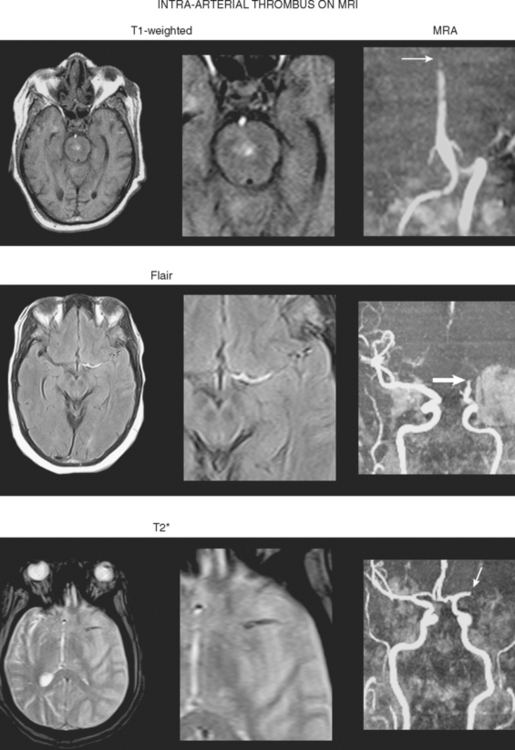
Direct Thrombus Visualization
MAGNETIC RESONANCE ANGIOGRAPHY
IMAGING IN STROKE EMERGENCIES
Intravenous Thrombolysis
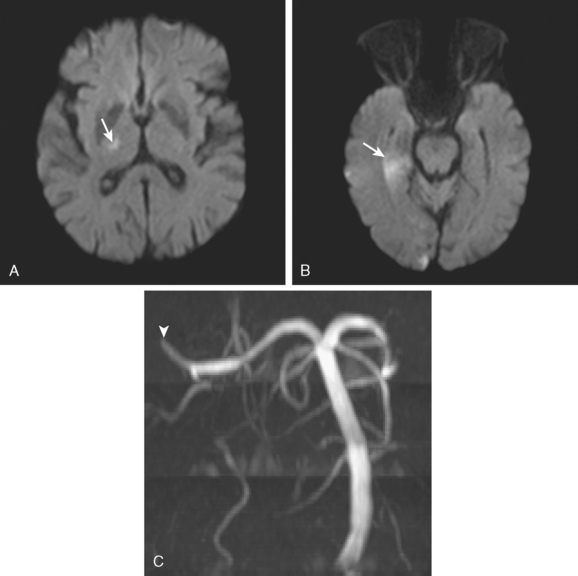
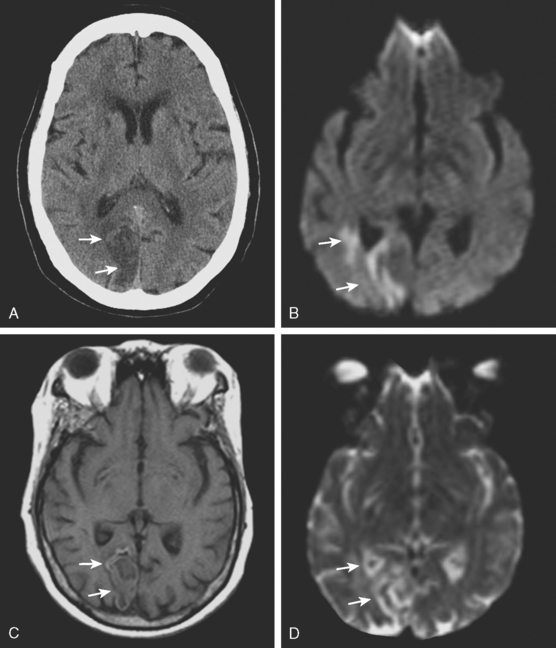
A 72-year-old man presented to the emergency department with sudden onset of visual disturbance and behavioral changes. On neurological examination, he was mildly confused and had a dense left homonymous hemianopia. He also had slight weakness in the left upper extremity and possible mild hypoesthesia on the left hemibody. CT scan obtained 90 minutes after symptom onset demonstrated no acute changes. He underwent intravenous thrombolysis starting 115 minutes after symptom onset. Over the following 12 hours, his symptoms gradually improved and 24 hours later, he had no residual deficits. Brain MRI at that point revealed an acute infarction involving the posterior aspect of the right medial temporal lobe and a small area of the posterior limb of the right internal capsule (see Figure 3-20). MRA of intracranial circulation demonstrated distal occlusion of the terminal segment of the posterior cerebral artery (see Figure 3-20). Because the patient’s clinical syndrome at presentation had been consistent with a proximal occlusion of the posterior cerebral artery, these radiological findings were most likely caused by fragmentation of the initially larger clot due to successful thrombolysis that subsequently led to a more distal (and asymptomatic) vessel occlusion.
Intra-Arterial Revascularization Therapies
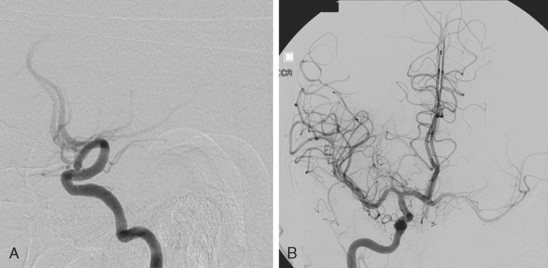
A 52-year-old woman presented to a local hospital with acute aphasia and right hemiplegia. CT scan was negative for hemorrhage, and she was referred to our academic hospital for acute management. Upon arrival to our emergency department 3 hours and 30 minutes after symptom onset, her examination revealed global aphasia, left gaze preference, right homonymous hemianopia, paralysis of the lower right face and the right arm, comparatively milder weakness of the right leg, and right hemihypoesthesia. Her initial National Institutes of Health Stroke Scale score (NIHSS) was 20. Because she was outside of the accepted therapeutic window for intravenous thrombolysis, she was immediately taken to the angiographic suite. Digital subtraction angiography demonstrated a proximal occlusion of the M1 segment of the left middle cerebral artery. Intra-arterial infusion of the rt-PA (22 mg) combined with mechanical disruption of the clot and subsequent angioplasty of the previously occluded segment resulted in successful vessel recanalization (Figure 3-21). Over the following 24 hours, the patient recovered substantially from her initially severe deficits. Repeat brain imaging only showed a small left periopercular infarction. Her NIHSS at discharge was 4, and after a few weeks of outpatient rehabilitation, she was able to return to work with no functional restrictions.
Massive Hemispheric Infarction
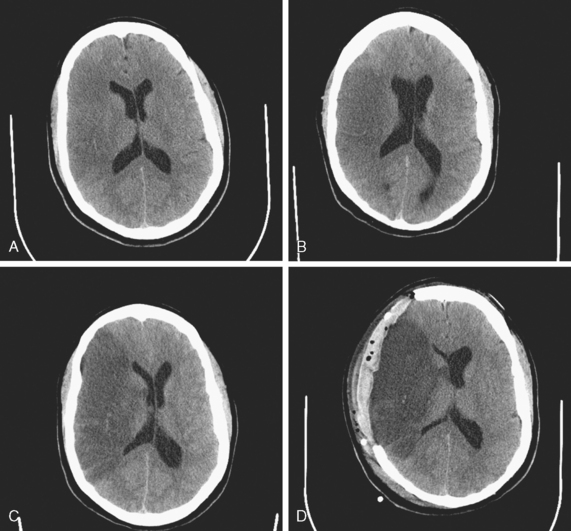
A 44-year-old woman was found collapsed in her apartment by her neighbor and brought emergently to the hospital. On examination, she was awake but incoherent. She had left hemianopia, hemiplegia, hyperreflexia, Babinski sign, and hemineglect. CT scan of the brain confirmed the presence of extensive infarction in the right middle cerebral artery territory (Figure 3-23, A). The patient was carefully monitored in the stroke unit, and 36 hours later, she was noticed to have difficulty opening her eyes despite being awake and able to follow other commands (cerebral ptosis). She had also developed Babinski sign on the right side (i.e., ipsilateral to the infarcted hemisphere). Repeat CT scan showed progression of mass effect and midline shift (Figure 3-23, B). Forty-two hours after admission, she became less arousable, and a new CT scan disclosed a 15-mm displacement of the septum pellucidum (Figure 3-23, C). Her pupils remained isocoric and reactive to light. She was intubated, hyperventilated, treated with 1 g/kg of 20% mannitol, and taken to the operating room. Decompressive hemicraniectomy and duroplasty were performed without complications. Repeat CT scan 18 hours after surgery demonstrated outward brain herniation through the site of craniectomy with partial improvement in the midline shift (Figure 3-23, D). The patient’s level of consciousness improved after surgery and did not decline again. Six months after the stroke, she had achieved meaningful functional recovery, with moderate residual disability. She underwent replacement of the bone flap with no complications.
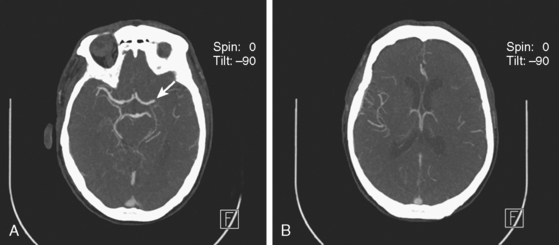
Acute Internal Carotid Artery Occlusion
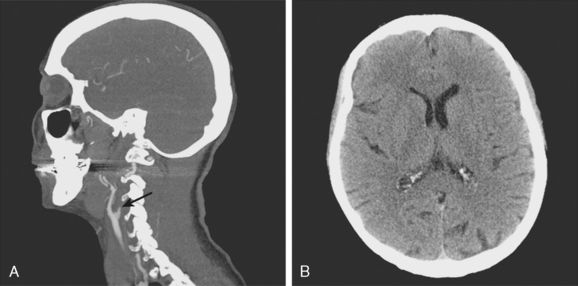
A 49-year-old woman with history of hypertension and hyperlipidemia presented to our emergency department with fluctuating depression in her level of consciousness; forced right gaze deviation; dense left hemianopia; left hemiplegia involving face, arm, and leg; and left hemineglect. At her worst, her NIHSS was 22. Initial CT scan of the brain was unremarkable except for possible slight effacement of the insular ribbon. CT angiogram revealed occlusion of the right cervical internal carotid artery near its origin (Figure 3-24, A). The patient was aggressively treated with intravenous fluids and phenylephrine to elevate her blood pressure and started to respond within minutes to this treatment. A few hours later, her examination had essentially normalized. Her mean arterial pressure was maintained above 120 mm Hg over the following 24 hours, and then fluids and vasopressor were gradually tapered. Her deficits did not recur, and she was discharged home 2 days later with normal neurological function and CT scan of the brain (Figure 3-24, B).
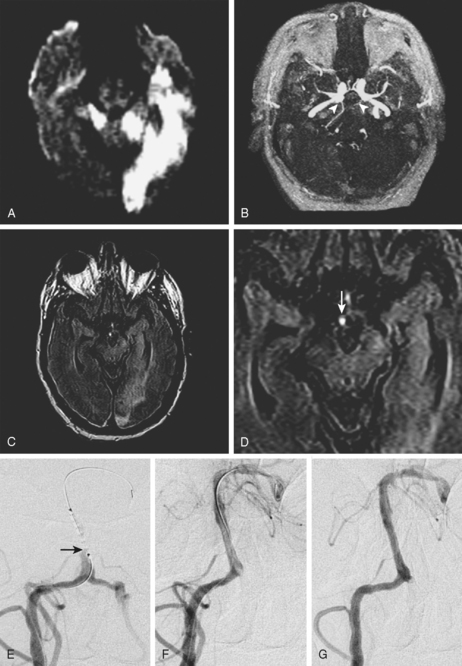
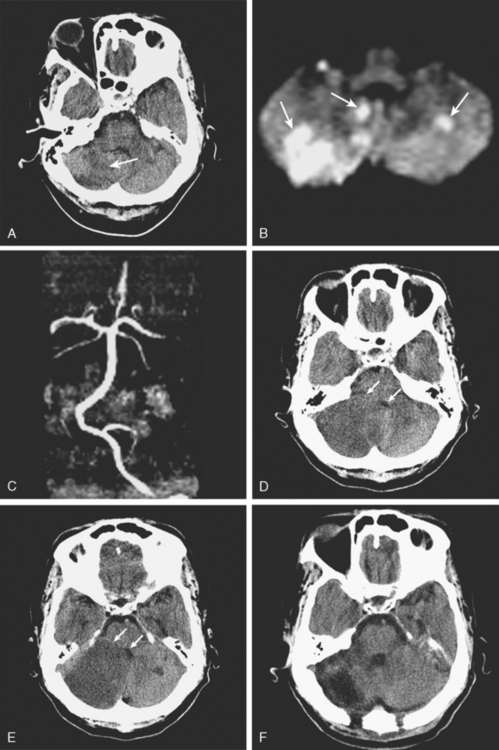
Basilar Artery Occlusion
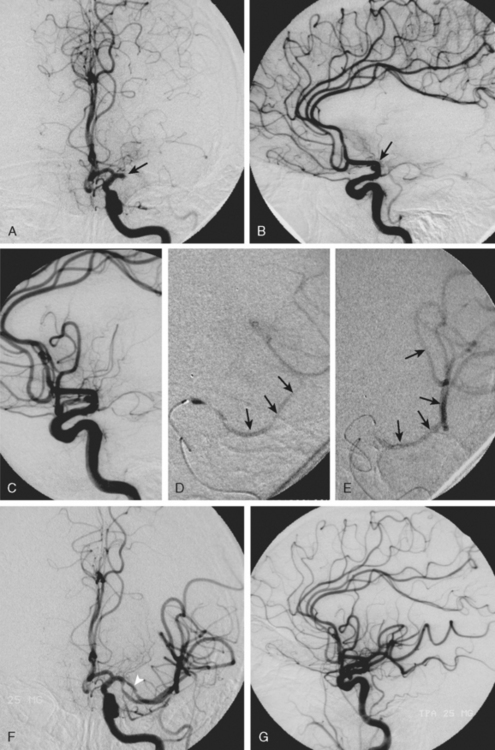
A 52-year-old man with history of uncontrolled hypertension, diabetes, hyperlipidemia, and smoking was admitted with bilateral acute cerebellar infarctions. Brain MRI (Figure 3-25, A-D) confirmed the areas of cerebellar ischemia and also showed changes consistent with acute basilar trunk occlusion (hyperintense vessel signal on FLAIR and absent basilar flow on MRA, which allowed visualization of bilaterally patent posterior communicating arteries). During the first day, the patient remained stable on intravenous crystalloids, colloids, and heparin. The following morning, however, he became more difficult to arouse, and he developed diplopia with disconjugate gaze and worsening bilateral weakness. Dopamine infusion was initiated to elevate his blood pressure resulting in partial improvement of his new deficits. He then underwent emergent catheter angiography, which demonstrated a proximal occlusion of the basilar artery (Figure 3-25, E). The patient was treated with mechanical clot disruption and angioplasty of the basilar artery with excellent radiographic results (Figure 3-25, F and G). After the procedure, his deficits improved, and he was discharged home 10 days later with residual ataxia. His residual deficits continued to improve steadily over the following year. Three years later, the patient remained free of recurrent ischemic neurological symptoms, and his basilar artery remained widely patent on follow-up noninvasive angiography.
Massive Cerebellar Infarction
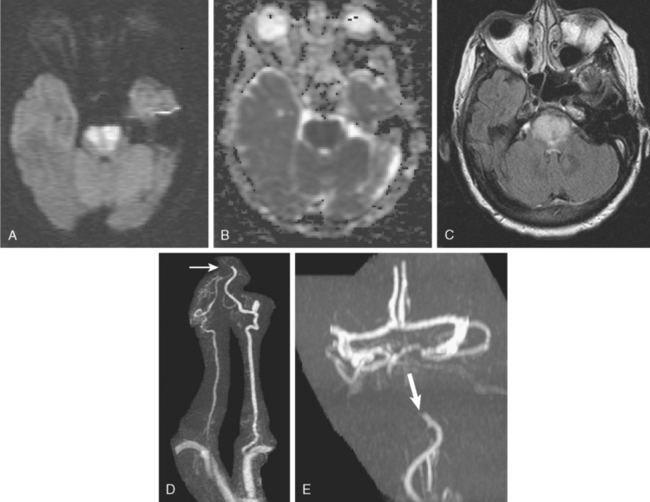
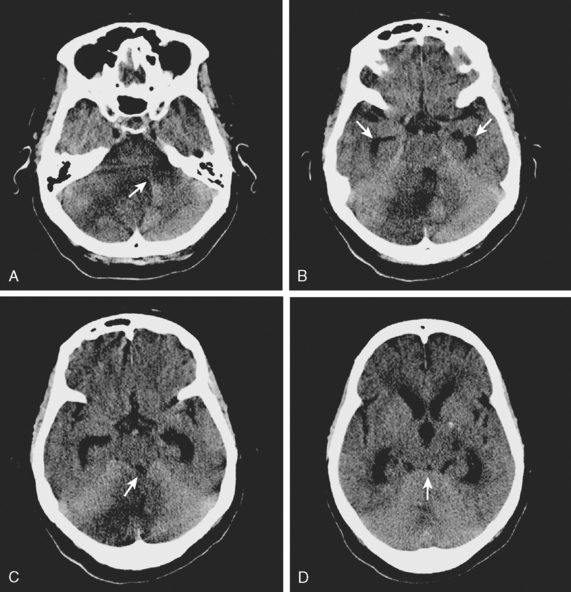
A 42-year-old woman with history of hypertension and diabetes presented with sudden onset of acute ataxia. Brain imaging (CT scan and MRI) disclosed patchy cerebellar infarctions, mostly involving the right posterior inferior cerebellar artery territory (Figure 3-27, A and B). MRA of the intracranial circulation revealed occlusion of the right vertebral artery (Figure 3-27, C). The following day, the patient was clinically stable, but swelling of the infarction was already evident on repeat CT scan (Figure 3-27, D). Early on the third hospital day, she became drowsy and developed new right facial and abducens palsies. A new CT scan revealed further progression of mass effect (Figure 3-27, E). She underwent emergency suboccipital craniectomy. After surgery, her level of consciousness improved, but her right esotropia persisted. Postsurgical imaging confirmed adequate decompression (Figure 3-27, F). Although no additional complications occurred during the rest of the hospitalization, her functional recovery was limited.
Subacute and Chronic Infarctions
1 Adams HPJr, Del Zoppo G, Alberts MJ, Bhatt DL, Brass L, Furlan A, et al. Guidelines for the early management of adults with ischemic stroke: a guideline from the American Heart Association/American Stroke Association Stroke Council, Clinical Cardiology Council, Cardiovascular Radiology and Intervention Council, and the Atherosclerotic Peripheral Vascular Disease and Quality of Care Outcomes in Research Interdisciplinary Working Groups: the American Academy of Neurology affirms the value of this guideline as an educational tool for neurologists. Stroke. 2007;38:1655-1711.
2 Barber PA, Demchuk AM, Zhang J, Buchan AM. Validity and reliability of a quantitative computed tomography score in predicting outcome of hyperacute stroke before thrombolytic therapy. ASPECTS Study Group. Alberta Stroke Programme Early CT Score. Lancet. 2000;355:1670-1674.
3 Muir KW, Buchan A, von Kummer R, Rother J, Baron JC. Imaging of acute stroke. Lancet Neurol. 2006;5:755-768.
4 Sobesky J, von Kummer R, Frackowiak M, Zaro WO, Lehnhardt FG, Dohmen C, et al. Early ischemic edema on cerebral computed tomography: its relation to diffusion changes and hypoperfusion within 6 h after human ischemic stroke. A comparison of CT, MRI and PET. Cerebrovasc Dis. 2006;21:336-339.
5 Grotta JC, Chiu D, Lu M, Patel S, Levine SR, Tilley BC, et al. Agreement and variability in the interpretation of early CT changes in stroke patients qualifying for intravenous rtPA therapy. Stroke. 1999;30:1528-1533.
6 Dippel DW, Du Ry van Beest H, van Kooten F, Koudstaal PJ. The validity and reliability of signs of early infarction on CT in acute ischaemic stroke. Neuroradiology. 2000;42:629-633.
7 Lev MH, Farkas J, Gemmete JJ, Hossain ST, Hunter GJ, Koroshetz WJ, et al. Acute stroke: improved nonenhanced CT detection—benefits of soft-copy interpretation by using variable window width and center level settings. Radiology. 1999;213:150-155.
8 Hacke W, Kaste M, Fieschi C, von Kummer R, Davalos A, Meier D, et al. Randomised double-blind placebo-controlled trial of thrombolytic therapy with intravenous alteplase in acute ischaemic stroke (ECASS II). Second European-Australasian Acute Stroke Study Investigators. Lancet. 1998;352:1245-1251.
9 Hacke W, Kaste M, Fieschi C, Toni D, Lesaffre E, von Kummer R, et al. Intravenous thrombolysis with recombinant tissue plasminogen activator for acute hemispheric stroke. The European Cooperative Acute Stroke Study (ECASS). JAMA. 1995;274:1017-1025.
10 The National Institute of Neurological Disorders and Stroke rt-PA Stroke Study Group. Tissue plasminogen activator for acute ischemic stroke. N Engl J Med. 1995;333:1581-1587.
11 Patel SC, Levine SR, Tilley BC, Grotta JC, Lu M, Frankel M, et al. Lack of clinical significance of early ischemic changes on computed tomography in acute stroke. JAMA. 2001;286:2830-2838.
12 Dzialowski I, Hill MD, Coutts SB, Demchuk AM, Kent DM, Wunderlich O, et al. Extent of early ischemic changes on computed tomography (CT) before thrombolysis: prognostic value of the Alberta Stroke Program Early CT Score in ECASS II. Stroke. 2006;37:973-978.
13 Demchuk AM, Hill MD, Barber PA, Silver B, Patel SC, Levine SR. Importance of early ischemic computed tomography changes using ASPECTS in NINDS rtPA Stroke Study. Stroke. 2005;36:2110-2115.
14 Coutts SB, Demchuk AM, Barber PA, Hu WY, Simon JE, Buchan AM, et al. Interobserver variation of ASPECTS in real time. Stroke. 2004;35:e103-e105.
15 Demaerschalk BM, Silver B, Wong E, Merino JG, Tamayo A, Hachinski V. ASPECT scoring to estimate >1/3 middle cerebral artery territory infarction. Can J Neurol Sci. 2006;33:200-204.
16 Leys D, Pruvo JP, Godefroy O, Rondepierre P, Leclerc X. Prevalence and significance of hyperdense middle cerebral artery in acute stroke. Stroke. 1992;23:317-324.
17 Tei H, Uchiyama S, Usui T. Predictors of good prognosis in total anterior circulation infarction within 6 h after onset under conventional therapy. Acta Neurol Scand. 2006;113:301-306.
18 Qureshi AI, Ezzeddine MA, Nasar A, Suri MF, Kirmani JF, Janjua N, et al. Is IV tissue plasminogen activator beneficial in patients with hyperdense artery sign? Neurology. 2006;66:1171-1174.
19 Derex L, Hermier M, Adeleine P, Pialat JB, Wiart M, Berthezene Y, et al. Clinical and imaging predictors of intracerebral haemorrhage in stroke patients treated with intravenous tissue plasminogen activator. J Neurol Neurosurg Psychiatry. 2005;76:70-75.
20 Manno EM, Nichols DA, Fulgham JR, Wijdicks EF. Computed tomographic determinants of neurologic deterioration in patients with large middle cerebral artery infarctions. Mayo Clin Proc. 2003;78:156-160.
21 Linfante I, Llinas RH, Selim M, Chaves C, Kumar S, Parker RA, et al. Clinical and vascular outcome in internal carotid artery versus middle cerebral artery occlusions after intravenous tissue plasminogen activator. Stroke. 2002;33:2066-2071.
22 Barber PA, Demchuk AM, Hudon ME, Pexman JH, Hill MD, Buchan AM. Hyperdense sylvian fissure MCA “dot” sign: A CT marker of acute ischemia. Stroke. 2001;32:84-88.
23 Leary MC, Kidwell CS, Villablanca JP, Starkman S, Jahan R, Duckwiler GR, et al. Validation of computed tomographic middle cerebral artery “dot” sign: an angiographic correlation study. Stroke. 2003;34:2636-2640.
24 Lee TC, Bartlett ES, Fox AJ, Symons SP. The hypodense artery sign. AJNR Am J Neuroradiol. 2005;26:2027-2029.
25 Srinivasan A, Goyal M, Azri FA, Lum C. State-of-the-art imaging of acute stroke. Radiographics. 2006;26(1 Suppl):S75-95.
26 Srinivasan A, Goyal M, Lum C, Nguyen T, Miller W. Processing and interpretation times of CT angiogram and CT perfusion in stroke. Can J Neurol Sci. 2005;32:483-486.
27 Smith WS, Roberts HC, Chuang NA, Ong KC, Lee TJ, Johnston SC, et al. Safety and feasibility of a CT protocol for acute stroke: combined CT, CT angiography, and CT perfusion imaging in 53 consecutive patients. AJNR Am J Neuroradiol. 2003;24:688-690.
28 Muir KW, Halbert HM, Baird TA, McCormick M, Teasdale E. Visual evaluation of perfusion computed tomography in acute stroke accurately estimates infarct volume and tissue viability. J Neurol Neurosurg Psychiatry. 2006;77:334-339.
29 Parsons MW, Pepper EM, Chan V, Siddique S, Rajaratnam S, Bateman GA, et al. Perfusion computed tomography: prediction of final infarct extent and stroke outcome. Ann Neurol. 2005;58:672-679.
30 Wintermark M, Reichhart M, Cuisenaire O, Maeder P, Thiran JP, Schnyder P, et al. Comparison of admission perfusion computed tomography and qualitative diffusion- and perfusion-weighted magnetic resonance imaging in acute stroke patients. Stroke. 2002;33:2025-2031.
31 Murphy BD, Fox AJ, Lee DH, Sahlas DJ, Black SE, Hogan MJ, et al. Identification of penumbra and infarct in acute ischemic stroke using computed tomography perfusion-derived blood flow and blood volume measurements. Stroke. 2006;37:1771-1777.
32 Wintermark M, Flanders AE, Velthuis B, Meuli R, van Leeuwen M, Goldsher D, et al. Perfusion-CT assessment of infarct core and penumbra: receiver operating characteristic curve analysis in 130 patients suspected of acute hemispheric stroke. Stroke. 2006;37:979-985.
33 Sanelli PC, Nicola G, Tsiouris AJ, Ougorets I, Knight C, Frommer B, et al. Reproducibility of postprocessing of quantitative CT perfusion maps. AJR Am J Roentgenol. 2007;188:213-218.
34 Shrier DA, Tanaka H, Numaguchi Y, Konno S, Patel U, Shibata D. CT angiography in the evaluation of acute stroke. AJNR Am J Neuroradiol. 1997;18:1011-1020.
35 Hunter GJ, Silvennoinen HM, Hamberg LM, Koroshetz WJ, Buonanno FS, Schwamm LH, et al. Whole-brain CT perfusion measurement of perfused cerebral blood volume in acute ischemic stroke: probability curve for regional infarction. Radiology. 2003;227:725-730.
36 Chalela JA, Kidwell CS, Nentwich LM, Luby M, Butman JA, Demchuk AM, et al. Magnetic resonance imaging and computed tomography in emergency assessment of patients with suspected acute stroke: a prospective comparison. Lancet. 2007;369:293-298.
37 Fiebach JB, Schellinger PD, Jansen O, Meyer M, Wilde P, Bender J, et al. CT and diffusion-weighted MR imaging in randomized order: diffusion-weighted imaging results in higher accuracy and lower interrater variability in the diagnosis of hyperacute ischemic stroke. Stroke. 2002;33:2206-2210.
38 Lansberg MG, Albers GW, Beaulieu C, Marks MP. Comparison of diffusion-weighted MRI and CT in acute stroke. Neurology. 2000;54:1557-1561.
39 Lansberg MG, Norbash AM, Marks MP, Tong DC, Moseley ME, Albers GW. Advantages of adding diffusion-weighted magnetic resonance imaging to conventional magnetic resonance imaging for evaluating acute stroke. Arch Neurol. 2000;57:1311-1316.
40 Burdette JH, Elster AD, Ricci PE. Acute cerebral infarction: quantification of spin-density and T2 shine-through phenomena on diffusion-weighted MR images. Radiology. 1999;212:333-339.
41 Schlaug G, Siewert B, Benfield A, Edelman RR, Warach S. Time course of the apparent diffusion coefficient (ADC) abnormality in human stroke. Neurology. 1997;49:113-119.
42 Warach S, Gaa J, Siewert B, Wielopolski P, Edelman RR. Acute human stroke studied by whole brain echo planar diffusion-weighted magnetic resonance imaging. Ann Neurol. 1995;37:231-241.
43 Schulz UG, Briley D, Meagher T, Molyneux A, Rothwell PM. Diffusion-weighted MRI in 300 patients presenting late with subacute transient ischemic attack or minor stroke. Stroke. 2004;35:2459-2465.
44 Crisostomo RA, Garcia MM, Tong DC. Detection of diffusion-weighted MRI abnormalities in patients with transient ischemic attack: correlation with clinical characteristics. Stroke. 2003;34:932-937.
45 Kidwell CS, Alger JR, Di Salle F, Starkman S, Villablanca P, Bentson J, et al. Diffusion MRI in patients with transient ischemic attacks. Stroke. 1999;30:1174-1180.
46 Oppenheim C, Lamy C, Touze E, Calvet D, Hamon M, Mas JL, et al. Do transient ischemic attacks with diffusion-weighted imaging abnormalities correspond to brain infarctions? AJNR Am J Neuroradiol. 2006;27:1782-1787.
47 Schaefer PW, Grant PE, Gonzalez RG. Diffusion-weighted MR imaging of the brain. Radiology. 2000;217:331-345.
48 Sobesky J, Zaro WO, Lehnhardt FG, Hesselmann V, Thiel A, Dohmen C, et al. Which time-to-peak threshold best identifies penumbral flow? A comparison of perfusion-weighted magnetic resonance imaging and positron emission tomography in acute ischemic stroke. Stroke. 2004;35:2843-2847.
49 Parsons MW, Yang Q, Barber PA, Darby DG, Desmond PM, Gerraty RP, et al. Perfusion magnetic resonance imaging maps in hyperacute stroke: relative cerebral blood flow most accurately identifies tissue destined to infarct. Stroke. 2001;32:1581-1587.
50 Rivers CS, Wardlaw JM, Armitage PA, Bastin ME, Carpenter TK, Cvoro V, et al. Do acute diffusion- and perfusion-weighted MRI lesions identify final infarct volume in ischemic stroke? Stroke. 2006;37:98-104.
51 Barber PA, Davis SM, Darby DG, Desmond PM, Gerraty RP, Yang Q, et al. Absent middle cerebral artery flow predicts the presence and evolution of the ischemic penumbra. Neurology. 1999;52:1125-1132.
52 Fisher M. Is penumbral imaging useful for extending the treatment window for intravenous tissue plasminogen activator? Ann Neurol. 2006;60:499-501.
53 Butcher KS, Parsons M, MacGregor L, Barber PA, Chalk J, Bladin C, et al. Refining the perfusion-diffusion mismatch hypothesis. Stroke. 2005;36:1153-1159.
54 Wu O, Christensen S, Hjort N, Dijkhuizen RM, Kucinski T, Fiehler J, et al. Characterizing physiological heterogeneity of infarction risk in acute human ischaemic stroke using MRI. Brain. 2006;129(Pt 9):2384-2393.
55 Fiehler J, Knudsen K, Kucinski T, Kidwell CS, Alger JR, Thomalla G, et al. Predictors of apparent diffusion coefficient normalization in stroke patients. Stroke. 2004;35:514-519.
56 Sobesky J, Zaro WO, Lehnhardt FG, Hesselmann V, Neveling M, Jacobs A, et al. Does the mismatch match the penumbra? Magnetic resonance imaging and positron emission tomography in early ischemic stroke. Stroke. 2005;36:980-985.
57 Kohrmann M, Juttler E, Fiebach JB, Huttner HB, Siebert S, Schwark C, et al. MRI versus CT-based thrombolysis treatment within and beyond the 3 h time window after stroke onset: a cohort study. Lancet Neurol. 2006;5:661-667.
58 Furlan AJ, Eyding D, Albers GW, Al Rawi Y, Lees KR, Rowley HA, et al. Dose Escalation of Desmoteplase for Acute Ischemic Stroke (DEDAS): evidence of safety and efficacy 3 to 9 hours after stroke onset. Stroke. 2006;37:1227-1231.
59 Hacke W, Albers G, Al Rawi Y, Bogousslavsky J, Davalos A, Eliasziw M, et al. The Desmoteplase in Acute Ischemic Stroke Trial (DIAS): a Phase II MRI-based 9-hour window acute stroke thrombolysis trial with intravenous desmoteplase. Stroke. 2005;36:66-73.
60 Albers GW, Thijs VN, Wechsler L, Kemp S, Schlaug G, Skalabrin E, et al. Magnetic resonance imaging profiles predict clinical response to early reperfusion: the diffusion and perfusion imaging evaluation for understanding stroke evolution (DEFUSE) study. Ann Neurol. 2006;60:508-517.
61 Davis SM, Donnan GA, Parsons MW, Levi C, Butcher KS, Peeters A, et al. Effects of alteplase beyond 3 h after stroke in the Echoplanar Imaging Thrombolytic Evaluation Trial (EPITHET): a placebo-controlled randomised trial. Lancet Neurol. 2008;7:299-309.
62 Davalos A, Blanco M, Pedraza S, Leira R, Castellanos M, Pumar JM, et al. The clinical-DWI mismatch: a new diagnostic approach to the brain tissue at risk of infarction. Neurology. 2004;62:2187-2192.
63 Prosser J, Butcher K, Allport L, Parsons M, MacGregor L, Desmond P, et al. Clinical-diffusion mismatch predicts the putative penumbra with high specificity. Stroke. 2005;36:1700-1704.
64 Saqqur M, Hill MD, Alexandrov AV, Roy J, Schebel M, Krol A, et al. Derivation of power M-mode transcranial Doppler criteria for angiographic proven MCA occlusion. J Neuroimaging. 2006;16:323-328.
65 Cho KH, Kim JS, Kwon SU, Cho AH, Kang DW. Significance of susceptibility vessel sign on T2*-weighted gradient echo imaging for identification of stroke subtypes. Stroke. 2005;36:2379-2383.
66 Schellinger PD, Chalela JA, Kang DW, Latour LL, Warach S. Diagnostic and prognostic value of early MR Imaging vessel signs in hyperacute stroke patients imaged <3 hours and treated with recombinant tissue plasminogen activator. AJNR Am J Neuroradiol. 2005;26:618-624.
67 Kim HS, Lee DH, Choi CG, Kim SJ, Suh DC. Progression of middle cerebral artery susceptibility sign on T2*-weighted images: its effect on recanalization and clinical outcome after thrombolysis. AJR Am J Roentgenol. 2006;187:W650-W657.
68 Wilcock DJ, Jaspan T, Worthington BS. Problems and pitfalls of 3-D TOF magnetic resonance angiography of the intracranial circulation. Clin Radiol. 1995;50:526-532.
69 Yang JJ, Hill MD, Morrish WF, Hudon ME, Barber PA, Demchuk AM, et al. Comparison of pre- and postcontrast 3D time-of-flight MR angiography for the evaluation of distal intracranial branch occlusions in acute ischemic stroke. AJNR Am J Neuroradiol. 2002;23:557-567.
70 Wiginton CD, Kelly B, Oto A, Jesse M, Aristimuno P, Ernst R, et al. Gadolinium-based contrast exposure, nephrogenic systemic fibrosis, and gadolinium detection in tissue. AJR Am J Roentgenol. 2008;190:1060-1068.
71 Moreno-Romero JA, Segura S, Mascaro JMJr, Cowper SE, Julia M, Poch E, et al. Nephrogenic systemic fibrosis: a case series suggesting gadolinium as a possible aetiological factor. Br J Dermatol. 2007;157:783-787.
72 Shabana WM, Cohan RH, Ellis JH, Hussain HK, Francis IR, Su LD, et al. Nephrogenic systemic fibrosis: a report of 29 cases. AJR Am J Roentgenol. 2008;190:736-741.
73 Wahlgren N, Ahmed N, Davalos A, Ford GA, Grond M, Hacke W, et al. Thrombolysis with alteplase for acute ischaemic stroke in the Safe Implementation of Thrombolysis in Stroke-Monitoring Study (SITS-MOST): an observational study. Lancet. 2007;369:275-282.
74 Alexandrov AV, Molina CA, Grotta JC, Garami Z, Ford SR, Alvarez-Sabin J, et al. Ultrasound-enhanced systemic thrombolysis for acute ischemic stroke. N Engl J Med. 2004;351:2170-2178.
75 Saqqur M, Molina CA, Salam A, Siddiqui M, Ribo M, Uchino K, et al. Clinical deterioration after intravenous recombinant tissue plasminogen activator treatment: a multicenter transcranial Doppler study. Stroke. 2007;38:69-74.
76 Furlan A, Higashida R, Wechsler L, Gent M, Rowley H, Kase C, et al. Intra-arterial prourokinase for acute ischemic stroke. The PROACT II study: a randomized controlled trial. Prolyse in Acute Cerebral Thromboembolism. JAMA. 1999;282:2003-2011.
77 Smith WS, Sung G, Starkman S, Saver JL, Kidwell CS, Gobin YP, et al. Safety and efficacy of mechanical embolectomy in acute ischemic stroke: results of the MERCI trial. Stroke. 2005;36:1432-1438.
78 Smith WS. Safety of mechanical thrombectomy and intravenous tissue plasminogen activator in acute ischemic stroke. Results of the multi Mechanical Embolus Removal in Cerebral Ischemia (MERCI) trial, part I. AJNR Am J Neuroradiol. 2006;27:1177-1182.
79 Smith WS, Sung G, Saver J, Budzik R, Duckwiler G, Liebeskind DS, et al. Mechanical thrombectomy for acute ischemic stroke: final results of the Multi MERCI trial. Stroke. 2008;39:1205-1212.
80 Combined intravenous and intra-arterial recanalization for acute ischemic stroke: the Interventional Management of Stroke Study. Stroke. 2004;35:904-911.
81 The Interventional Management of Stroke (IMS) II Study. Stroke. 2007;38:2127-2135.
82 Noser EA, Shaltoni HM, Hall CE, Alexandrov AV, Garami Z, Cacayorin ED, et al. Aggressive mechanical clot disruption: a safe adjunct to thrombolytic therapy in acute stroke? Stroke. 2005;36:292-296.
83 Levy EI, Ecker RD, Horowitz MB, Gupta R, Hanel RA, Sauvageau E, et al. Stent-assisted intracranial recanalization for acute stroke: early results. Neurosurgery. 2006;58:458-463.
84 Abou-Chebl A, Bajzer CT, Krieger DW, Furlan AJ, Yadav JS. Multimodal therapy for the treatment of severe ischemic stroke combining GPIIb/IIIa antagonists and angioplasty after failure of thrombolysis. Stroke. 2005;36:2286-2288.
85 Velat GJ, Burry MV, Eskioglu E, Dettorre RR, Firment CS, Mericle RA. The use of abciximab in the treatment of acute cerebral thromboembolic events during neuroendovascular procedures. Surg Neurol. 2006;65:352-358. discussion.
86 Wijdicks EF, Rabinstein AA. Absolutely no hope? Some ambiguity of futility of care in devastating acute stroke. Crit Care Med. 2004;32:2332-2342.
87 Barber PA, Demchuk AM, Zhang J, Kasner SE, Hill MD, Berrouschot J, et al. Computed tomographic parameters predicting fatal outcome in large middle cerebral artery infarction. Cerebrovasc Dis. 2003;16:230-235.
88 Kasner SE, Demchuk AM, Berrouschot J, Schmutzhard E, Harms L, Verro P, et al. Predictors of fatal brain edema in massive hemispheric ischemic stroke. Stroke. 2001;32:2117-2123.
89 Pullicino PM, Alexandrov AV, Shelton JA, Alexandrova NA, Smurawska LT, Norris JW. Mass effect and death from severe acute stroke. Neurology. 1997;49:1090-1095.
90 Krieger DW, Demchuk AM, Kasner SE, Jauss M, Hantson L. Early clinical and radiological predictors of fatal brain swelling in ischemic stroke. Stroke. 1999;30:287-292.
91 Manno EM, Nichols DA, Fulgham JR, Wijdicks EF. Computed tomographic determinants of neurologic deterioration in patients with large middle cerebral artery infarctions. Mayo Clin Proc. 2003;78:156-160.
92 Wijdicks EF, Diringer MN. Middle cerebral artery territory infarction and early brain swelling: progression and effect of age on outcome. Mayo Clin Proc. 1998;73:829-836.
93 Barber PA, Powers W. MR DWI does not substitute for stroke severity scores in predicting stroke outcome. Neurology. 2006;66:1138-1139.
94 Hand PJ, Wardlaw JM, Rivers CS, Armitage PA, Bastin ME, Lindley RI, et al. MR diffusion-weighted imaging and outcome prediction after ischemic stroke. Neurology. 2006;66:1159-1163.
95 Hacke W, Schwab S, Horn M, Spranger M, De Georgia M, von Kummer R. “Malignant” middle cerebral artery territory infarction: clinical course and prognostic signs. Arch Neurol. 1996;53:309-315.
96 Vahedi K, Hofmeijer J, Juettler E, Vicaut E, George B, Algra A, et al. Early decompressive surgery in malignant infarction of the middle cerebral artery: a pooled analysis of three randomised controlled trials. Lancet Neurol. 2007;6:215-222.
97 Averbuch-Heller L, Leigh RJ, Mermelstein V, Zagalsky L, Streifler JY. Ptosis in patients with hemispheric strokes. Neurology. 2002;58:620-624.
98 Berrouschot J, Barthel H, von Kummer R, Knapp WH, Hesse S, Schneider D. 99m technetium-ethyl-cysteinate-dimer single-photon emission CT can predict fatal ischemic brain edema. Stroke. 1998;29:2556-2562.
99 Lampl Y, Sadeh M, Lorberboym M. Prospective evaluation of malignant middle cerebral artery infarction with blood-brain barrier imaging using Tc-99m DTPA SPECT. Brain Res. 2006;1113:194-199.
100 Maramattom BV, Bahn MM, Wijdicks EF. Which patient fares worse after early deterioration due to swelling from hemispheric stroke? Neurology. 2004;63:2142-2145.
101 Schonewille WJ, Algra A, Serena J, Molina CA, Kappelle LJ. Outcome in patients with basilar artery occlusion treated conventionally. J Neurol Neurosurg Psychiatry. 2005;76:1238-1241.
102 Wijdicks EF, Nichols DA, Thielen KR, Fulgham JR, Brown RDJr., Meissner I, et al. Intra-arterial thrombolysis in acute basilar artery thromboembolism: the initial Mayo Clinic experience. Mayo Clin Proc. 1997;72:1005-1013.
103 von Campe G, Regli F, Bogousslavsky J. Heralding manifestations of basilar artery occlusion with lethal or severe stroke. J Neurol Neurosurg Psychiatry. 2003;74:1621-1626.
104 Baird TA, Muir KW, Bone I. Basilar artery occlusion. Neurocrit Care. 2004;1:319-329.
105 Bergui M, Stura G, Daniele D, Cerrato P, Berardino M, Bradac GB. Mechanical thrombolysis in ischemic stroke attributable to basilar artery occlusion as first-line treatment. Stroke. 2006;37:145-150.
106 Lee KY, Han SW, Kim SH, Nam HS, Ahn SW, Kim DJ, et al. Early recanalization after intravenous administration of recombinant tissue plasminogen activator as assessed by pre- and post-thrombolytic angiography in acute ischemic stroke patients. Stroke. 2007;38:192-193.
107 Lindsberg PJ, Mattle HP. Therapy of basilar artery occlusion: a systematic analysis comparing intra-arterial and intravenous thrombolysis. Stroke. 2006;37:922-928.
108 Macdonell RA, Kalnins RM, Donnan GA. Cerebellar infarction: natural history, prognosis, and pathology. Stroke. 1987;18:849-855.
109 Jensen MB, St Louis EK. Management of acute cerebellar stroke. Arch Neurol. 2005;62:537-544.
110 Mathew P, Teasdale G, Bannan A, Oluoch-Olunya D. Neurosurgical management of cerebellar haematoma and infarct. J Neurol Neurosurg Psychiatry. 1995;59:287-292.
111 Lodder J, Krijne-Kubat B, van der Lugt PJ. Timing of autopsy-confirmed hemorrhagic infarction with reference to cardioembolic stroke. Stroke. 1988;19:1482-1484.
112 Chalela JA, Kasner SE. The fogging effect. Neurology. 2000;55:315.
113 Scuotto A, Cappabianca S, Melone MB, Puoti G. MRI “fogging” in cerebellar ischaemia: case report. Neuroradiology. 1997;39:785-787.
114 Uchino A, Sawada YA, Imaizumi T, Mineta T, Kudo S. Report of fogging effect on fast FLAIR magnetic resonance images of cerebral infarctions. Neuroradiology. 2004;46:40-43.
[/level-membership-for-neurology-category][not-level-membership-for-neurology-category]
Chapter 3 Acute Stroke Imaging
There was a time, not too long ago, when acute brain imaging in patients with suspected stroke was thought to be useful only to exclude hemorrhage or obvious stroke mimickers, such as tumors. The introduction of effective acute stroke therapies changed this conception completely, however. Today emergency brain imaging is essential for the management of acute stroke patients. We have learned that computed tomography (CT) scans can offer valuable information even when obtained within the first few hours of the ischemic event (dispelling the notion that CT scans are not useful for ischemic strokes until 1 or 2 days after onset). New CT-based protocols, including CT perfusion (CTP) scans and CT angiograms, are rapidly gaining ground in clinical practice. Diffusion-weighted and perfusion-weighted (DWI and PWI) magnetic resonance imaging (MRI) provide the ability to depict the penumbra and promise expansion of the therapeutic window for vessel opening on individual cases based on the subsistence of salvageable tissue. Conventional angiography has been transformed from a purely diagnostic test into a means for therapeutic intervention. Even transcranial Doppler may have an important role in the emergent evaluation and management of acute ischemic stroke, providing proof of large intracranial vessel occlusion and possibly improving the chances of recanalization with thrombolysis when continuous insonation is employed.
The uses of various neuroimaging techniques in acute stroke are multiple and continue to expand. The most common current indications and purposes of acute neuroimaging in stroke patients are listed in Table 3-1.
TABLE 3-1 Indications and purposes of emergency neuroimaging in patients with suspected acute ischemic stroke
| Indication/purpose | Imaging modality |
|---|---|
| Confirmation of diagnosis (TIA vs. stroke vs. stroke mimics) | CT/MRI |
| Differentiation of ischemia vs. hemorrhage | CT/MRI |
| Visualization of established infarction (as contraindication for thrombolysis) | CT |
| Localization of ischemia/stroke pattern (which may guide evaluation of stroke mechanism) | CT/MRI |
| Evaluation of penumbra (which may extend therapeutic window for acute revascularization) | DWI-PWI/CTP |
| Identification of early prognostic markers (e.g., HDMCA sign, extensive high ASPECTS score, large volume of DWI restriction) | CT/MRI |
| Visualization of arterial site of occlusion | MRA/CTA/catheter angiography |
| Documentation of recanalization | MRA/CTA/catheter angiography/TCD |
| US-assisted intravenous thrombolysis | TCD |
| Access and information to make endovascular treatment possible | Catheter angiography |
ASPECTS, Alberta Stroke Program Early CT Score; CT, computed tomography; CTA, CT angiography; CTP, CT perfusion; DWI, diffusion-weighted imaging; HDMCA, hyperdense middle cerebral artery; MRA, magnetic resonance angiography; MRI, magnetic resonance imaging; PWI, perfusion-weighted imaging; TCD, transcranial Doppler; TIA, transient ischemic attack; US, ultrasound.
COMPUTED TOMOGRAPHY
CT Signs of Acute Ischemia
A 50-year-old man with a history of hypertension and rapid palpitations presented to the emergency department with acute left hemiparesis. Neurological examination showed right gaze preference, left homonymous hemianopia, left hemiparesis, and left hemineglect. Initial CT scan obtained 5 hours and 20 minutes after symptom onset revealed early signs of edema and infarction throughout the territory of the right middle cerebral artery (Figure 3-1, upper row). Because of the presence of these radiological findings, endovascular revascularization treatments were not attempted. On Day 3, he was more somnolent, and a repeat CT scan showed spontaneous hemorrhage in the area of infarction (Figure 3-1, lower row). The patient was diagnosed with atrial fibrillation, and anticoagulation was subsequently started for secondary stroke prevention. He survived his stroke but remained moderately disabled.
| Sign | Significance |
|---|---|
| Hyperdense vessel sign | Intraluminal thrombus |
| Loss of insular ribbon | Focal tissue edema |
| Obscuration of the lenticular nucleus | Focal tissue edema |
| Loss of gray–white matter distinction | Focal tissue edema |
| Sulcal effacement | Focal tissue edema |
| Areas of hypoattenuation | Tissue infarction |
CT Perfusion
TABLE 3-3 Relative advantages of CT perfusion and DWI-PWI MRI for the assessment of ischemic penumbra.
| CT perfusion |
| Easier access |
| Rapid acquisition of images |
| Robust quantitative physiological measurements |
| Feasible in patients with contraindication for MRI |
| DWI-PWI MRI |
| May be easier to visualize the penumbra |
| Depiction of cellular edema |
| Greater spatial resolution (whole brain imaging) |
| Does not require iodine contrast |
CT, computed tomography; DWI, diffusion-weighted imaging; MRI, magnetic resonance imaging; PWI, perfusion-weighted imaging.
CT Angiogram
MAGNETIC RESONANCE IMAGING
Furthermore, MRI (with DWI and susceptibility weighted sequence) has been proved superior to CT scanning for the detection of acute ischemia and chronic hemorrhage and at least comparable to CT for the diagnosis of acute hemorrhage.36 Thus solid arguments support the use of MRI as the primary imaging modality for the emergency evaluation of acute stroke patients if the study can be performed without delay.
Diffusion-Weighted and Perfusion-Weighted Imaging
TABLE 3-4 Main practical uses of DWI in patients with acute stroke presentation.
| Hyperacute and acute diagnostic confirmation of ischemic stroke |
| Differentiation of acute vs. subacute vs. chronic ischemic lesions |
| Assessment of ischemic penumbra (in combination with PWI) |
| Acute differential diagnosis between TIA and minor stroke with reversible neurological deficits |
| Distinction of cytotoxic and vasogenic edema (in conditions such as eclampsia or hyperperfusion syndrome) |
| Identification of patients at risk of severe reperfusion hemorrhage |
DWI, diffusion-weighted imaging; MRI, magnetic resonance imaging; PWI, perfusion-weighted imaging; TIA, transient ischemic attack.
PWI-DWI Mismatch
[/not-level-membership-for-neurology-category]
