[level-membership-for-pulmolory-and-respiratory-category]
Acid-Base Regulation
After reading this chapter, you will be able to:
• Explain how hydrogen ion concentration [H+] affects cellular enzyme activity
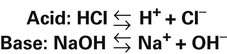
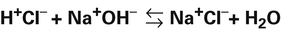
• Define acid and base according to the Brønsted-Lowry classification scheme
• Describe how the strength of an acid and its equilibrium or ionization constant are related
• Explain the relationship between the concept of pH and [H+]
• Explain how isohydric buffering in the blood prevents large pH changes when carbon dioxide (CO2) reacts with water to form carbonic acid
• Show why bicarbonate and nonbicarbonate buffer systems differ in their ability to buffer volatile and fixed acids
• Derive the Henderson-Hasselbalch (H-H) equation from the ionization constant for carbonic acid
• Explain why the body’s open and closed buffer systems differ in their ability to buffer fixed and volatile acids
• Use the H-H equation to predict the change in ventilation required to produce a given arterial pH
• Use the H-H equation to calculate the pH, bicarbonate ion concentration ([< ?xml:namespace prefix = "mml" /> ]), and carbon dioxide pressure (PCO2)
• Use arterial blood gas values to distinguish between primary respiratory and primary metabolic acid-base disturbances
• Predict the body’s compensatory responses to primary respiratory and metabolic acid-base disturbances
• Explain why acute changes in PCO2 affect blood levels of 
Basic Concepts
Importance of Regulating Hydrogen Ions
Strong and Weak Acids and Bases: Equilibrium Constants
 1.
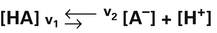
1.In contrast, a weak acid dissociates only partially as the following shows:
 2.
2. 3.
3. 4.
4.In equation 4, KA represents the equilibrium constant for HA. (KA is also known as the acid’s ionization or dissociation constant.) In this example, the weak acid HA has an extremely small KA because the denominator [HA] is quite large with respect to the numerator ([H+] multiplied by [A−]). At a given temperature, the value of KA is always the same for this particular weak acid (HA) regardless of its initial concentration. Each acid has its own unique ionization constant.
 5.
5.As shown by equations 4 and 5, KA indicates an acid’s strength; the greater the value of KA, the stronger the acid—that is, the more completely it dissociates.
Carbonic acid (H2CO3)—the product of the reaction between CO2 and H2O—is often described as a weak acid, when in reality it is a moderately strong acid. In the pH environment of the blood, H2CO3 dissociates instantly and almost completely as soon as it is formed.1 The idea that H2CO3 is a weak acid comes from the fact that the reaction between dissolved CO2 and H2O is quite slow in blood plasma, and from the fact that the sum of dissolved CO2 and H2CO3 is commonly lumped together and treated as the undissociated acid. This practice is sensible because H2CO3 and dissolved CO2 are indistinguishable from one other by chemical analysis (see Chapter 9). Even though H2CO3 is a relatively strong acid, (1) its treatment as being synonymous with dissolved CO2 and (2) its slow formation make it appear to be a weak acid.1
Measuring Hydrogen Ion Concentration: The Concept of pH
 6.
6. 7.
7.Equation 7 can be rearranged to yield the following:
 8.
8.In practical terms, [HOH] is constant because of its extremely slight dissociation. Therefore, the right side of equation 8 can be considered constant:
 9.
9.In equation 9, Kw represents the dissociation constant of water. Equation 8 then becomes the following:
 10.
10. 11.
11.Water’s pH ([H+] = 10−7 mol/L) is calculated as follows:
 12.
12.A pH of 7 corresponds to [H+] of 100 nmol/L:

Because pH is the negative logarithm of [H+], a decrease in pH indicates an increase in [H+] (Box 10-1).
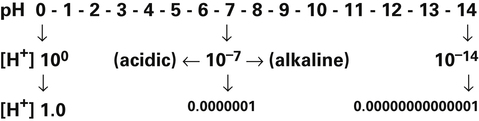
A chemically neutral solution (neither acidic nor basic) has a pH of 7.0. To the chemist, a solution with a pH less than 7.0 is acidic, and a solution with a pH greater than 7.0 is alkaline (see Box 10-1). By this standard, body fluids are slightly alkaline, as the following shows:
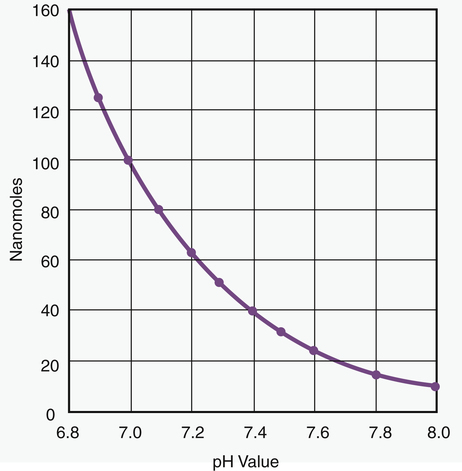
Because pH is a logarithmic scale, a change of one pH unit corresponds to a 10-fold change in [H+] (Figure 10-1). [H+] at a pH of 7.0 (100 nmol/L) is 10 times the [H+] at a pH of 8.0 (10 nmol/L). Figure 10-1 shows that the relationship between pH and [H+] is linear in the normal physiological range of body fluids (pH = 7.35 to 7.45). Table 10-1 shows that in the physiological range, a 1-nmol/L change in [H+] produces a 0.01 change in pH. The pH-to-[H+] relationship maintains some degree of linearity between pH values of 7.20 and 7.55. However, below a pH of 7.20, linearity deteriorates rapidly (see Figure 10-1).
TABLE 10-1
Approximate Relationship between pH and [H+]
| pH | [H+] nmol/L |
| 6.80 | 158 |
| 6.90 | 126 |
| 7.00 | 100 |
| 7.10 | 79 |
| 7.15 | 71 |
| 7.20 | 63 |
| 7.25 | 56 |
| 7.30 | 50 |
| 7.35 | 45 |
| 7.40 | 40 |
| 7.45 | 35 |
| 7.50 | 32 |
| 7.55 | 28 |
| 7.60 | 25 |
| 7.70 | 20 |
| 7.80 | 16 |
| 8.00 | 10 |
Overview of Hydrogen Ion Regulation in Body Fluids
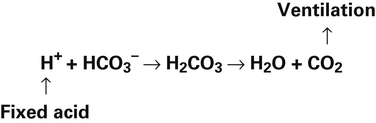
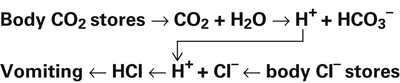
In a process called isohydric buffering,1 most of the hydrogen ions produced cause no pH change at the tissue level because newly forming deoxygenated hemoglobin immediately combines with the hydrogen ions (see Chapter 9). When blood reaches the lungs, hemoglobin releases these hydrogen ions, which combine with plasma bicarbonate ion ( ) to form CO2:
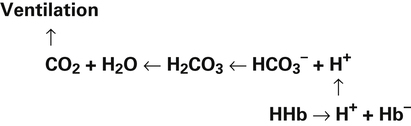
Ventilation eliminates carbonic acid (CO2), keeping pace with its production. Isohydric buffering and ventilation are the two major mechanisms responsible for maintaining a stable pH in the face of massive CO2 production.2
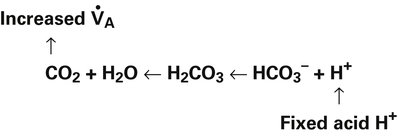
Catabolism of proteins continually produces fixed acids such as sulfuric and phosphoric acids. In addition, anaerobic metabolism produces lactic acid, another fixed acid. In contrast to carbonic acid, these fixed acids are nonvolatile and are not in equilibrium with a gaseous component. Therefore, the hydrogen ions of fixed acids must be buffered by bases in the body or eliminated in the urine by the kidneys. Compared with daily CO2 production, fixed acid production is small, averaging only about 50 to 70 mEq per day.3 Certain diseases, such as untreated diabetes, increase fixed acid production. The resulting hydrogen ions stimulate the respiratory centers in the brain, increasing ventilation and CO2 elimination, pulling the CO2 hydration reaction to the left:
Body Buffer Systems
Function of a Buffer


Bicarbonate and Nonbicarbonate Buffer Systems


Table 10-2 summarizes the characteristics and components of bicarbonate and nonbicarbonate buffer systems.
TABLE 10-2
Classification of Whole Blood Buffers
| Open System | Closed System |
| Bicarbonate | Nonbicarbonate |
| Plasma | Hemoglobin |
| Erythrocyte | Organic phosphates |
| Inorganic phosphates | |
| Plasma proteins |
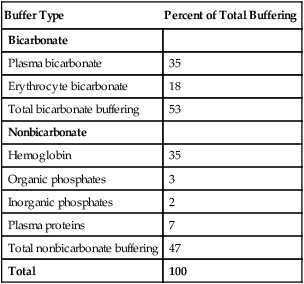
Open and closed buffer systems differ in their ability to buffer fixed and volatile acids. They also differ in their ability to function in wide-ranging pH environments. Both systems are physiologically important, each playing a unique and essential role in maintaining pH homeostasis. Table 10-3 summarizes the approximate contributions of various blood buffers to the total buffer base. The bicarbonate buffer system has the greatest buffering capacity because it is an open system.
TABLE 10-3
Individual Buffer Contributions to Whole Blood Buffering
| Buffer Type | Percent of Total Buffering |
| Bicarbonate | |
| Plasma bicarbonate | 35 |
| Erythrocyte bicarbonate | 18 |
| Total bicarbonate buffering | 53 |
| Nonbicarbonate | |
| Hemoglobin | 35 |
| Organic phosphates | 3 |
| Inorganic phosphates | 2 |
| Plasma proteins | 7 |
| Total nonbicarbonate buffering | 47 |
| Total | 100 |
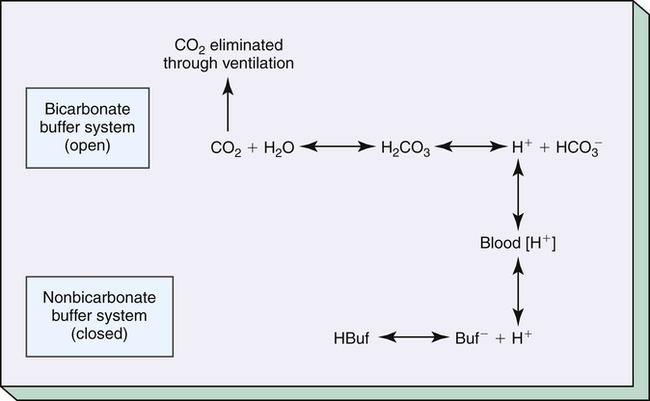
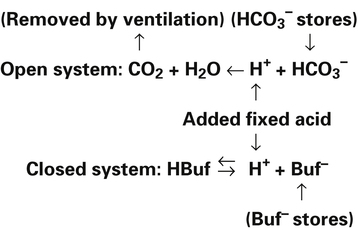
Bicarbonate and nonbicarbonate buffer systems do not function in isolation from one another; they are intermingled in the same solution (whole blood) and are in equilibrium with the same [H+] (Figure 10-2). As Figure 10-2 shows, increased ventilation increases the CO2 removal rate, ultimately causing nonbicarbonate buffers (HBuf) to release H+. Conversely, cessation of ventilation reverses the reaction; CO2 builds up, more H+ is generated, and, ultimately, more HBuf is formed.
pH of a Buffer System and Henderson-Hasselbalch Equation

The equilibrium constant (KA) for H2CO3 is as follows:
[H+] can be isolated through the following algebraic rearrangement of this equation:

Henderson-Hasselbalch Equation
The foregoing concept is the basis for the Henderson-Hasselbalch (H-H) equation. The H-H equation is specific for calculating the pH of the blood’s bicarbonate buffer system, which is the same as the pH of the plasma. That is, because all buffer systems in the blood are in equilibrium with the same pH, the pH of any one buffer system is equal to the pH of the entire plasma solution (the isohydric principle).2
The H-H equation is derived from the equilibrium constant for H2CO3:
To express [H+] in terms of pH, the logarithm of both sides of the equation is determined:

This equation is algebraically equivalent to the following:

Multiplying both sides of the equation by −1 produces the following:
The H-H equation substitutes dissolved CO2 (PCO2 × 0.03 mmol/L/mm Hg) for [H2CO3]. This is legitimate because dissolved CO2 is in equilibrium with and directly proportional to the blood’s [H2CO3], as explained in Chapter 9. In contrast to H2CO3, dissolved CO2 is easily calculated from the blood’s carbon dioxide pressure (PCO2). For these reasons, dissolved CO2 is treated as though it were the acid instead of H2CO3. The H-H equation is as follows:


Clinical Use of Henderson-Hasselbalch Equation


The different forms of the H-H equation needed to calculate pH, PCO2, and  are shown in Box 10-2.
BOX 10-2 Using the Henderson-Hasselbalch Equation


In mechanically ventilated patients, it also may be clinically useful to predict the effect that a change in tidal volume or rate (minute ventilation) would have on the arterial pH. In other words, the predicted PaCO2 that would result from a change in ventilation can be calculated and “plugged in” to the H-H equation to compute the new projected pH (see Clinical Focus 10-2).
Buffer Strength
The strength of a buffer solution is determined by measuring the number of hydrogen ions that must be added to or taken away from the solution to change its pH by one unit. A buffer solution’s strength varies, depending on its initial pH, before hydrogen ions are added or subtracted. A given buffer solution has its own unique pH range in which it most effectively resists pH changes. The titration curve for the bicarbonate buffer system,  /(PCO2 × 0.03), illustrates this point (Figure 10-3).
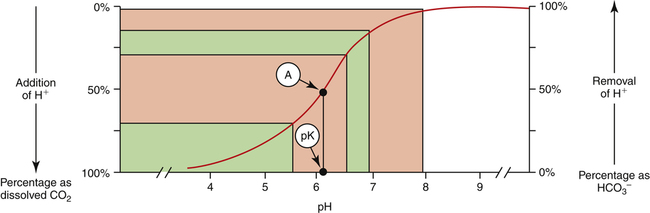
This titration curve shows the degree to which pH changes when hydrogen ions are added to or subtracted from a bicarbonate buffer solution. The upper right side of the graph shows a hypothetical condition in which the solution’s concentration of  is 100% and that of dissolved CO2 is 0% (i.e., no H+ ions exist in this imaginary solution). As H+ ions are added to the solution, the pH decreases rapidly at first. The amount of H+ needed to change the buffer solution’s pH one unit, from 7.9 to 6.9, is represented by the width of the orange-shaded band at the upper left corner of the graph. Progressively greater amounts of H+ are required to reduce the pH by one unit as the buffer solution’s pH decreases. As H+ ions are added, the decrease in the buffer solution’s pH follows the S-shaped titration curve (see Figure 10-3) from right to left. The curve is steepest when the buffer solution contains 50% dissolved CO2 and 50%
  , which corresponds to a solution pH of 6.1. At this point, the solution’s ability to resist a pH change is at its maximum. A relatively large amount of H+ must be added to decrease the solution’s pH by one unit, from 6.5 to 5.5; it takes a much smaller amount of H+ to cause the pH to decrease from 7.9 to 6.9. (Compare the widths of the orange-shaded bands on the left side of the graph.) The buffer solution’s pH at its maximal buffering power (point A on the steepest part of the titration curve) is known as the pK, which is 6.1 for the
  /dissolved CO2 system. A given buffer solution is most effective in resisting pH changes when it operates in a pH environment near its pK.
Physiological Importance of Bicarbonate Buffer System


To understand the effectiveness of the open bicarbonate buffer system in the body, it is helpful to visualize what would happen if this system were closed, as illustrated in Figure 10-4. In this figure, containers A and B have a bicarbonate buffer dissolved in 1 L of solution. Initially, the buffer solution has  and dissolved CO2 concentrations equal to the concentrations of normal blood plasma, and the pH is 7.40, according to the H-H equation (see Figure 10-4, A). When 12 mM of a strong acid (HCl) is added, 12 mM of
  is converted to 12 mM of CO2, which decreases the
  concentration from 24 mM to 12 mM and increases the dissolved CO2 from 1.2 mM to 13.2 mM (see Figure 10-4, B). Because the CO2 produced by this reaction cannot escape from the system, the denominator of the H-H equation (dissolved CO2) is increased, causing pH to decrease to 6.06 (see Figure 10-4, B).
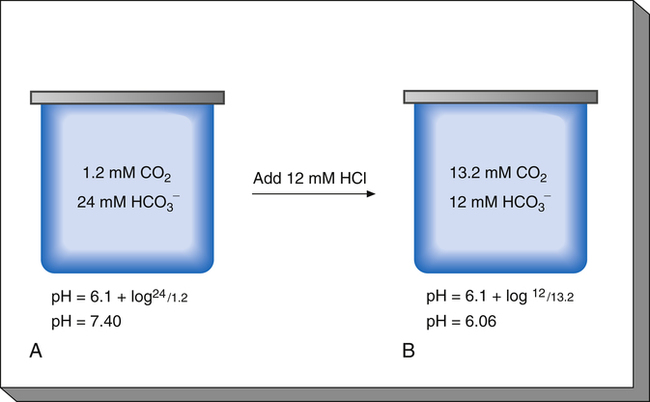
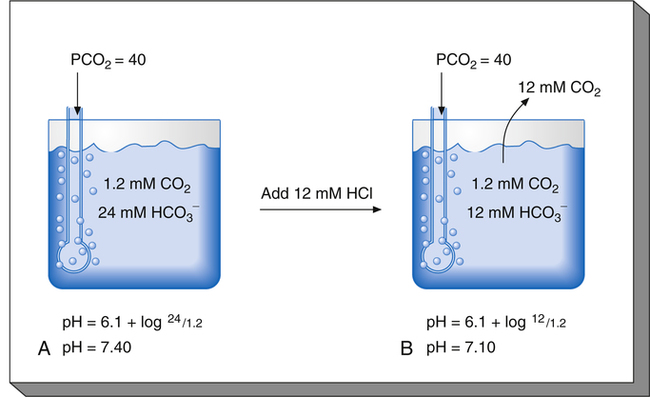
Figure 10-5 illustrates why the open bicarbonate buffer system is more effective in resisting pH changes produced by the addition of 12 mM of HCl. To simulate normal ventilation, a gas with a PCO2 of 40 mm Hg is continuously bubbled through the bicarbonate buffer solution in Figure 10-5. This keeps the PCO2 of the solution at 40 mm Hg, and keeps the dissolved CO2 concentration constant at 1.2 mM/L (40 mm Hg × 0.03 = 1.2 mM/L). Figure 10-5, A, represents normal plasma values for  , dissolved CO2, and pH. As in the closed system (see Figure 10-4), adding 12 mM of HCl converts an equal amount of
  to dissolved CO2.
  decreases from 24 mM to 12 mM, but the simultaneously generated 12 mM of CO2 is bubbled out of the solution to the atmosphere (see Figure 10-5, B). This keeps the denominator of the H-H equation (dissolved CO2) constant at 1.2 mM/L. As shown in Figure 10-5, B, the pH decreased to only 7.07 because CO2 cannot build up in the solution, as it did in the closed system. Thus, the bicarbonate buffer system is effective in buffering fixed acid even though it operates in a pH environment of 7.40 rather than its pK of 6.1. However, the effectiveness of the bicarbonate buffering system depends on the ability of the lungs to produce adequate ventilation.
Physiological Roles of Bicarbonate and Nonbicarbonate Buffer Systems
The functions of bicarbonate and nonbicarbonate buffer systems are summarized in Table 10-4.
TABLE 10-4
| Buffer | Type of System | Acids Buffered |
| Bicarbonate | Open | Fixed (nonvolatile) |
| Nonbicarbonate | Closed | Volatile (carbonic) |
| Fixed |


Nonbicarbonate Buffer System
Table 10-3 lists the nonbicarbonate buffers in the blood. Of these, hemoglobin is the most important because it is the most abundant. These buffers are the only ones available to buffer carbonic acid. However, they can buffer H+ produced by any acid, fixed or volatile. Because nonbicarbonate buffers (HBuf/Buf−) function in closed systems, the products of their buffering activity build up, slowing or stopping further buffering activity:


Most of the added fixed acid is buffered by  because increased ventilation continually pulls the reaction to the left. Smaller amounts of H+ react with Buf− because equilibrium is approached, slowing this reaction. Although all
  could theoretically be depleted in buffering fixed acids, this never happens because metabolically produced CO2 provides a continual source of
  ; that is, at the tissue level, CO2 diffuses into the erythrocyte where it reacts with H2O to form H+ and
  ; hemoglobin’s subsequent buffering of H+ causes
  to be continuously generated, as described in Chapter 9.
Acid Excretion
Lungs
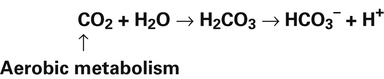
Normal oxidative (aerobic) metabolism produces CO2, forming more than 10,000 mEq of H2CO3 per day.4 Because H2CO3
CLINICAL FOCUS 10-2 Using the Henderson-Hasselbalch Equation to Predict Arterial pH for a Given Change in Arterial Carbon Dioxide Pressure


A PaCO2 of 62 mm Hg will produce a pH of about 7.25.∗
Next,  E required to produce a PaCO2 of 62 mm Hg must be calculated. Chapter 9 indicated that
  E is inversely proportional to PaCO2, as the following equation shows:


∗This calculation is an oversimplification because of the CO2 hydration effect: An increased PaCO2 causes a small increase in [HCO3−]. A decrease in VT without changing the respiratory rate would directly decrease alveolar ventilation without affecting anatomical dead space ventilation; this would increase the VD/VT ratio, resulting in a higher PaCO2 than predicted by this calculation.
is in equilibrium with dissolved CO2, the lungs can lower blood H2CO3 concentration by eliminating CO2 in exhaled gas. Neurochemical mechanisms control ventilation in such a way that CO2 elimination matches CO2 production while keeping PaCO2 and pH near 40 mm Hg and 7.40.


Kidneys (Renal System)
The kidneys physically remove hydrogen ions from the body; the amount eliminated depends on the blood level of hydrogen ions—the higher the blood levels, the more hydrogen ions excreted. Blood hydrogen ions may originate from H2CO3 (when PaCO2 is high) or from a buildup of fixed acids. The kidneys excrete less than 100 mEq of fixed acid per day, a relatively small amount compared with the lung’s excretion of volatile H2CO3. Besides excreting H+, the kidneys also influence blood pH by reabsorbing  from the filtrate into the blood or by eliminating
  in the urine. If PaCO2 is high (creating high levels of H2CO3), the kidneys not only excrete greater amounts of H+, but they also return all of the kidney filtrate’s
  to the blood. The opposite happens when PaCO2 is low—the kidneys excrete less H+ but more
  . In this way, the kidneys work to maintain a normal blood pH when the lungs fail to maintain normal CO2 levels. Compared with the lung’s ability to change the PaCO2 in seconds, the renal process is slow, requiring hours to days. Renal regulation of acid-base and electrolyte balance is discussed in detail in Chapter 22.
Acid-Base Disturbances


Primary Metabolic (Nonrespiratory) Disturbances


Processes that increase the arterial pH by losing fixed acid or gaining  produce a condition called metabolic alkalosis. Because
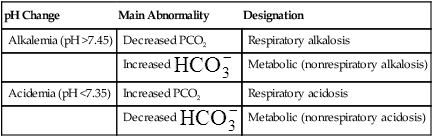
  can be added or lost through mechanisms not related to metabolism (alkali ingestion or vomiting), the term metabolic acidosis is misleading. Similarly, acid not produced by metabolism (e.g., salicylic acid [aspirin]) can be ingested, producing so-called metabolic acidosis. The term metabolic has been entrenched by tradition and continues to be used. Table 10-5 shows the four primary acid-base disturbances causing alkalemia and acidemia.
TABLE 10-5
Primary Acid-Base Disturbances
| pH Change | Main Abnormality | Designation |
| Alkalemia (pH >7.45) | Decreased PCO2 | Respiratory alkalosis |
Increased  |
Metabolic (nonrespiratory alkalosis) | |
| Acidemia (pH <7.35) | Increased PCO2 | Respiratory acidosis |
Decreased  |
Metabolic (nonrespiratory acidosis) |
Compensation: Restoring pH to Normal


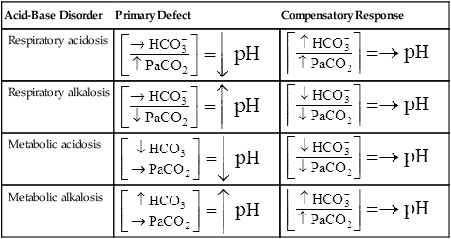
The lungs normally compensate quickly for metabolic acid-base defects because ventilation can change PaCO2 in seconds. The kidneys require more time to retain or excrete significant amounts of  , and they compensate for respiratory defects at a much slower pace. Table 10-6 summarizes the four primary acid-base disturbances and the body’s compensatory responses. (Primary and compensatory responses appear in bold font.)
TABLE 10-6
Primary Acid-Base Disorders and Compensatory Responses
| Acid-Base Disorder | Primary Defect | Compensatory Response |
| Respiratory acidosis |  |
 |
| Respiratory alkalosis |  |
 |
| Metabolic acidosis |  |
 |
| Metabolic alkalosis |  |
 |
Effect of Carbon Dioxide Hydration Reaction on Bicarbonate Ion Concentration
In the foregoing examples of pure (uncompensated) respiratory acidosis and alkalosis, it was assumed that [ ] did not change when PaCO2 increased or decreased. This simplification was made to emphasize that PaCO2, not
  , is the primary abnormality in respiratory acidosis or alkalosis. However, arterial [
 ] does slightly increase as PaCO2 increases secondary to
  generation in the erythrocyte through the hydration reaction. As explained in Chapter 9, the hydration reaction occurs primarily in the red blood cell because the catalytic enzyme carbonic anhydrase is present. This is shown as follows:


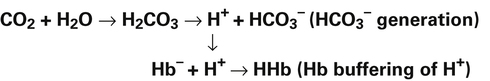


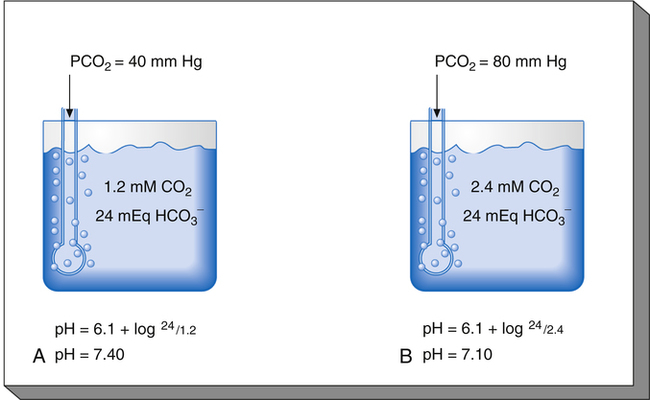
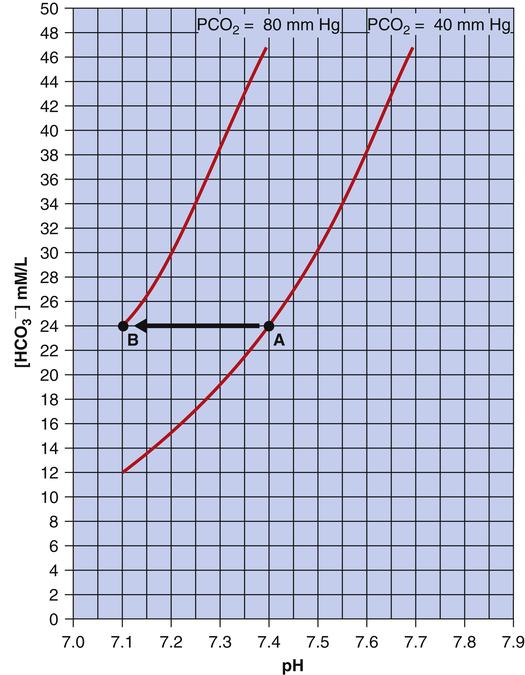
Figure 10-6 illustrates what would happen if the blood contained no nonbicarbonate buffers. In Figure 10-6, A, the solution’s PCO2 is 40 mm Hg, the [ ] is 24 mEq/L, and the pH is 7.40. If the PCO2 of gas bubbling through the solution suddenly increases to 80 mm Hg (see Figure 10-6, B), dissolved CO2 (PCO2 × 0.03) increases to 2.4 mM/L, and the pH decreases to 7.10. These events are recorded on the pH-[
 ] diagram in Figure 10-7. The conditions shown in Figure 10-6, A, are represented by point A on the pH-[
 ] diagram. (The curved lines are PCO2 isobars, constructed by maintaining the PCO2 of the gas bubbling through the solution constant while adding or subtracting a strong acid.) [
 ] did not change when the PCO2 increased to 80 mm Hg (from point A to point B in Figure 10-7). The lack of a perceptible change might seem odd because an increase in PCO2 from 40 mm Hg to 80 mm Hg would double the H2CO3 concentration, which means that [
 ] would increase to some extent when H2CO3 dissociates into bicarbonate and hydrogen ions. Any such increase in bicarbonate ions would have to be equal to the increase in hydrogen ions because each molecule of H2CO3 produces one H+ and one
  . As estimated from the decrease in pH from 7.40 to 7.10, the increase in [H+] is about 40 nmol/L (see Table 10-1), which means that the [
 ] would also increase by about 40 nmol/L. This minuscule increase in [
 ] cannot be accurately measured or plotted on the pH-[
 ] diagram in Figure 10-7 and can be ignored.
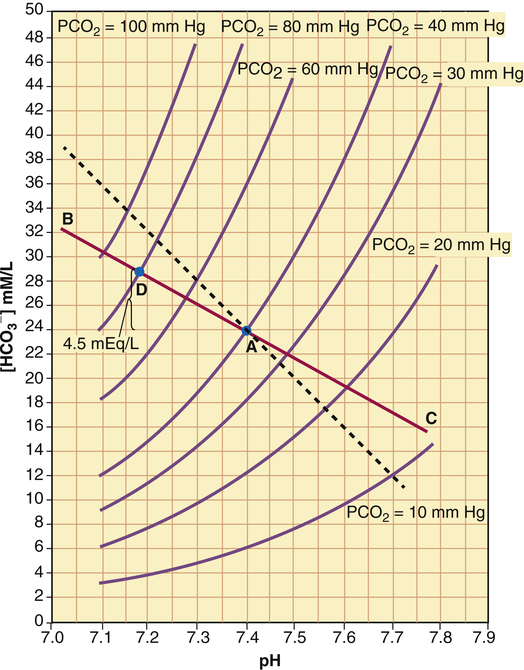
The reason [ ] did not increase perceptibly in the example just described is that nonbicarbonate buffers were not present to accept the H+ produced by the hydration reaction. In whole blood, nonbicarbonate buffers are plentiful. As described earlier, when they buffer H+,
  is generated. Figure 10-8 is a pH-[
 ] diagram for whole blood. A normal status is represented by point A (PCO2 of 40 mm Hg, pH of 7.40, and plasma [
 ] of 24 mEq/L). An acute increase in PCO2 to 80 mm Hg proceeds along the nonbicarbonate blood buffer line (BAC) to point D, where the buffer line intersects the 80-mm Hg PCO2 isobar. Point D indicates an increase in [
 ] of about 4.5 mEq/L, which is exactly the same as the amount of H+ buffered by nonbicarbonate buffers. This corresponds to a pH of 7.18 compared with the pH of 7.10 in Figure 10-7, in which nonbicarbonate buffers are absent. The slope of BAC is a measure of the amount of nonbicarbonate buffer present; the slope is steeper if greater amounts of nonbicarbonate buffer are present. For example, if hemoglobin concentration increases, an acute increase in PCO2 from point A (see Figure 10-8) to 80 mm Hg proceeds along a steeper line (dashed line); at the 80-mm Hg PCO2 isobar, [
 ] and pH are higher because hemoglobin buffered greater amounts of H+.


[/level-membership-for-pulmolory-and-respiratory-category][not-level-membership-for-pulmolory-and-respiratory-category]
Acid-Base Regulation
After reading this chapter, you will be able to:
• Explain how hydrogen ion concentration [H+] affects cellular enzyme activity
• Define acid and base according to the Brønsted-Lowry classification scheme
• Describe how the strength of an acid and its equilibrium or ionization constant are related
• Explain the relationship between the concept of pH and [H+]
• Explain how isohydric buffering in the blood prevents large pH changes when carbon dioxide (CO2) reacts with water to form carbonic acid
• Show why bicarbonate and nonbicarbonate buffer systems differ in their ability to buffer volatile and fixed acids
• Derive the Henderson-Hasselbalch (H-H) equation from the ionization constant for carbonic acid
• Explain why the body’s open and closed buffer systems differ in their ability to buffer fixed and volatile acids
• Use the H-H equation to predict the change in ventilation required to produce a given arterial pH
• Use the H-H equation to calculate the pH, bicarbonate ion concentration ([< ?xml:namespace prefix = "mml" />]), and carbon dioxide pressure (PCO2)
• Use arterial blood gas values to distinguish between primary respiratory and primary metabolic acid-base disturbances
• Predict the body’s compensatory responses to primary respiratory and metabolic acid-base disturbances
• Explain why acute changes in PCO2 affect blood levels of
Basic Concepts
Importance of Regulating Hydrogen Ions
Strong and Weak Acids and Bases: Equilibrium Constants
1.In contrast, a weak acid dissociates only partially as the following shows:
2. 3. 4.In equation 4, KA represents the equilibrium constant for HA. (KA is also known as the acid’s ionization or dissociation constant.) In this example, the weak acid HA has an extremely small KA because the denominator [HA] is quite large with respect to the numerator ([H+] multiplied by [A−]). At a given temperature, the value of KA is always the same for this particular weak acid (HA) regardless of its initial concentration. Each acid has its own unique ionization constant.
5.As shown by equations 4 and 5, KA indicates an acid’s strength; the greater the value of KA, the stronger the acid—that is, the more completely it dissociates.
Carbonic acid (H2CO3)—the product of the reaction between CO2 and H2O—is often described as a weak acid, when in reality it is a moderately strong acid. In the pH environment of the blood, H2CO3 dissociates instantly and almost completely as soon as it is formed.1 The idea that H2CO3 is a weak acid comes from the fact that the reaction between dissolved CO2 and H2O is quite slow in blood plasma, and from the fact that the sum of dissolved CO2 and H2CO3 is commonly lumped together and treated as the undissociated acid. This practice is sensible because H2CO3 and dissolved CO2 are indistinguishable from one other by chemical analysis (see Chapter 9). Even though H2CO3 is a relatively strong acid, (1) its treatment as being synonymous with dissolved CO2 and (2) its slow formation make it appear to be a weak acid.1
Measuring Hydrogen Ion Concentration: The Concept of pH
6. 7.Equation 7 can be rearranged to yield the following:
8.In practical terms, [HOH] is constant because of its extremely slight dissociation. Therefore, the right side of equation 8 can be considered constant:
9.In equation 9, Kw represents the dissociation constant of water. Equation 8 then becomes the following:
10. 11.Water’s pH ([H+] = 10−7 mol/L) is calculated as follows:
12.A pH of 7 corresponds to [H+] of 100 nmol/L:
Because pH is the negative logarithm of [H+], a decrease in pH indicates an increase in [H+] (Box 10-1).
A chemically neutral solution (neither acidic nor basic) has a pH of 7.0. To the chemist, a solution with a pH less than 7.0 is acidic, and a solution with a pH greater than 7.0 is alkaline (see Box 10-1). By this standard, body fluids are slightly alkaline, as the following shows:
Because pH is a logarithmic scale, a change of one pH unit corresponds to a 10-fold change in [H+] (Figure 10-1). [H+] at a pH of 7.0 (100 nmol/L) is 10 times the [H+] at a pH of 8.0 (10 nmol/L). Figure 10-1 shows that the relationship between pH and [H+] is linear in the normal physiological range of body fluids (pH = 7.35 to 7.45). Table 10-1 shows that in the physiological range, a 1-nmol/L change in [H+] produces a 0.01 change in pH. The pH-to-[H+] relationship maintains some degree of linearity between pH values of 7.20 and 7.55. However, below a pH of 7.20, linearity deteriorates rapidly (see Figure 10-1).
TABLE 10-1
Approximate Relationship between pH and [H+]
| pH | [H+] nmol/L |
| 6.80 | 158 |
| 6.90 | 126 |
| 7.00 | 100 |
| 7.10 | 79 |
| 7.15 | 71 |
| 7.20 | 63 |
| 7.25 | 56 |
| 7.30 | 50 |
| 7.35 | 45 |
| 7.40 | 40 |
| 7.45 | 35 |
| 7.50 | 32 |
| 7.55 | 28 |
| 7.60 | 25 |
| 7.70 | 20 |
| 7.80 | 16 |
| 8.00 | 10 |
Overview of Hydrogen Ion Regulation in Body Fluids
In a process called isohydric buffering,1 most of the hydrogen ions produced cause no pH change at the tissue level because newly forming deoxygenated hemoglobin immediately combines with the hydrogen ions (see Chapter 9). When blood reaches the lungs, hemoglobin releases these hydrogen ions, which combine with plasma bicarbonate ion () to form CO2:
Ventilation eliminates carbonic acid (CO2), keeping pace with its production. Isohydric buffering and ventilation are the two major mechanisms responsible for maintaining a stable pH in the face of massive CO2 production.2
Catabolism of proteins continually produces fixed acids such as sulfuric and phosphoric acids. In addition, anaerobic metabolism produces lactic acid, another fixed acid. In contrast to carbonic acid, these fixed acids are nonvolatile and are not in equilibrium with a gaseous component. Therefore, the hydrogen ions of fixed acids must be buffered by bases in the body or eliminated in the urine by the kidneys. Compared with daily CO2 production, fixed acid production is small, averaging only about 50 to 70 mEq per day.3 Certain diseases, such as untreated diabetes, increase fixed acid production. The resulting hydrogen ions stimulate the respiratory centers in the brain, increasing ventilation and CO2 elimination, pulling the CO2 hydration reaction to the left:
Body Buffer Systems
Function of a Buffer
Bicarbonate and Nonbicarbonate Buffer Systems
Table 10-2 summarizes the characteristics and components of bicarbonate and nonbicarbonate buffer systems.
TABLE 10-2
Classification of Whole Blood Buffers
| Open System | Closed System |
| Bicarbonate | Nonbicarbonate |
| Plasma | Hemoglobin |
| Erythrocyte | Organic phosphates |
| Inorganic phosphates | |
| Plasma proteins |
Open and closed buffer systems differ in their ability to buffer fixed and volatile acids. They also differ in their ability to function in wide-ranging pH environments. Both systems are physiologically important, each playing a unique and essential role in maintaining pH homeostasis. Table 10-3 summarizes the approximate contributions of various blood buffers to the total buffer base. The bicarbonate buffer system has the greatest buffering capacity because it is an open system.
TABLE 10-3
Individual Buffer Contributions to Whole Blood Buffering
| Buffer Type | Percent of Total Buffering |
| Bicarbonate | |
| Plasma bicarbonate | 35 |
| Erythrocyte bicarbonate | 18 |
| Total bicarbonate buffering | 53 |
| Nonbicarbonate | |
| Hemoglobin | 35 |
| Organic phosphates | 3 |
| Inorganic phosphates | 2 |
| Plasma proteins | 7 |
| Total nonbicarbonate buffering | 47 |
| Total | 100 |
Bicarbonate and nonbicarbonate buffer systems do not function in isolation from one another; they are intermingled in the same solution (whole blood) and are in equilibrium with the same [H+] (Figure 10-2). As Figure 10-2 shows, increased ventilation increases the CO2 removal rate, ultimately causing nonbicarbonate buffers (HBuf) to release H+. Conversely, cessation of ventilation reverses the reaction; CO2 builds up, more H+ is generated, and, ultimately, more HBuf is formed.
