4
Abnormalities of P waves, QRS complexes and T waves
When interpreting an ECG, identify the rhythm first. Then ask the following questions – always in the same sequence:
1. Are there any abnormalities of the P wave?
2. What is the direction of the cardiac axis? (Look at the QRS complex in leads I, II and III – and at Ch. 1 if necessary.)
3. Is the QRS complex of normal duration?
4. Are there any abnormalities in the QRS complex – particularly, are there any abnormal Q waves?
1. The P wave can only be normal, unusually tall or unusually broad.
2. The QRS complex can only have three abnormalities – it can be too broad or too tall, and it may contain an abnormal Q wave.
3. The ST segment can only be normal, elevated or depressed.
4. The T wave can only be the right way up or the wrong way up.
ABNORMALITIES OF THE P WAVE
Apart from alterations of the shape of the P wave associated with rhythm changes, there are only two important abnormalities:
ABNORMALITIES OF THE QRS COMPLEX
The normal QRS complex has four characteristics:
1. Its duration is no greater than 120 ms (three small squares).
2. In a right ventricular lead (Vj), the S wave is greater than the R wave.
3. In a left ventricular lead (V5 or V6), the height of the R wave is less than 25 mm.
4. Left ventricular leads may show Q waves due to septal depolarization, but these are less than 1 mm across and less than 2 mm deep.
ABNORMALITIES OF THE WIDTH OF THE QRS COMPLEX
QRS complexes are abnormally wide in the presence of bundle branch block (see Ch. 2), or when depolarization is initiated by a focus in the ventricular muscle causing ventricular escape beats, extrasystoles or tachycardia (see Ch. 3). In each case, the increased width indicates that depolarization has spread through the ventricles by an abnormal and therefore slow pathway. The QRS complex is also wide in the Wolff-Parkinson-White syndrome (see p. 79, Ch. 3).
INCREASED HEIGHT OF THE QRS COMPLEX
Right ventricular hypertrophy
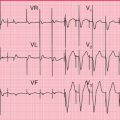
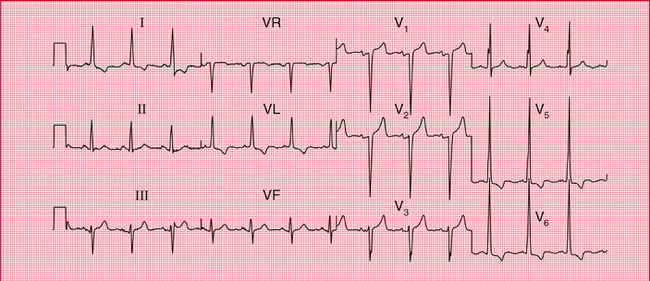
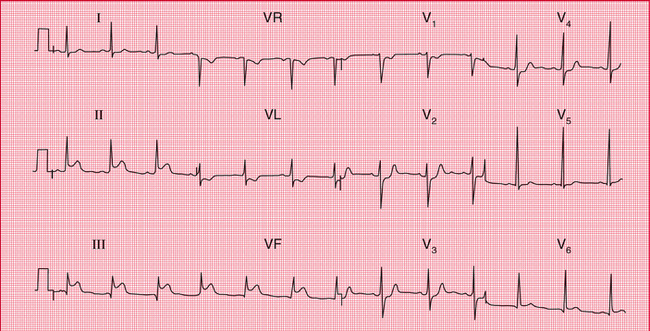
Right ventricular hypertrophy is best seen in the right ventricular leads (especially V1. Since the left ventricle does not have its usual dominant effect on the QRS shape, the complex in lead becomes upright (i.e. the height of the R wave exceeds the depth of the S wave) – this is nearly always abnormal ( Fig. 4.3). There will also be a deep S wave in lead V6.
Right ventricular hypertrophy is usually accompanied by right axis deviation (see Ch. 1), by a peaked P wave (right atrial hypertrophy), and in severe cases by inversion of the T waves in leads V1 and V2, and sometimes in lead V3 or even V4 ( Fig. 4.4).
Pulmonary embolism
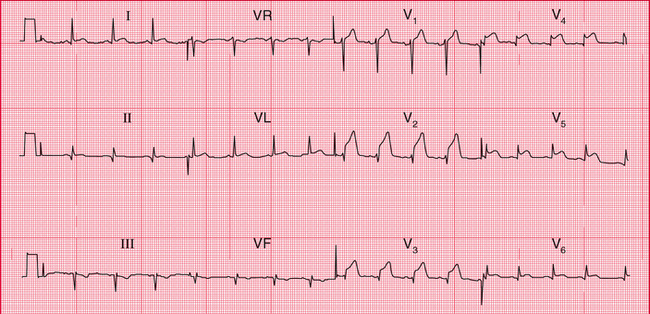
In pulmonary embolism the ECG may show features of right ventricular hypertrophy ( Fig. 4.5), although in many cases there is nothing abnormal other than sinus tachycardia. When a pulmonary embolus is suspected, look for any of the following:
2. Right axis deviation (S waves in lead I).
5. Inverted T waves in lead V1 (normal), spreading across to lead V2 or V3.
6. A shift of transition point to the left, so that the R wave equals the S wave in lead V5 or V6 rather than in lead V3 or V4 (clockwise rotation). A deep S wave will persist in lead V6.
7. Curiously, a ‘Q’ wave in lead III resembling an inferior infarction (see below).
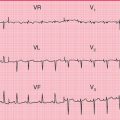
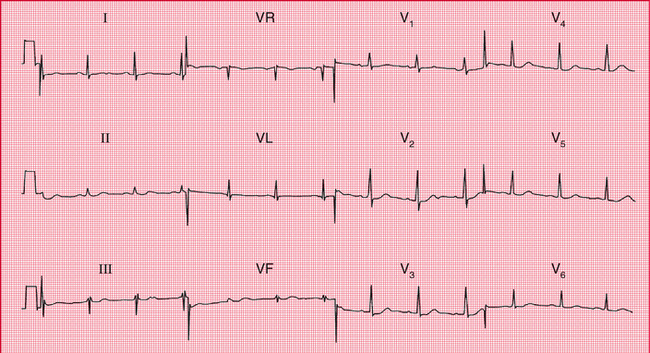
Left ventricular hypertrophy
Left ventricular hypertrophy causes a tall R wave (greater than 25 mm) in lead V5 or V6 and a deep S wave in lead V1 or V2 ( Fig. 4.6) – but in practice such ‘voltage’ changes alone are unhelpful in diagnosing left ventricular enlargement. With significant hypertrophy, there are also inverted T waves in leads I, VL, V5 and V6, and sometimes V4, and there may be left axis deviation. It is difficult to diagnose minor degrees of left ventricular hypertrophy from the ECG.
THE ORIGIN OF Q WAVES
Small (septal) ‘Q’ waves in the left ventricular leads result from depolarization of the septum from left to right (see Ch. 1). However, Q waves greater than one small square in width (representing 40 ms) and greater than 2 mm in depth have a quite different significance.
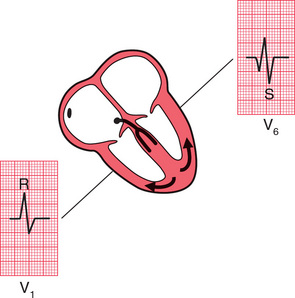
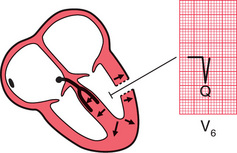
The ventricles are depolarized from inside outwards ( Fig. 4.7). Therefore, an electrode placed in the cavity of a ventricle would record only a Q wave, because all the depolarization waves would be moving away from it. If a myocardial infarction causes complete death of muscle from the inside surface to the outside surface of the heart, an electrical ‘window’ is created, and an electrode looking at the heart over that window will record a cavity potential – that is, a Q wave.
Q waves greater than one small square in width and at least 2 mm deep therefore indicate a myocardial infarction, and the leads in which the Q wave appears give some indication of the part of the heart that has been damaged. Thus, infarction of the anterior wall of the left ventricle causes a Q wave in the leads looking at the heart from the front – V2-V4 or V <; ( Fig. 4.8) (see Ch. 1).
If the infarction involves both the anterior and lateral surfaces of the heart, a Q wave will be present in leads V3 and V4 and in the leads that look at the lateral surface – I, VL and V5-V6 ( Fig. 4.9).
Infarctions of the inferior surface of the heart cause Q waves in the leads looking at the heart from below – III and VF ( Figs 4.8 and 4.10).
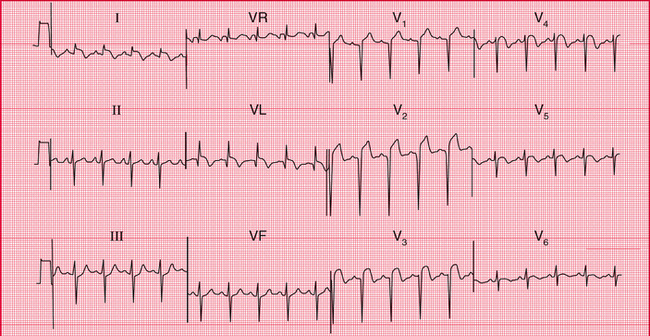
When the posterior wall of the left ventricle is infarcted, a different pattern is seen ( Fig. 4.11). The right ventricle occupies the front of the heart anatomically, and normally depolarization of the right ventricle (moving towards the recording electrode V^ is overshadowed by depolarization of the left ventricle (moving away from Vi). The result is a dominant S wave in lead Vl. With infarction of the posterior wall of the left ventricle, depolarization of the right ventricle is less opposed by left ventricular forces, and so becomes more obvious, and a dominant R wave develops in lead V1. The appearance of the ECG is similar to that of right ventricular hypertrophy, though the other changes of right ventricular hypertrophy (see above) do not appear.
 For more on myocardial infarction, see pp. 214-241
ABNORMALITIES OF THE ST SEGMENT
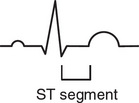
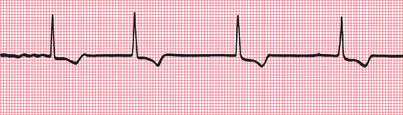
The ST segment lies between the QRS complex and the T wave ( Fig. 4.12). It should be ‘isoelectric’ – that is, at the same level as the part between the T wave and the next P wave – but it may be elevated ( Fig. 4.13a) or depressed ( Fig. 4.13b).
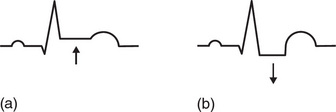
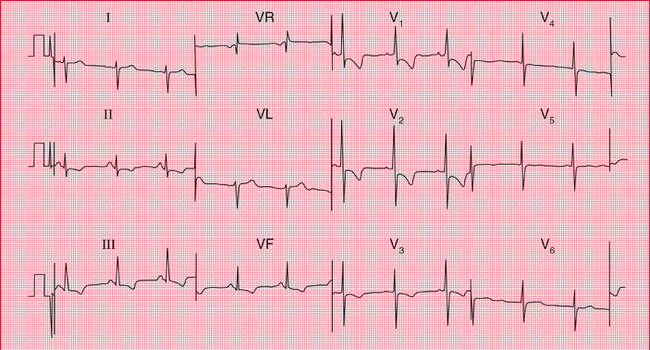
Elevation of the ST segment is an indication of acute myocardial injury, usually due either to a recent infarction or to pericarditis. The leads in which the elevation occurs indicate the part of the heart that is damaged – anterior damage shows in the V leads, and inferior damage in leads III and VF (see Figs 4.8 and 4.10). Pericarditis is not usually a localized affair, and so it causes ST elevation in most leads.
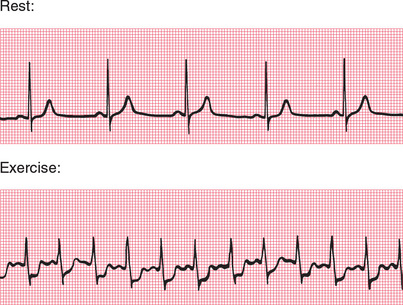
Horizontal depression of the ST segment, associated with an upright T wave, is usually a sign of ischaemia as opposed to infarction. When the ECG at rest is normal, ST segment depression may appear during exercise, particularly when effort induces angina ( Fig. 4.14).
ABNORMALITIES OF THE T WAVE
INVERSION OF THE T WAVE
The T wave is normally inverted in leads VR and V1, sometimes in leads III and V2, and also in lead V3 in some black people.
MYOCARDIAL INFARCTION
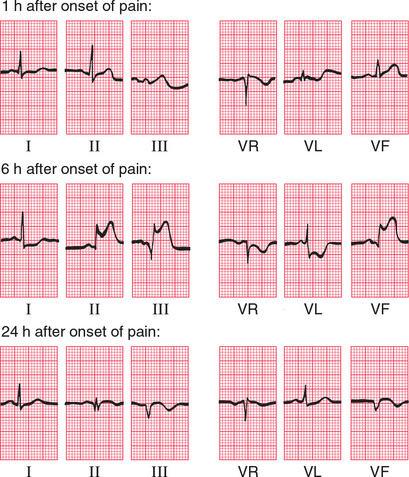
After a myocardial infarction, the first abnormality seen on the ECG is elevation of the ST segment ( Fig. 4.15). Subsequently, Q waves appear, and the T waves become inverted. The ST segment returns to the baseline, the whole process taking a variable time but usually within the range 24–48 h. T wave inversion is often permanent. Infarctions causing this pattern of ECG changes are called ‘ST segment elevation myocardial infarctions’ (STEMIs) (see p. 130).
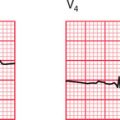
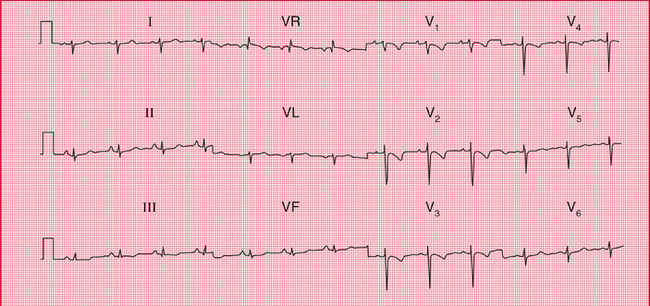
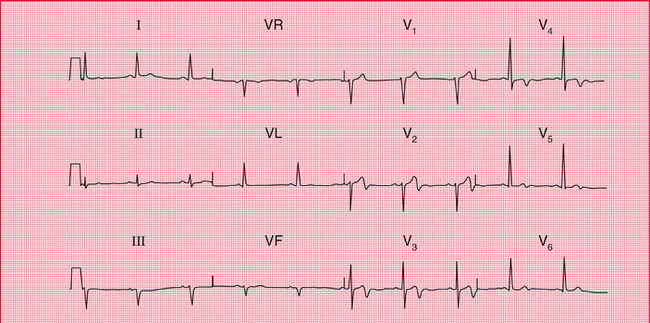
If an infarction is not full thickness and so does not cause an electrical window, there will be T wave inversion but no Q waves ( Fig. 4.16). Infarctions with this pattern of ECG change are called ‘non-ST segment elevation myocardial infarctions’ (NSTEMIs). The older term for the same pattern was ‘non-Q wave infarction’ or ‘subendocardial infarction’.
VENTRICULAR HYPERTROPHY
Left ventricular hypertrophy causes inverted T waves in leads looking at the left ventricle (I, II, VL, V5-V6) (see Fig. 4.6). Right ventricular hypertrophy causes T wave inversion in the leads looking at the right ventricle (T wave inversion is normal in lead Vl, and may be normal in lead V2, but in white adults is abnormal in lead V3) (see Fig. 4.4).
BUNDLE BRANCH BLOCK
The abnormal path of depolarization in bundle branch block is usually associated with an abnormal path of repolarization. Therefore, inverted T waves associated with QRS complexes which have a duration of 160 ms or more have no significance in themselves (see Figs 2.15 and 2.16).
OTHER ABNORMALITIES OF THE ST SEGMENT AND THE T WAVE
ELECTROLYTE ABNORMALITIES
REMINDERS
CAUSES OF ABNORMAL P WAVES, QRS COMPLEXES AND T WAVES
• Tall P waves result from right atrial hypertrophy, and broad P waves from left atrial hypertrophy.
• Broadening of the QRS complex indicates abnormal intraventricular conduction: it is seen in bundle branch block and in complexes originating in the ventricular muscle. It is also seen in the Wolff-Parkinson-White syndrome.
• Increased height of the QRS complex indicates ventricular hypertrophy. Right ventricular hypertrophy is seen in lead V1, and left ventricular hypertrophy is seen in leads V5-V6.
• Q waves greater than 1 mm across and 2 mm deep indicate myocardial infarction.
• ST segment elevation indicates acute myocardial infarction or pericarditis.
• ST segment depression and T wave inversion may be due to ischaemia, ventricular hypertrophy, abnormal intraventricular conduction, or digoxin.
• T wave inversion is normal in leads III, VR and V1. T wave inversion is associated with bundle branch block, ischaemia, and ventricular hypertrophy.
• T wave flattening or peaking with an unusually long or short QT interval may be due to electrolyte abnormalities, but many minor ST-T changes are nonspecific.
AND REMEMBER
 For more on the effect of electrolyte abnormalities see pp. 331-334