[level-membership-for-pulmolory-and-respiratory-category]
CHAPTER 10 ABG INTERPRETATION
PRETEST QUESTIONS
1. Which of the following blood gas measurements determines how well a patient’s lungs are being ventilated?
2. Which of the following blood gas measurements determines the level of tissue oxygenation?
3. The information below has been obtained from a patient using an aerosol mask at 40% oxygen.
What is this patient’s A − a gradient? PB = 747 mm Hg
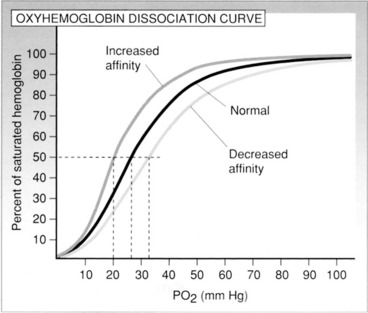
4. Which of the following conditions shifts the HbO2 dissociation curve to the right?
5. A patient with a 2 L/min nasal cannula has the following ABG results.
These results indicate which of the following conditions?
6. The respiratory therapist has received an order to obtain ABG levels from a patient, but an Allen test indicates collateral circulation is not present in the right wrist. At this time, the therapist would
REVIEW
CRT Exam Content Matrix: IB9f, IB10f, IIIE2a
RRT Exam Content Matrix: IB9f, IB10f, IIIE2a
 The heparin lubricates the syringe, but it is primarily used to prevent the blood from clotting once in the syringe.
 Exam Note
CRT Exam Content Matrix: IB9k, IB10k
RRT Exam Content Matrix: IB10i

(47 mm Hg is the level of water vapor pressure at body temperature)


 Exam Note
EXAMPLE:
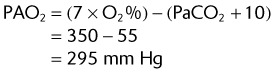
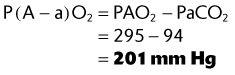
A patient using a 50% Venturi mask has the following ABG levels
| pH | 7.36 |
| PaCO2 | 45 mm Hg |
| PaO2 | 94 mm Hg |
What is this patient’s A − a gradient? (PB = 747 mm Hg)
| 60 to 79 mm Hg | Mild hypoxemia |
| 40 to 59 mm Hg | Moderate hypoxemia |
| <40 mm Hg | Severe hypoxemia |
| Age (yr) | PaO2 (mm Hg) |
|---|---|
| <60 | 80–100 |
| 60 | 80 |
| 65 | 75 |
| 70 | 70 |
| 75 | 65 |
| 80 | 60 |
III. CO2 TRANSPORT AND ALVEOLAR VENTILATION
CRT Exam Content Matrix: IA5, IB9j, IB10j, IC7, IIIE4a
RRT Exam Content Matrix: IA5, IB9j, IB10j, IC8
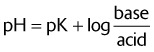
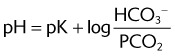
 The relationship between pH, HCO3−, and CO2 is vitally important in interpreting blood gas values effectively. HCO3− and CO2 determine the pH level. Understanding the relationship between these three values makes ABG interpretation much easier. To simplify, use the following equation
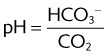
 Exam Note
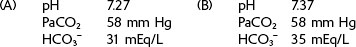
 Exam Note
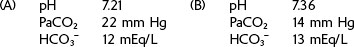
| pH | 7.21 |
| PaCO2 | 55 mm Hg |
| HCO3− | 18 mEq/L |
V. ARTERIAL BLOOD GAS INTERPRETATION
CRT Exam Content Matrix: IA5, IB9j, IB10j, IC7, IIIE4a
RRT Exam Content Matrix: IA5, IB9j, IB10j, IC8
| pH | 7.35–7.45 |
| PaCO2 | 35–45 mm Hg |
| PaO2 | 80–100 mm Hg |
| HCO3− | 22–26 mEq/L |
| Base excess (BE) | −2 to +2 |
Total base deficit (BD): −2; total BE: +2
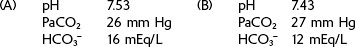
| pH | 7.23 |
| PaCO2 | 57 mm Hg |
| PaO2 | 81 mm Hg |
| HCO3− | 24 mEq/L |
| BE | −1 |
| pH | 7.57 |
| PaCO2 | 25 mm Hg |
| PaO2 | 98 mm Hg |
| HCO3− | 25 mEq/L |
| BE | 0 |
| pH | 7.45 |
| PaCO2 | 35 mm Hg |
| PaO2 | 53 mm Hg |
| HCO3− | 26 mEq/L |
| BE | +2 |
| pH | 7.38 |
| PaCO2 | 61 mm Hg |
| PaO2 | 54 mm Hg |
| HCO3− | 33 mEq/L |
| BE | +9 |
| pH | 7.29 |
| PaCO2 | 43 mm Hg |
| PaO2 | 87 mm Hg |
| HCO3− | 16 mEq/L |
| BE | −7 |
| pH | 7.20 |
| PaCO2 | 22 mm Hg |
| PaO2 | 83 mm Hg |
| HCO3− | 15 mEq/L |
| BE | −10 |
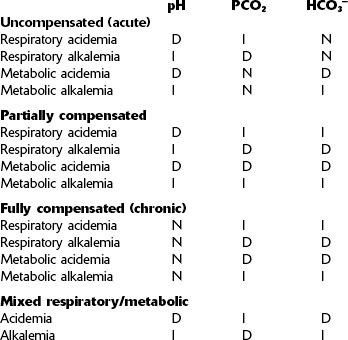
VI. ARTERIAL BLOOD GAS INTERPRETATION CHART
CRT Exam Content Matrix: IA5, IB9j, IB10j, IC7, IIIE4a
RRT Exam Content Matrix: IA5, IB9j, IB10j, IC8
Key for table: N, normal; I, increased; D, decreased.
CRT Exam Content Matrix: IIA10, IIC1, IIC3
RRT Exam Content Matrix: IIA5, IIC1, IIC3
POSTCHAPTER STUDY QUESTIONS
1. Interpret the following arterial blood gas values
2. What do the results of an Allen test mean?
3. What conditions shift the HbO2 dissociation curve to the right?
4. When the HbO2 curve is shifted to the right, how is the affinity of Hb for O2 affected?
5. Calculate the P(A − a)O2, given the following data
6. Which ABG value best reflects the patient’s ability to ventilate?
7. List a set of ABG levels that are typical of a patient with diabetic ketoacidosis.
Cairo JM, Pilbeam S. Mosby’s respiratory care equipment, ed 8. St Louis: Mosby; 2009.
Hess D, Respiratory care principles and practice, ed 1, Philadelphia, Saunders, 2002.
Wilkins RL, Stoller JK, Kacmarek R. Egan’s fundamentals of respiratory care, ed 9. St Louis: Mosby; 2009.
Wilkins R, Krider S, Sheldon R. Clinical assessment in respiratory care, ed 5. St Louis: Mosby; 2005.
[/level-membership-for-pulmolory-and-respiratory-category][not-level-membership-for-pulmolory-and-respiratory-category]
CHAPTER 10 ABG INTERPRETATION
PRETEST QUESTIONS
1. Which of the following blood gas measurements determines how well a patient’s lungs are being ventilated?
2. Which of the following blood gas measurements determines the level of tissue oxygenation?
3. The information below has been obtained from a patient using an aerosol mask at 40% oxygen.
What is this patient’s A − a gradient? PB = 747 mm Hg
4. Which of the following conditions shifts the HbO2 dissociation curve to the right?
5. A patient with a 2 L/min nasal cannula has the following ABG results.
These results indicate which of the following conditions?
6. The respiratory therapist has received an order to obtain ABG levels from a patient, but an Allen test indicates collateral circulation is not present in the right wrist. At this time, the therapist would
REVIEW
CRT Exam Content Matrix: IB9f, IB10f, IIIE2a
RRT Exam Content Matrix: IB9f, IB10f, IIIE2a
CRT Exam Content Matrix: IB9k, IB10k
RRT Exam Content Matrix: IB10i
(47 mm Hg is the level of water vapor pressure at body temperature)
EXAMPLE:
A patient using a 50% Venturi mask has the following ABG levels
| pH | 7.36 |
| PaCO2 | 45 mm Hg |
| PaO2 | 94 mm Hg |
What is this patient’s A − a gradient? (PB = 747 mm Hg)
[/not-level-membership-for-pulmolory-and-respiratory-category]
