A DESIGN SPECIFICATION FOR THE CARDIOVASCULAR SYSTEM
As a consequence of these performance requirements we have evolved with a circulatory system which in the textbook person, if stretched out end to end, would measure 60 000 miles or 96 000 km. This is enough to encircle the world three times. This book is about the organization and control of this circulatory system, the causes and effects of failure and the basis for treatment regimens aimed at avoiding or minimizing the effects of circulatory failure. An example of a clinical history of a patient with developing circulatory problems is introduced in Case 1.1:1.
Some fundamental concepts in relation to these opening paragraphs need further explanation.
Oxygen consumption
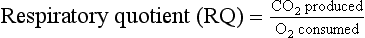
The precise value for RQ in any individual will reflect the composition of their diet but for a typical person consuming a mixed diet of carbohydrate, fat and protein the RQ would be about 0.8. This means that we normally consume more oxygen than we produce carbon dioxide. During exercise oxygen consumption may increase to about 10 times the resting value and the RQ may move closer to a value of 1 due to preferential metabolism of carbohydrate.
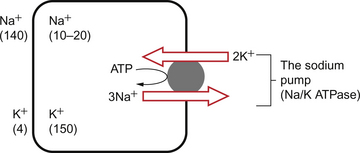
Oxygen is used within the mitochondria of cells to generate adenosine triphosphate (ATP). This provides the energy for movement, for the synthesis of macromolecules and to drive the movement of ions, particularly Na+ ions, across cell membranes against a concentration gradient. The distribution of Na+ and K+ inside and outside cells is summarized in Figure 1.1. The ion gradients are maintained by the sodium pump which expels three Na+ ions and pulls two K+ ions into the cell each time it operates. As both of these ion movements are against a concentration gradient, an ATP molecule is hydrolysed to provide the energy. For some cells there may be about a million sodium pumps each operating at about thirty times a second. In the body as a whole the sodium pump accounts for about 30% of all of our energy intake over our lifetime. In this way, ionic gradients are maintained which are essential for the continuing function of nerves and muscles, including the heart. Failure to maintain ATP generation in hypoxic tissues leads to osmotic swelling of cells and to a loss of normal cellular function (see p.7). To serve all the requirements, the quantities of ATP which must be synthesized are quite prodigious and amount to something roughly equivalent to an individual’s body weight every day.
Diffusion
Some important parameters determining rate of diffusion are:
• the diffusive gradient (concentration difference between two points)
• the solubility of the particle in the solvent; if it is not very soluble the concentration will be low
• the size of the solute particle (small particles will diffuse faster than large particles)
• temperature: diffusion is faster at high temperatures than at low temperatures; body temperature is about 37°C in normal human subjects.
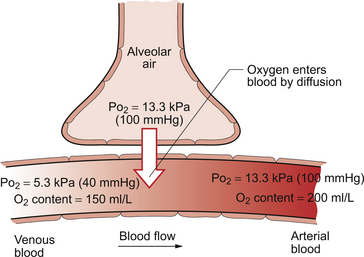
The diffusive gradients concerned with loading of oxygen into pulmonary capillary blood at the lungs and the delivery of oxygen into the tissues are shown in Figures 1.2 and 1.3. Figure 1.2 shows the events at the interface between an alveolus and a pulmonary capillary. A typical Po2 in the alveolus is 13.3 kPa (100 mm Hg). Blood returning to the lungs has a Po2 of about 5.3 kPa (40 mm Hg) and so oxygen diffuses into the pulmonary capillary blood from the alveolus. The diffusive gradient for unloading CO2 at the lungs is much smaller than for O2. Mixed venous blood Pco2 is about 6.1 kPa (46 mm Hg) whilst alveolar Pco2 is typically 5.3 kPa (40 mm Hg). The diffusive gradient for CO2 (0.8 kPa) is 10% of the diffusive gradient for O2 (8 kPa). Both diffuse at about the same rate because CO2 is 20 times as soluble in water as O2. The transit time for red blood cells through pulmonary capillaries at rest is about 1 second but the diffusive exchange of O2 and CO2 is normally complete in about 0.25 seconds.
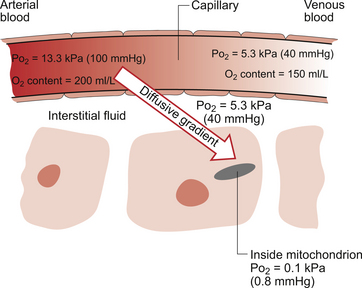
Delivery of O2 into the tissues (Fig. 1.3) starts with the arterial blood which has picked up O2 in the lungs (Po2 = 13.3 kPa; 100 mm Hg). Oxygen is used inside the mitochondria and the Po2 here is of the order of 0.1 kPa (about 1 mm Hg). The interstitial fluid outside a cell is part of the way down a continuous diffusive gradient between the arterial blood and the inside of a mitochondrion. A typical Po2 in the interstitial fluid is 5.3 kPa (40 mm Hg). Blood leaving a capillary has equilibrated with this fluid and so venous Po2 is the same as in the interstitial fluid.
Carriage of oxygen in blood
A further consequence of the poor solubility of oxygen in water is that we have evolved with an oxygen-carrying pigment, haemoglobin (Hb). The oxygen-binding characteristics of haemoglobin are such that it is nearly fully saturated with oxygen at the partial pressure of oxygen normally present in the alveoli of the lungs. Figure 1.4 shows the oxyhaemoglobin dissociation curve. At a Po2 of 13.3 kPa (100 mm Hg), a typical figure for the alveolus, Hb is 97–98% saturated with O2. This information can be used to calculate the amount of oxygen carried bound to haemoglobin as follows:
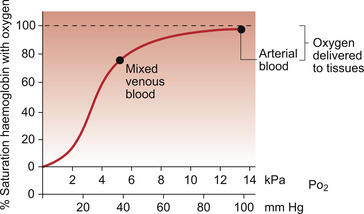
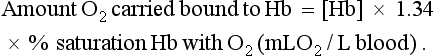
Reference to the oxyhaemoglobin dissociation curve (Fig. 1.4) shows that venous blood is about 75% saturated with O2 at Po2 = 5.3 kPa (40 mm Hg) and therefore about one quarter of the O2 carried in arterial blood has moved into the tissues. One quarter of the 200 mL O2/L present in arterial blood is 50 mL. If 50 mL of O2 is typically deposited in the tissues from each litre of arterial blood, and the textbook person’s cardiac output (volume of blood pumped per minute from each side of the heart—see Chapter 4) is 5 L/min, then 250 mL O2/min is delivered to the tissues. This is the amount of oxygen identified previously as a figure for O2 consumption rate for the textbook person at rest.
All tissues do not have the same oxygen consumption rate relative to blood flow. The figure quoted above, that ‘venous blood is typically 75% saturated with oxygen’, refers to ‘mixed venous blood’, i.e. the blood in the right side of the heart which is a mixture of all the venous drainages for the whole body. Venous blood from the kidneys, which have a high flow rate but relatively low O2 consumption, has an oxygen saturation of about 90%. By contrast, the blood in the venous drainage from the heart is only 25% saturated with O2. This is an important concept in relation to physiological control mechanisms and to the pathological consequences of disturbances of coronary blood flow (see Chapter 5).
The shape and position of the oxyhaemoglobin dissociation curve (Fig. 1.4) shows one of the safety factors in relation to lung function. The top of the curve is nearly flat from 13 kPa (100 mm Hg), normal arterial Po2, down to about 10 kPa (75 mm Hg). This means that a decrease in Po2 within this range makes little difference to the % saturation of haemoglobin with oxygen, that is little change to the total amount of oxygen carried in arterial blood. Put another way, we can afford to have a certain degree of lung malfunction before it makes any significant difference to oxygen delivery to the tissues.
Cyanosis
Peripheral cyanosis which is visible in extremities such as fingers and ears is caused by impaired local blood flow and excessive local extraction of oxygen from the available blood supply. This occurs for example in cold environments (hence the expression ‘blue with the cold’) or in peripheral vascular diseases such as Raynaud’s disease (see Chapter 9).
The battle against the hydrogen ion: acid–base balance
The amino acids which make up proteins have a number of side groups which can bind or release H+ ions. These include carboxylic acid groups ( COO−+H+
 COOH), amino groups (
 NH2+H+
 NH+3) and the imidazole side group of histidine which can be protonated. Increasing [H+] will make it more likely that these sites bind an H+ ion and, conversely, decreasing [H+] will make it more likely that H+ ions are released. These anionic and cationic sites are involved in forming ionic bonds which stabilize the three-dimensional structure of proteins and therefore changes in [H+] will alter the shape of proteins and will modify their functional characteristics. For example, altering the shape of ion channels will alter ion permeability and hence bring about changes in the membrane potential of the conducting system of the heart (see Chapter 2), and in the nervous system, which can be lethal. Close regulation of extracellular and intracellular [H+] is therefore crucially important.
The roles of the circulatory system in relation to acid–base balance can be summarized as buffering and transport. Buffering of H+ is essential to prevent substantial fluctuations in pH during the transport of H+ from the site of generation in the cells to the site of excretion in the lungs or kidneys. The most important buffering systems in blood are proteins, especially haemoglobin, and the bicarbonate buffer. Haemoglobin acts as a buffer because the protein component, globin, can absorb or release H+ as described earlier. The bicarbonate buffer relies on the generation of HCO−3 by the kidneys each time a hydrogen ion is excreted into the urine. The transport function of the circulatory system is crucial in maintaining acid–base balance. It is essential to have a very profuse circulatory system with a blood capillary close to every cell in the body so that H+ ions can be removed immediately they leave the cells where they are generated. Local circulatory failure will lead to local tissue acidosis. This concept is further discussed in relation to shock mechanisms in Chapter 14 of this book.
Case 1.1 A design specification for the cardiovascular system: 3
Arterial blood gas measurements
Calvin provided an arterial blood sample for blood gas analysis, which gave the following results:
Pco2 = 1.4 kPa (4.7–6.0) = 10.5 mm Hg (35–45)
Po2 = 15.9 kPa (11–13) = 119 mm Hg (80–100)
Calvin has a ketoacidosis, a form of metabolic acidosis. This is shown by the large negative base excess. He is hyperventilating as a response to H+ ions detected by his peripheral chemoreceptors. The CO2 produced in his tissues is being diluted into a volume of alveolar gas about three to four times the normal volume and hence Pco2 is a quarter to a third of normal values. The Po2 is high as a result of the hyperventilation and there is no indication of lung malfunction. An increase in Po2 at this level does not significantly increase the volume of oxygen carried in the blood as haemoglobin is already 97–98% saturated at normal arterial Po2 (Fig. 1.4).

Clinical management of the acidosis may involve infusion of sodium bicarbonate but it will often be corrected just by administration of insulin. This will end the ketoacid production and hence help to normalize acid–base status. A danger in the management of the acidosis is the attendant fluctuations in plasma [K+]. During an acidosis there is effectively an exchange of H+ and K+ across cell membranes such that acidosis results in hyperkalaemia. This may itself become life-threatening (see Case 1.1:2). Treatment of the acidosis however brings its own problems. K+ ions re-enter cells when the acidosis is corrected but also one of the physiological roles of insulin is to move K+ into cells. This happens normally for example after the intake of a K+ load, such as a banana, chocolate or orange juice. The combination of a reversal of the acidosis and the effects of insulin administration may cause plasma [K+] to fall to dangerously low levels with consequent effects on the membrane potential of pacemaker cells in the heart (see Chapter 2).
Apart from its general role as a nutrient delivery and waste collection system in the body, the circulatory system has other functions in relation to the immune system (see Chapter 11) and in thermoregulation (see Chapter 9).
Cell injury and cell death
Causes of cell injury
• Labile cells divide continuously as they are maintained in the cell cycle (Fig. 1.5). They are often stem cells or precursor cells in a cell population such as basal epidermal or gut lining cells and bone marrow cells. A reduction in labile cell number can, potentially, be quickly reversed.
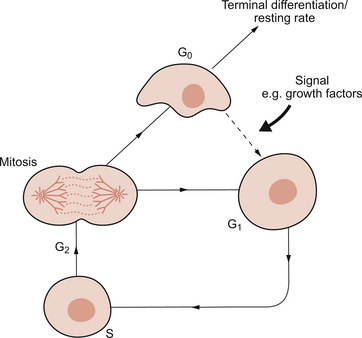
Fig. 1.5 The cell cycle. G0, non-dividing (resting) state; G1 and G2, gap/preparation phases; S, replication of DNA. Source: Bass et al., 2009.
• Stable cells are usually excluded from the cell cycle and are found in G0. They can be driven into the cell cycle, at G1, by an appropriate stimulus. This usually involves growth factor production by the surviving similar or neighbouring different cells. Once in the cell cycle, they can divide and restore cell numbers. Examples of this include renal tubular epithelial cells after acute tubular necrosis or hepatocytes after viral hepatitis.
• Permanent cells have no ability to divide and are excluded from the cell cycle. The classic examples are neurones and cardiac myocytes. Thus, after the brain and heart have been fully formed in utero, no new neurones or cardiac muscle cells will appear. These cells cannot replicate when cells are lost as, for example, after significant hypoxia. The body therefore has an alternative strategy. ‘Scarring’ known as gliosis in the brain and fibrosis in the heart, occurs and the dead cells are replaced by inert, non-specialized, fibrous tissue composed mainly of collagen. This is laid down by myofibroblasts found in granulation tissue. The process whereby the cells of a tissue are replaced by scar tissue is known as ‘repair’.
Cell death: apoptosis and necrosis
Apoptosis occurs when cell populations need to be fine-tuned. Although essentially a physiological event, it can occur as part of pathological processes. Physiologically, during fetal development, the digits of the hands and feet develop from solid ‘bars’ of tissue and the interdigital webs are removed by apoptosis. Similarly, the lumen in many hollow viscera is produced by apoptosis of the central cells. Autoreactive T lymphocyte cells are deleted from the young thymus by apoptosis. During the apoptotic process, the cell itself switches on genes which code for new proteins and some of these proteins cause the cell to die. Hence the term ‘cell suicide’ is used to describe apoptosis. Endonucleases cause DNA fragmentation and caspases destroy proteins. The cell is effectively killed from within. Cell membrane pumps may remain viable until the very end of the process. Morphologically, the cell shrinks, the nuclear chromatin condenses and the cell breaks up into a number of apoptotic bodies, which are cleared up (phagocytosed) by macrophages or neighbouring cells. The apoptotic cells are recognized by novel surface signal molecules. The apoptotic process is extremely quick, lasting a few minutes. It often only affects a relatively small number of cells and causes no lasting tissue damage.
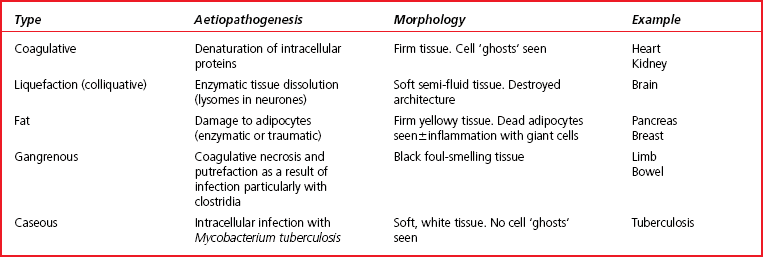
At the other end of the cell death spectrum is necrosis. Necrosis is the sum of the morphological changes that result from cell death in a living tissue. Necrosis is pathological, involves large numbers of cells and, importantly, evokes a potentially damaging, inflammatory response. Table 1.1 shows a comparison between apoptosis and necrosis. There are five main types of necrosis and these are outlined in Table 1.2.
Table 1.1
Comparison of apoptosis and necrosis
| Feature | Apoptosis | Necrosis |
| Type of process | Programmed cell death usually physiological | Pathological cell death |
| Purpose of process | Process used to ‘fine tune’ cell populations—individual cells/groups of cells involved (e.g. finger webs in embryogenesis) | Pathological event, often causing massive tissue destruction with numerous cells dying (e.g. myocardial infarction) |
| Progression of process | Complex ‘triggered’ series of intracellular biochemical events involving enzyme production and activation (DNA switched on) | Pathological insult tips cells out of limits of adaptability and irreversible cell death occurs |
| Rate of process | Very rapid | Usually slow |
| Final result | Ultimately cell shrinks, nucleus condenses and cell fragments into apoptotic bodies which are phagocytosed. No inflammation occurs | Ultimately the cells swell, burst and the intracellular contents often provoke intense inflammation |
Overall, therefore, cell death usually results in cessation of function of a tissue or organ. In necrosis, the dead cells rupture and there is spillage of cell contents. Amongst the extruded material there may be enzymes/proteins from the cytoplasm or specific organelles that enter the blood stream. These enzymes/proteins can be used as clinical ‘markers’ to assess which cells are damaged, the extent of the damage and even the timing/duration of the process. Examples of this include enzymes released following myocardial necrosis (see Chapter 5).
Overall functional structure of the cardiovascular system
The gross structure of the cardiovascular system is that we have two populations of blood vessels, the systemic and pulmonary circulations, which are perfused by two pumps mounted in series (Fig. 1.6). The fact that the two pumps are joined together in the heart with a common control system is convenient but is not theoretically essential.
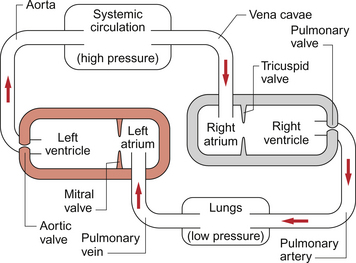
The relatively high pressure developed in the systemic arterial system, a result of the left ventricle pumping against the resistance to blood flowing through the rest of the systemic circulation, provides the driving force to perfuse all the tissues of the body with blood except the lungs (see Chapter 10). A series of arterial vessels branching from the aorta distribute the blood to the tissues of the body. Within these tissues, distribution of blood flow is primarily controlled at the level of the arterioles and pre-capillary sphincters but exchange of nutrients and waste products takes place in the capillaries (see Chapter 11). Blood then drains through venules into small veins and eventually the great veins (superior and inferior vena cavae) to return to the right side of the heart. The structures and functions of each of these types of blood vessel will be described later in this chapter.
The output from the right side of the heart serves the relatively low pressure pulmonary circuit (Fig. 1.6). Blood leaves the right ventricle in the pulmonary artery and gas exchange between blood and the alveoli of the lungs occurs in the pulmonary capillaries. Carbon dioxide diffuses from the blood into the alveoli and oxygen diffuses in the reverse direction. Blood returns to the left side of the heart in the pulmonary veins.
Blood pressure in the circulation
The systemic loop is a relatively high-pressure circuit. The peak (systolic) pressure generated in the aorta when the left ventricle contracts is typically 120 mm Hg and the trough (diastolic) pressure reached when the ventricle is refilling is typically 80 mm Hg. Mean pressure is 93 mm Hg (see Chapter 10). After passage of blood through a series of resistances, small arteries, arterioles, capillaries, venules and veins, the blood returns to the right atrium where the mean pressure is typically 0–5 mm Hg. There is a continuous drop in pressure going round each of the loop circulations. This is of course essential for blood to flow from one point to the next, that is downhill in pressure terms.
The pulmonary blood supply is a relatively low-pressure loop. The systolic pressure generated in the pulmonary artery is typically 20–25 mm Hg and the diastolic pressure 8–12 mm Hg. Pulmonary capillary blood pressure is about 8–11 mm Hg and any significant increase in this value leads to excessive movement of water out of the pulmonary capillaries and a major clinical problem, pulmonary oedema (see Chapter 11). Pressure in the pulmonary vein and the left atrium is normally about 5–8 mm Hg.
Note: pressures in the circulatory system are measured relative to atmospheric pressure. Thus a pressure of 0 mm Hg in the right atrium means that it is the same as atmospheric pressure. Factors determining arterial blood pressure are described in Chapter 10.
Circulation time
Resting cardiac output for the textbook subject is about 5 L/min (see Chapter 4). This means that, at rest, the average red blood cell is doing a complete circuit of the double loop circulation described above every minute. During exercise (see Chapter 13) cardiac output may increase about fivefold. As blood volume is still the same, the average red cell is now completing the double circuit in 12 seconds.
Structure and function of blood vessels
The entire circulation consists of a tube of endothelial cells surrounded by varying amounts of the other tissue types which make up the blood vessel wall. The properties of endothelial cells as sources of vasoactive mediators (see Chapter 9) and their role in determining the functional properties of capillaries (see Chapter 11) are discussed later in this book.
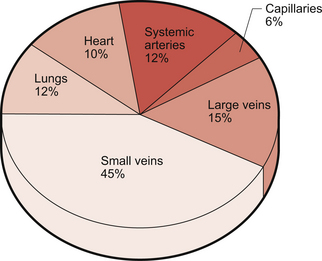
The blood volume of the textbook person is about 5 L and its distribution among the various types of blood vessel is illustrated in Figure 1.7.
Structure of the blood vessel walls
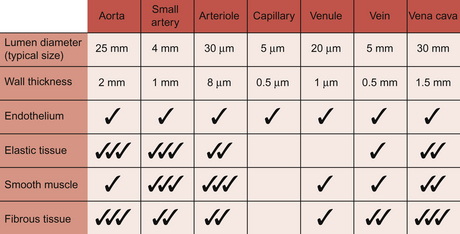
With the exception of capillaries, blood vessel walls each consist of three layers, tunica intima (inner layer), tunica media (middle layer) and tunica adventitia (outer layer) (Fig. 1.8).
The tunica intima consists of the endothelial cells. The endothelial cells provide a physical barrier between the blood and the rest of the blood vessel wall. Disruption of this barrier is an important step in the development of atheroma (see Chapter 5).
The tunica media has two layers of elastic tissue, the internal and external elastic laminae, sandwiching a layer of smooth muscle. The media layer is a source of mechanical strength for the blood vessel and, as it contains smooth muscle, the means by which the diameter of the vessel can be altered.
Arteries
Artery is a collective term which covers vessels with varying structures and varying functions. They exist on the high pressure side of the circulation and have an external diameter larger than about 100 μm. Arteries contain about 12% of the total blood volume (Fig. 1.7). They are conveniently divided into elastic and muscular arteries on the basis of their functions.
Arterioles
Arterioles typically have a lumen diameter of about 30 μm and a wall thickness of about 6 μm. Smooth muscle is a major component of the vessel wall and contraction is regulated by a range of mechanisms (see Chapter 9). The arterioles, together with some small arteries, are referred to as ‘resistance vessels’ and are the major site for regulation of the distribution of blood flow and for arterial blood pressure regulation (see Chapter 10). During passage through the arterioles blood pressure drops from about 55 mm Hg to 25 mm Hg at the entrance to the capillary segment. In the resistance vessels the pulsatile blood flow is smoothed out to a constant vessel pressure.
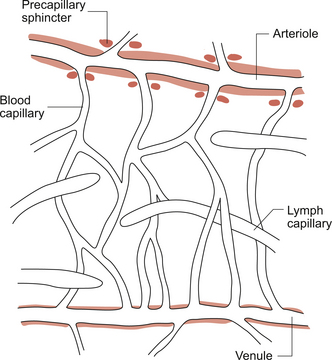
Figure 1.9 is a diagram of the ‘microcirculatory unit’, the arrangement of arterioles, pre-capillary sphincters, capillaries and venules inside a tissue. At the entrance to a capillary bed from an arteriole there is a small cuff of smooth muscle which acts as a pre-capillary sphincter. Closure of the sphincter means that the capillary is not perfused with blood. In resting muscle tissue, of the order of 90% of sphincters may be shut at any one time but will open during exercise (see Chapter 13). The sphincters have no nerve supply but are regulated by local metabolite concentrations.
Capillaries
Capillary walls have a single layer of endothelial cells about 0.5 μm thick with a surrounding, non-cellular, basement membrane. Capillary walls do not have smooth muscle but contractile elements within endothelial cells allow them to change shape in response to chemical mediators. This occurs, for example, as part of inflammatory reactions. The cells are not uniform in either structure or function throughout the body and this is discussed in more detail at the start of Chapter 11. Capillaries are the site of exchange of nutrients and waste products between the circulation and the interstitial fluid surrounding cells in the body. This is aided by the low velocity of flow through capillaries. They are the smallest blood vessels and make by far the largest contribution to the 60 000 miles of tubing which comprise the entire circulation. Despite this, only about 6% of total blood volume is flowing through capillaries at any one time (Fig. 1.7).
Venules
These vessels have an internal diameter of the order of 30 μm and a wall about 3 μm thick. The wall comprises an endothelial cell lining together with small amounts of fibrous tissue and an often incomplete layer of smooth muscle. In common with capillaries, venule walls are an important site for the movement of water and nutrients between the circulation and the interstitial fluid (see Chapter 11).
Veins
Veins are very distensible, in other words, if pressure increases inside a vein it will expand easily. Small veins accommodate a high percentage of total blood volume (about 45%) (Fig. 1.7) and have an effective venoconstrictor sympathetic nerve supply. This is important to avoid venous pooling of blood in the lower half of the body, especially during changes in posture (see Chapter 9). Small veins in the lower half of the body have valves which are an important aspect of the venous return mechanisms which move blood against the force of gravity from the legs back to the heart (see Chapter 4).
Vena cavae and other large veins
The inferior and superior vena cavae are sometimes referred to as the great veins. The inferior vena cava has an internal diameter of about 30 mm, larger than the aorta, but a wall thickness (1.5 mm) which is less than the aorta. The walls of the vena cavae contain quite a lot of fibrous tissue together with some elastic tissue and smooth muscle. These large veins contain about 15% of total blood volume (Fig. 1.7).
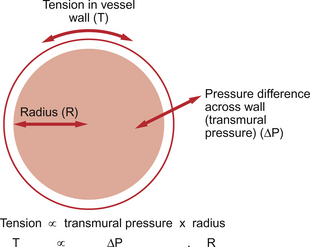
The fibrous tissue in the wall of the vena cava provides strength. This is necessary because wall tension in this large vessel is significant. This can be illustrated by reference to the law of Laplace. This law applies to any distensible structure and links wall tension (T), radius (R) and the pressure difference (ΔP) across the wall of the vessel, the transmural pressure (Fig. 1.10):

From cradle to grave—the presentation of heart disease
Babies with major heart problems may be diagnosed before birth and antenatal screening methods are improving all the time. The majority of major defects will present within a few hours of birth with symptoms such as breathlessness and poor feeding and signs such as cyanosis and murmurs (see Chapter 12). Incidental findings subsequently become the major route by which cardiac defects are identified, usually when children present to their GP or hospital with other illness which may be exacerbated by underlying heart disease.
Slowly the classical features of coronary artery disease will begin to dominate the population as it ages. Symptoms such as swollen ankles (see Chapter 11), chest pain (see Chapter 6) or dyspnoea with exertion (see Chapter 5) herald the long-term decline related to progressive obstruc-tion of the coronary arteries. The prevalence of cardiovascular disease rises steadily from the fourth decade. The initial evidence may come in the first acute myocardial infarction or even sudden death (the more common presentation in women over the age of 50). Various risk factors are recognized as increasing the progression of this condition; lifestyle factors such as smoking, obesity, inactivity and alcohol intake; medical problems such as diabetes, hypertension; genetic factors leading to familial predisposition. All must be assessed and factored in to the risk assessment and management of the individual.
Aaronson, P. I., Ward, J. P. T. The Cardiovascular System at a Glance. Oxford: Blackwell Publishing; 2007.
Abelow, B. Understanding Acid–Base. Baltimore: Williams and Wilkins; 1998.
Bass, P., Burroughs, S., Carr, N., Way, C. Master Medicine: General and Systematic Pathology, third ed. Edinburgh: Churchill Livingstone; 2009.
Davies, A., Moore, C. The Respiratory System, second ed. Edinburgh: Churchill Livingstone; 2009.
Donnelly, R., Emslie-Smith, A. M., Gardner, I. D., Morris, A. D. Vascular complications of diabetes. In: Donnelly R., London N. J. M., eds. ABC of Arterial and Venous Disease. London: BMJ Books, 2000.
Folkman, J. Angiogenesis. Ann. Rev. Med.. 2006; 57:1–18.
Levick, J. R. An introduction to Cardiovascular Physiology, fifth ed. London: Arnold; 2009.