CHAPTER 7 Understanding and Applying Psychological Assessment
OVERVIEW
Psychological assessment is a consultation procedure that can greatly enhance clinicians’ understanding of their patients and facilitate the treatment process. To a considerable extent, psychological assessment consultations are underutilized in the current mental heath care environment. This is unfortunate given the evidence that psychological tests generally produce reliability and validity coefficients similar to many routine diagnostic medical tests.1 This chapter will provide a detailed review of what a psychological assessment comprises and discuss the potential benefits of an assessment consultation. This will be accomplished by reviewing the methods used to construct valid psychological instruments, the major categories of psychological tests (including detailed examples of each category), and the application of these instruments in clinical assessment. Issues relating to the ordering of psychological testing and the integration of information from an assessment report into the treatment process will also be presented.
PSYCHOMETRICS: THE SCIENCE OF TEST DEVELOPMENT
Reliability and Validity
To be meaningfully employed for either research or clinical activities, psychological tests must possess adequate reliability and validity. Reliability represents the repeatability, stability, or consistency of a subject’s test score. Reliability is usually represented as some form of a correlation coefficient ranging from 0 to 1.0. Research instruments can have reliability scores as low as .70, whereas clinical instruments should have reliability scores in the high .80s to low .90s. This is because research instruments are interpreted aggregately as group measures, whereas clinical instruments are interpreted for a single individual. A number of reliability statistics are available for evaluating a test: internal consistency (the degree to which the items in a test perform in the same manner), test-retest reliability (the consistency of a test score over time, which typically ranges from a few days to a year), and interrater reliability (observer-judged rating scales). The kappa statistic is considered the best estimate of interrater reliability, because it reflects the degree of agreement between raters after accounting for chance scoring. Factors that affect reliability (the amount of error present in a test score) can be introduced by variability in the subject (subject changes over time), in the examiner (rater error, rater bias), or in the test itself (given under different instruction).
MAJOR CATEGORIES OF PSYCHOLOGICAL TESTS
Intelligence Tests
Alfred Binet (1857-1911) is credited with developing the first true measure of intelligence. Binet and Theodore Simon were commissioned by the French School Board to develop a test to identify students who might benefit from special education programs. Binet’s 1905 and 1908 scales form the basis of our current intelligence tests. In fact, it was the development of Binet’s 1905 test that marked the beginning of modern psychological testing. His approach was practical and effective as he developed a group of tests with sufficient breadth and depth to separate underachieving children with normal intellectual ability from those who were underachieving because of lower intellectual ability. In addition to mathematic and reading tasks, Binet also tapped into other areas (such as object identification, judgment, and social knowledge). About a decade later at Stanford University, Lewis Terman translated Binet’s test into English, added additional items, and made some scoring revisions. Terman’s test is still in use today and is called the Stanford-Binet Intelligence Scales.2
Intelligence is a hard construct to define. Wechsler wrote that “intelligence, as a hypothetical construct, is the aggregate or global capacity of the individual to act purposefully, to think rationally, and to deal effectively with the environment.”3 This definition helps clarify what the modern IQ tests try to measure (i.e., adaptive functioning) and why intelligence or IQ tests can be important aids in clinical assessment and treatment planning. If an IQ score reflects aspects of effective functioning, then IQ tests measure aspects of adaptive capacity. The Wechsler series of IQ tests cover the majority of age ranges. The series starts with the Wechsler Preschool and Primary Scales of Intelligence (ages 4 to 6 years), progressing to the Wechsler Intelligence Scale for Children–III (ages 5 to 16 years), and ending with the Wechsler Adult Intelligence Scale–III (ages 16 to 89 years).4 Although the current discussion will focus on the measurement of adult intelligence, all of the Wechsler scales provide three major IQ test scores: the Full Scale IQ (FSIQ), Verbal IQ (VIQ), and Performance IQ (PIQ). All three IQ scores have a mean of 100 and a standard deviation (SD) of 15. This statistical feature means that a 15-point difference between a subject’s VIQ and PIQ can be considered both statistically significant and clinically meaningful. Table 7-1 presents an overview of the IQ categories.
Table 7-1 IQ Score Ranges with Corresponding IQ Scores and Percentile Distribution
| Full-Scale IQ Score | Intelligence (IQ) Categories | Percentile in Normal Distribution |
|---|---|---|
| ≥130 | Very superior | 2.2 |
| 120-129 | Superior | 6.7 |
| 110-119 | High average | 16.1 |
| 90-109 | Average | 50.0 |
| 80-89 | Low average | 16.1 |
| 70-79 | Borderline | 6.7 |
| ≤69 | Mentally retarded | 2.2 |
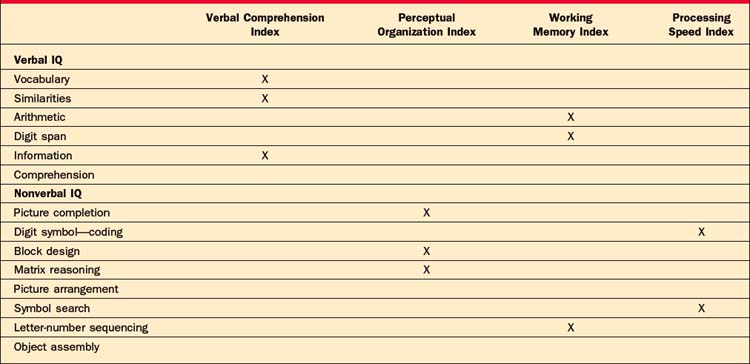
The Wechsler IQ tests are composed of 10 or 11 subtests, which were developed to tap two primarily intellectual domains, verbal intelligence (VIQ; Vocabulary, Similarities, Arithmetic, Digit Span, Information, and Comprehension) and nonverbal, or performance, intelligence (PIQ; Picture Completion, Digit Symbol, Block Design, Matrix Reasoning, and Picture Arrangement). All the Wechsler subtests are constructed to have a mean score of 10 and an SD of 3. Given this statistical feature we know that if two subtests differ by 3 or more scaled score points, the difference is clinically meaningful. All IQ scores and subtest-scaled scores are also adjusted for age.4
The subscales included in the VIQ and PIQ can be deconstructed even further to provide specific information about verbal and nonverbal abilities. Table 7-2 provides an outline of the WAIS-III subtests and their location on the verbal and nonverbal indexes. The Verbal Comprehension Index (VCI) and the Working Memory Index (WMI) are the two indexes subsumed under the VIQ. Because the subtests involved in the VCI are not timed, they are considered to be a more pure measure of verbal ability (i.e., word knowledge, verbal abstract reasoning, and general information). As the name implies, the WMI is a measure of how quickly individuals can manipulate, process, and respond to verbal information. For example, the Arithmetic subtest that is part of the WMI is administrated orally and the individual is not permitted to use paper and pencil to solve the word problems. The PIQ is composed of the Perceptual Organizational Index (POI) and the Processing Speed Index (PSI). Subtests in the POI measure nonverbal reasoning, attention to detail, and the integration of visual and motor systems. Although two out of the three subtests that make up the POI are timed, fast responding is not the focus of this index. The PSI is a measure of how quickly individuals can process and respond to visually presented information.4
Objective (Self-Report) Tests of Personality and Psychopathology
Hathaway and McKinley (1943) published the original version of the MMPI at the University of Minnesota.5 (Although the original version of the MMPI was produced in 1943, the official MMPI manual was not published until 1967.5) The purpose of the test was to be able to differentiate psychiatric patients from normal individuals, as well as to accurately place patients in the proper diagnostic group. A large item pool was generated, and hundreds of psychiatric patients were interviewed and asked to give their endorsement on each of the items. The same was done with a large sample of people who were not receiving psychiatric treatment. The results of this project showed that while the item pool did exceptionally well in differentiating the normal from clinical groups, differentiating one psychiatric group from another was more difficult. A major confounding factor was that patients with different conditions tended to endorse the same items; this led to scales with a high degree of item overlap (i.e., items appeared on more than one scale). This method of test development, known as empirical keying (described earlier), was innovative for its time because most personality tests preceding it were based solely on items that test developers theorized would measure the construct in question (rational test development). The second innovation introduced with the MMPI was the development of validity scales that were intended to identify the response style of test takers. In response to criticisms that some items contained outdated language and that the original normative group was considered a “sample of convenience,” the MMPI was revised in 1989. The MMPI-2 is the result of this revision process, and it is the version of the test currently used today.6
The Minnesota Multiphasic Personality Inventory–2
The Minnesota Multiphasic Personality Inventory–2 (MMPI-2) is a 567-item true/false, self-report test of psychological function.6 As mentioned earlier, the MMPI was designed to both separate subjects into “normals” and “abnormals,” and to subcategorize the abnormal group into specific classes.7 The MMPI-2 contains 10 Clinical Scales that assess major categories of psychopathology and six Validity Scales designed to assess test-taking attitudes. MMPI raw scores are transformed into standardized T-scores where the mean is 50 and the SD is 10. A T-score of 65 or greater indicates clinically significant psychopathology on the MMPI-2. An interesting feature of the MMPI-2 is that over 300 “new” or experiential scales have been developed for the test over the years. This is made possible by the empirical keying method described earlier. Groups of items that have been shown to reliably differentiate two or more samples or populations can be added to the MMPI-2 as a clinical or supplemental scale. The addition of these scales helps sharpen and individualize the clinical interpretation of the MMPI-2 results.
The MMPI-2 validity scales are the Lie (L), Infrequency (F), correction (K), Variable Response Inventory (VRIN), True Response Inventory (TRIN), and F back (FB) scales. The L scale was designed to identify respondents who attempt to minimize pathology to the extent that they deny even minor faults to which most individuals will admit. It is commonly thought of as an unsophisticated attempt to appear healthier than one might actually be (i.e., faking good). The F scale contains items of unusual or severe pathology that are infrequently endorsed by most people. Therefore, elevation of the F scale is thought of as either a “cry for help” or a more intentional attempt to appear worse off psychologically (i.e., faking bad). Like the L scale, the K scale is purported to measure defensiveness, but data have suggested that persons with a higher level of education tend to score higher on the K scale items than the L scale items.8 A higher K scale score (more defensiveness) means that the clinical scales are likely to be lower than they should, so the MMPI-2 has a “K-corrected” formula that provides an estimation of what the clinical scales might be if the K scale were within normal limits. The K corrections were devised rationally and have not been empirically verified. The next three validity scales, VRIN, TRIN, and F(b), were added during the revision. The VRIN consists of item pairs that are expected to be answered similarly (e.g., “I feel sad most of the time” and “I consider myself to be depressed”). Too many item pairs with inconsistent answers will raise the suspicion of test validity. The TRIN is a scale of item pairs that are not expected to be answered similarly (e.g., “I feel sad most of the time” and “I am generally a happy person”). Too many item pairs endorsed in the true direction is thought to indicate a true response bias, which can also bring the test results into question. The F(b) scale is the most recent addition and is essentially the F scale for the back half of the test. The items that make up the original F scale are all on the first half of the test, and it was observed that some patients are prone to become less invested in accurate responding as they progress through the MMPI’s 567 items. An elevated F(b) scale suggests that an individual was prone to endorse less frequently rated items on the back half of the test, thus calling into question the accuracy of the results.
The MMPI-2 Clinical Scales include the following: (1) Hs—Hypochondriasis; (2) D—Depression; (3) Hy—Conversion Hysteria; (4) Pd—Psychopathic Deviate; (5) Mf—Masculinity-Femininity; (6) Pa—Paranoia; (7) Pt—Psychasthenia; (8) Sc—Schizophrenia; (9) Ma—Hypomania; and (0) Si—Social Introversion. The scales were named after the diagnostic groups they were attempting to identify on the original MMPI (and helps explain why terms such as “Psychasthenia” still appear on the test even though this clinical term is no longer used). To avoid confusion, most professionals who use the test currently refer to the scales by their number. Table 7-3 provides a brief description of the behaviors associated with the MMPI-2 clinical scales.
Table 7-3 Behavioral Descriptions Associated with MMPI-2 Scale Elevations
| Validity |
| (L) Lie: |
| Unsophisticated effort to deny psychological problems |
| (F) Infrequency: |
| Excessive endorsement of infrequent symptoms—looking bad |
| (K) Defensiveness: |
| Sophisticated or subtle efforts to deny psychological problems |
| Clinical Scales |
|
(3) Hy—Conversion Hysteria: Lack of insight, denial of psychological problems, focus on physical complaints
|
The MMPI-2 is interpreted first by examining the validity scales. Scales at or above the cutoff for clinical significance (T ≥ 65) may indicate the presence of a motivated response style. However, elevation on a single validity scale does not necessarily mean that an interpretation of the clinical scales is not possible. In fact, a recent meta-analysis suggests that among the validity scales, the raw score difference between the F and K scales had the largest effect size in identifying faked and real MMPI-2 profiles.9 An MMPI-2 profile determined to be invalid essentially means that enough evidence exists to suggest that items were not answered in a consistent or straightforward manner; this calls into question the validity of the remaining items. For those valid profiles, the first phase of interpretation is to identity the profile code type, which is done by determining the highest two or three scales. Numerous books on MMPI-2 interpretation exist to help understand the personality characteristics of individuals that produce specific scale elevations or code types. For example, a 2-4-7 code type indicates the presence of depression (scale 2), anxiety (scale 7), and impulsivity (scale 4) and the likelihood of a personality disorder.7 As the most researched personality instrument, what the MMPI-2 lacks in theoretical foundation, it has gained in the acquired information of the immense number of studies done with this measure. A great deal of this research has also helped to create subscales for many of the major clinical scales.
Two major products from this body of literature are the Harris-Lingoes subscales and the MMPI-2 Content scales.10–12 The Harris-Lingoes scales were based on a content analysis of the more heterogeneous clinical scales with a goal of extracting factors that had highly similar items. For example, scale 2 (Depression) has five scales: Subjective Depression; Psychomotor Retardation; Physical Malfunctioning; Mental Dullness; and Brooding. Though retained in the MMPI-2 with some minor changes and included in the automated report of the MMPI-2, the data on the Harris-Lingoes scales are somewhat sparse and outdated.8 However, examining these scales in concert with the full clinical scales can help enhance the clinical richness of an MMPI-2 interpretation. The Content scales underwent a more rigorous empirical process and all of the original MMPI items were used, as opposed to items only from certain clinical scales, as was done by Harris and Lingoes.10,11 Content scales were created by first identifying the clinically relevant areas measured by the original item pool. After an iterative process that eliminated scales and items with poor psychometric characteristics, 15 scales (with minimum item overlap) were created that measure clinically relevant areas and were not specifically tapped by any one clinical scale. Accumulated research on the content scales suggests a stronger relationship with DSM-IV diagnoses than exists for some of the original clinical scales.
The Millon Clinical Multiaxial Inventory–III
The Millon Clinical Multiaxial Inventory–III (MCMI-III) is a 175-item true/false, self-report questionnaire designed to identify both symptom disorders (Axis I conditions) and personality disorders (PDs).13 The MCMI was originally developed as a measure of Millon’s comprehensive theory of psychopathology and personality.14 Revisions of the test have reflected changes in Millon’s theory along with changes in the diagnostic nomenclature. The MCMI-III is composed of three Modifier Indices (validity scales), 10 Basic Personality Scales, three Severe Personality Scales, six Clinical Syndrome Scales, and three Severe Clinical Syndrome Scales. One of the unique features of the MCMI-III is that it attempts to assess both Axis I and Axis II psychopathology simultaneously. The Axis II scales resemble, but are not identical to, the DSM-IV Axis II Disorders. Given its relatively short length (175 items vs. 567 for the MMPI-2), the MCMI-III can have advantages in the assessment of patients who are agitated, whose stamina is significantly impaired, or who are otherwise suboptimally motivated. An innovation of the MCMI continued in the MCMI-III is the use of Base Rate (BR) Scores rather than traditional T-scores for interpreting scale elevations. BR scores for each scale are set to reflect the prevalence of the condition in the standardization sample. The critical BR values are 75 and 85. A BR score of 75 on the personality scales indicates problematic traits, whereas on the symptom scales it signals the likely presence of the disorder as a secondary condition. BR scores of 85 or greater on the personality scales indicate the presence of a personality disorder. A similar elevation on the symptoms scales signals that the disorder is prominent or primary.
The Personality Assessment Inventory
The Personality Assessment Inventory (PAI) is one of the newest objective psychological tests available.15 The PAI was developed using a construct validation framework with equal emphasis placed on theory-guided item selection and the empirical function of the scales. The PAI uses 344 items and a four-point response format (False, Slightly True, Mainly True, and Very True) to make 22 scales with nonoverlapping items. The PAI has some psychometric advantages over other self-report instruments. Unlike the MMPI-2 and MCMI, one scale elevation on the PAI will not result in a second, by proxy, scale elevation simply because those scales share items. This characteristic allows for more direct interpretation of each scale. The 22 scales of the PAI consist of four validity scales (Inconsistency [INC], Infrequency [INF], Negative Impression Management [NIM], Positive Impression Management [PIM]); 11 clinical scales (Somatic Complaints [SOM], Anxiety [ANX], Anxiety-Related Disorders [ARD], Depression [DEP], Mania [MAN], Paranoia [PAR], Schizophrenia [SCZ], Borderline [BOR], Antisocial [ANT], Alcohol [ALC], Drug [DRG]); five treatment scales (Aggression [AGG], Suicide [SUI], Stress [STR], Nonsupport [NON], Treatment Rejection [RXR]); and two interpersonal scales (Dominance [DOM], Warmth [WRM]). The PAI possesses outstanding psychometric features and is an excellent test for broadly assessing multiple domains of relevant psychological function. As the newest of the comprehensive self-report tests, the PAI has been used less frequently in research studies. However, the growing evidence for the validity of this measure is very promising.
As was discussed with both the MMPI-2 and the MCMI, the PAI also has validity scales that were created to help detect deviant response styles. The first validity scale, INC, is a collection of item pairs that are expected to be answered in the same direction (similar to the VRIN from the MMPI-2). Typically, elevations on this scale are an indication of confusion, reading problems, or even cognitive impairment.16 INF consists of items that are expected to be answered in a certain direction. Half of these items should be true (e.g., “Most people prefer to be happy”) and half should be false (e.g., “I really enjoy paying taxes”). Elevation of the INF suggests that the respondent was overinterpreting items, was careless, or has reading difficulties. If either INC or INF is above its respective cutoff, it invalidates the test results and further interpretation of the clinical scales is not recommended. The NIM scale is designed to identify respondents who are attempting to present themselves in an overly negative light. Similar to the F scale of the MMPI-2, NIM items are rarely endorsed by most people (e.g., “I have not had a single day of happiness”). Another use for this scale, however, is to identify patients who may want their treaters to know how much psychological distress they are in (i.e., a cry for help). It is not uncommon for NIM to be elevated in clinical samples. When evaluating psychiatric inpatients, NIM scores can reach well into the 80s, which is 3 SDs above community norms. The PIM attempts to identify respondents who are trying to present themselves in an overly positive light. Research has shown that the PIM scale is highly sensitive to efforts to present oneself in an overly positive manner (“I never feel bad”); even modest elevations (T-scores ≥ 57) can raise questions about profile accuracy.
Projective Tests of Personality
In 1921, Hermann Rorschach published his Inkblot Test. Interestingly, the idea of using inkblots was not unique to Rorschach, as Binet (1895) unsuccessfully attempted to use this method in his early testing of children in the French school system to measure visual imagination.17 For Rorschach, a game called Klecksographie (Blotto) was very popular in Europe at the time when he was entering school. In this game, inkblots were used to generate artistic and colorful descriptions for entertainment. Rorschach observed that psychotic patients produced very different responses to the Blotto game than did others. After extensive systematic exploration of the diagnostic potential of having patients perceive a series of standard inkblots, he published his book Psychodiagnostik, which received only a lukewarm reception. Rorschach passed away within a year of the book’s publication without ever realizing the impact his test would eventually have on personality assessment.
The second milestone in projective assessment came with the publication of the Thematic Apperception Test (TAT).18 Unlike the Rorschach, which uses ambiguous inkblots, the TAT is a series of redrawn pictures of people of varying genders and ages engaged in some sort of activity. The respondent is instructed to tell a story about the picture that has a beginning, middle, and end and describes what the characters in the picture are thinking and feeling. The TAT stimuli were selected from pictures, magazine illustrations, and paintings. Murray, a faculty member at Harvard, had been in psychoanalysis with Carl Jung and was strongly influenced by Jung’s theory. Unlike the tentative acceptance of the Rorschach during the same period, the TAT was widely accepted and used by researchers from many different theoretical orientations. The TAT has sparked a wide interest, and many other tests of apperception have been developed over the years for clinical and research purposes.
Performance-based tests of psychological functioning differ substantially from objective tests. These tests are less structured and require more effort both on the part of the patient to make sense of, and to respond to, the test stimuli, and the examiner to conduct appropriate queries into vague responses while recording each response verbatim. Even the instructions for the projective tests tend to be less specific than those of an objective test. As a result, the patient is provided with a great degree of freedom to demonstrate his or her own unique personality characteristics and psychological organizing processes. While self-report tests provide a view of the patient’s “conscious” explicit motivations (what he or she wants the examiner to know), the projective tests provide insights into the patient’s implicit motivations, his or her typical style of perceiving, organizing, and responding to ambiguous external and internal stimuli. When combined together, data from objective and performance-based tests can provide a comprehensive multidimensional description of a patient’s functioning.
The Rorschach Inkblot Method
In the second phase, the examiner reviews the patient’s responses and inquires as to where on the card the response was seen (known as “location” in Rorschach language) and what made it look that way (known as the determinants) to the patient. It is important that no additional responses are given at this point, and patients are directed as such if they report being able to see something new on second viewing of the cards. Exner’s Comprehensive System (CS) for scoring the Rorschach is the mostly widely used scoring system in the United States.19 The process for scoring a Rorschach response is outlined next.
Combining individual Rorschach variables into indexes increases their reliability and validity. The Rorschach indexes are the Perceptual Thinking Index (PTI), the Suicide Constellation (S-CON), the Depression Index (DEPI), the Coping Deficit Index (CDI), the Hypervigilance Index (HVI), and the Obsessive Style Index (OBS). The PTI, S-CON, and DEPI have received the most empirical attention. While the validity of the DEPI has had mixed reviews, the PTI and S-CON appear to hold up well as valid measures of disordered thinking and for the identification of individuals who are at elevated risk for suicide, respectively.20,21
For many years, Rorschach scoring has been criticized for being too subjective. However, the laborious work of Exner has resulted in the Comprehensive System, which has demonstrated acceptable levels of reliability.17,19 In part due to the recent negative attention on the Rorschach, high standards of reliability have been established that must be met to publish Rorschach research.22–24 Interrater Kappa’s of .80 or better are the standard minimum for all Rorschach variables reported in published research studies. For comparison, Kappas in this range are equal to, or better than, the Kappa’s reported in many studies using structured interview DSM diagnoses. Countless numbers of studies from different research groups have been able to reach or exceed this cutoff, thus providing ample data on the reliability of scoring Rorschach data.
As with the other psychological tests reviewed in this chapter, the interpretation of a Rorschach protocol is a multiphase process. The determination of a valid protocol is the first step, and it involves a review of the number of responses (R) and a ratio known as lambda. Lambda reflects the subject’s willingness to engage in the Rorschach process. Higher lambda scores are associated with patient defensiveness or lack of involvement in the process. Protocols with fewer than 14 responses and a lambda greater than 1.00 are considered invalid (a protocol is considered valid if it has at least 14 responses and a lambda ≥ 1.00). The next step in interpretation is a review of the index scores, which are a combination of many of the individual variables. For example, scores in the S-CON index provide information about a patient’s level of self-destructiveness and have been shown to predict suicidal behavior. Therefore, protocols with a positive S-CON identify patients who are at an elevated risk for engaging in significant self-harm. After reviewing the indexes, Rorschach interpretation proceeds to the review of specific variable clusters, including Affective Organization; Capacity for Control and Stress Tolerance; Cognitive Mediation; Ideation; Information Processing; Interpersonal Perception; Self-Perception; and Situational Stress. Valid protocols will include scores or features that make up each of these clusters, allowing the examiner to assess the patient’s function in each of these areas.
The Rorschach is also an outstanding instrument for assessing the quality of a subject’s thinking and the presence of a thought disorder. The assessment of thought quality includes determining both the congruence or “fit” between what the patient saw and the contours of the blot (perceptual accuracy) and the appropriateness of the logic used to justify the response. Form Quality (FQ) reflects the fit between percept and blot and is rated on a four-point scale (superior [+], ordinary [o], unusual [u], and minus [-]). At the upper end of this scale (+, o, and to some extent u), patients use appropriate features of the blot and what they see generally corresponds to the shape of the blot where they saw the response. Poor form quality (minus responses) indicates that a patient’s response does not fit the contours of the blot and represents distorted or strained perception. For example, imagine that a patient was handed Figure 7-1 (not an actual Rorschach card) and responded as follows:

First and foremost, Figure 7-1 bears very little resemblance to a spider at a casual glance. While there may be some protrusions of black at the top left and right and, to a lesser extent, from the bottom, it is difficult to see how a common first response for most people would be spider legs. If this were an actual Rorschach card, the CS database would have a collection of many common responses taken from the normative sample to help guide the clinician’s judgment. Remember, the instructions are “What might this be?” not “What does this remind you of?” The “red eyes” described by the patient are the red areas at the top center with dots in the middle. While these could easily be seen as eyes, they do not resemble spider eyes in the least. A response that more appropriately uses the contours of the blot might be as follows:
Thematic Apperception Test
The Thematic Apperception Test (TAT) is useful in revealing a patient’s dominant motivations, emotions, and core personality conflicts.18 The TAT consists of a series of 20 cards depicting people in various interpersonal interactions that were intentionally created to be ambiguous. The TAT is administered by presenting 8 to 10 of these cards, one at a time, with the following instructions: “Make up a story around this picture. Like all good stories it should have a beginning, a middle, and an ending. Tell me how the people feel and what they are thinking.” Like the Rorschach, test examiners write each response to the card verbatim. Because the TAT cards are much less ambiguous than the Rorschach, it is very rare for an individual to be unable to generate some type of response and only one response is needed per card. Typical administration time for an eight-card set is about 30 to 45 minutes depending on the verbal ability and the motivation of the patient. Currently, no one accepted scoring method for the TAT exists, rendering it more of a “clinical technique” than a proper psychological test based on the definition provided earlier in this chapter. Nonetheless, administrations that include at least eight cards and elicit reasonably detailed stories can obtain reliable and clinically useful information.
A few standardized scoring methods have been developed for the TAT and all are limited to specific aspects of psychological function, such as the level of defense operations and the degree of psychological maturity. One method in particular that has received recent attention is the Social Cognition and Objects Relations Scale (SCORS) developed by Drew Westen for rating all types of narrative data.25,26 The SCORS consists of eight variables scored on a seven-point Likert-type scale, where lower scores indicate greater levels of pathology. The eight SCORS variables are Complexity of Representation; Affective Quality of Representation; Emotional Investment in Relationships; Emotional Investment in Values and Moral Standards; Understanding of Social Causality; Experience and Management of Aggressive Impulses; Self-Esteem; and Identity and Coherence of Self. Each TAT response is scored based on the SCORS variables and on normative data from a variety of clinical and community populations, which allows for comparison of mean scores. The interpretation of the SCORS is based on the average score for each of the eight variables across all the responses. For example, a score of 1 or 2 on the Complexity of Representations scale suggests an individual who has little ability to see people as integrated beings (with both desirable and undesirable personality characteristics). TAT stories of these individuals tend to include people who are “all good” or “all bad.” Psychologists typically assess TAT stories for emotional themes, level of emotional and cognitive integration, interpersonal relational style, and view of the world (e.g., is it seen as a helpful or hurtful place). This type of data can be particularly useful in predicting a patient’s response to psychotherapy and to the psychotherapist. In many cases, information from the TAT can be discussed directly with the patient, because many themes from the TAT stories can repeat themselves in the therapeutic relationship.
THE ASSESSMENT CONSULTATION PROCESS AND REPORT
Using the Test Results to Advance Care
Consider reviewing the relevant findings with the patient even if feedback has been given both to the referring clinician and to the patient separately. This helps confirm for the patient the value that you place on the testing and the time the patient has invested in it. Many people have reservations and unfounded fears about psychological tests. You can assure your patient that there are no tests for “craziness” and that the results themselves will not get the patient institutionalized. Asking questions (e.g., how the testing was for the patient, what concerns the patient has about the results, if the results coincide with how the patient sees himself or herself, and if the patient learned anything new as a result of the testing) can actually help strengthen the therapeutic relationship and demonstrate your concern for the patient’s well-being.27,28 A fair amount of theoretical and empirical writing has explored the similarities between the assessment process and therapy. This can be used to your advantage by listening to any stories the patient might tell you about his or her experiences in the assessment and by seeing if they can be related to any prominent themes that have arisen in your work with the patient. In many cases, pointing out these themes can help to further outline for the patient how he or she interacts with the world. If more specific questions about the testing arise during this discussion, one should consider consulting the examiner for clarification. Finally, careful consideration should be given to the recommendations from the report. In most cases, the test examiner has either given careful thought to what would be helpful to the patient and therapist, or has prior experience testing people with similar difficulties as your patient and could have access to resources that were previously unknown.
1 Meyer G. The reliability and validity of the Rorschach and Thematic Apperception Test (TAT) compared to other psychological and medical procedures: an analysis of systematically gathered evidence. In: Hilsenroth MJ, Segal DL, editors. Comprehensive handbook of psychological assessment, vol 2, Personality assessment. Hoboken, NJ: John Wiley & Sons, 2004.
2 Roid GH. Stanford Binet Intelligence Scales, ed 5, Interpretive manual: expanded guide to the interpretation of the SB5. Itasca: Riverside Publishing, 2003.
3 Matarazzo JD, Herman DO. Clinical uses of the WAIS-R: base rates of differences between VIQ and PIQ in the WAIS-R standardization sample. In: Wolman BB, editor. Handbook of intelligence: theories, measurement, and applications. New York: John Wiley & Sons, 1985.
4 Wechsler D. WAIS-III WMS-III technical manual. San Antonio, TX: Psychological Corporation, 1997.
5 Hathaway SR, McKinley JC. Minnesota Multiphasic Personality Inventory manual. New York: Psychological Corporation, 1967.
6 Butcher JN, Dahlstrom WG, Graham JR, et al. Manual foadministration and scoring of the MMPI-2. Minneapolis: University of Minnesota Press, 1987.
7 Greene R. The MMPI-2/MMPI: an interpretive manual. Boston: Allyn & Bacon, 1991.
8 Graham JR. MMPI-2: assessing personality and psychopathology. New York: Oxford University Press, 1993.
9 Blanchard DD, McGrath RE, Pogge DL, Khadivi A. A comparison of the PAI and MMPI-2 as predictors of faking bad in college students. J Pers Assess. 2003;80:197-205.
10 Harris R, Lingoes J. Subscales for the Minnesota Multiphasic Personality Inventory. Mimeographed materials. Langley Porter Clinic, 1955.
11 Harris R, Lingoes J. Subscales for the Minnesota Multiphasic Personality Inventory. Mimeographed materials. Langley Porter Clinic, 1968.
12 Butcher JN, Graham JR, Williams CL, Ben-Porath YS. Developmenuse of the MMPI-2 content scales. Minneapolis: University of Minnesota Press, 1990.
13 Millon T. The Millon Clinical Multiaxial Inventory–III manual, ed 2. Minneapolis: National Computer Systems, 1997.
14 Millon T, Meagher S. The Millon Clinical Multiaxial Inventory–III (MCMI-III). In: Hilsenroth MJ, Segal DL, editors. Comprehensive handbook of psychological assessment, vol 2, Personality assessment. Hoboken, NJ: John Wiley & Sons, 2004.
15 Morey LC. The Personality Assessment Inventory professional manual. Odessa: Psychological Assessment Resources, 1991.
16 Blais MA, Baity MR. Exploring the psychometric properties and clinical utility of the Modified Mini-Mental State Examina-tion (3MS) in a medical psychiatric sample. Assessment. 2005;12:1-7.
17 Exner JE. The Rorschach: a comprehensive system. Basic foundations and principles of interpretation, ed 3. New York: John Wiley & Sons, 1993.
18 Murray HA. Thematic Apperception Test: manual. Cambridge: Harvard University Press, 1943.
19 Exner JE. The Rorschach: a comprehensive system. Basic foundations and principles of interpretation, ed 4. New York: John Wiley & Sons, 2002.
20 Ganellen R. Weighing evidence for the Rorschach’s validity: a response to Wood et al. (1999). J Pers Assess. 2001;77:1-15.
21 Wood JM, Lilienfeld SO, Nezworski MT, Garb HN. Coming to grips with negative evidence for the Comprehensive System for the Rorschach: a comment on Gacono, Loving, and Bodholdt; Ganellan; and Bornstein. J Pers Assess. 2001;77:48-70.
22 Garb HN, Wood JM, Lilienfeld SO, Nezworski MT. Roots of the Rorschach controversy. Clin Psychol Rev. 2005;25:97-118.
23 Wood JM, Nezworski MT, Stejskal WJ. The Comprehensive System for the Rorschach: a critical examination. Psychol Sci. 1996;7:3-10.
24 Wood JM, Nezworski MT, Lilienfeld SO, Garb HN. What’s wrong witRorschach? Science confronts the controversial inkblot test. San Francisco: Jossey-Bass, 2003.
25 Hilsenroth MJ, Stein M, Pinkster J: Social Cognition and Object Relations Scale: Global rating method (SCORS-G). Unpublished manuscript. Garden City, NY, 2004, Derner Institute of Advanced Psychological Studies, Adelphi University.
26 Westen D: Social Cognition and Object Relations Scale: Q-sort for Projective Series (SCORS-Q). Unpublished manuscript. Cambridge, 1995, Cambridge Hospital and Harvard Medical School.
27 Ackerman SJ, Hilsenroth MJ, Baity MR, Blagys MD. Interaction of therapeutic process and alliance during psychological assessment. J Pers Assess. 2000;75:82-109.
28 Finn SE, Tonsager ME. Information-gathering and therapeutic models of assessment: complementary paradigms. Psychological Assessment. 1997;9:374-385.