7: Pericardial structure and function

Published on 02/03/2015 by admin

Filed under Internal Medicine

Last modified 22/04/2025

Print this page

rate 1 star rate 2 star rate 3 star rate 4 star rate 5 star
Your rating: none, Average: 0 (0 votes)

This article have been viewed 1515 times

Topic 7 Pericardial structure and function

The normal pericardium is ~2 mm thick, and consists of three layers: the outer fibrous pericardium, and the inner serous pericardium, which is divided into visceral and parietal layers. The visceral serous pericardium forms the epicardial surface, and the parietal serous pericardium lines the fibrous pericardium.

The visceral serous pericardium covers the left and right ventricles, and right atrium. It extends over the first 1–2 cm of the great vessels entering and leaving the heart, before reflecting back as the parietal serous pericardium. Posterior to the left atrium, the reflection occurs at the oblique sinus, leaving the posterior aspect of the left atrium as extrapericardial (see Figure 7.1).
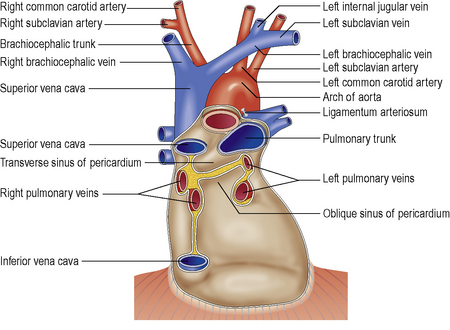
The pericardial space normally contains <50 ml of serous fluid. An increase in pericardial fluid volume is known as a pericardial effusion.

The pericardium is normally compliant and flexible, transmitting intrathoracic pressure changes to the cardiac chambers within. The normal parietal pericardium has a tensile strength similar to rubber. Small distending forces lead to large amounts of stretch. As the pericardium stretches, stiffening increases, and it progressively resists further distension. Therefore the pericardium restricts acute ventricular dilatation. In contrast, slowly accumulating effusions can stretch the pericardial sac, allowing potentially large volumes of fluid (>1.5 L) to be contained without significant intrapericardial pressure rises. However, once a stretch limit is reached, chronic accumulating fluid will rapidly increase pericardial pressure (from <5 mmHg up to 20 mmHg), with the development of cardiac tamponade.

Thickening and rigidity of the pericardial sac following chronic inflammation, for example from post pericardiotomy or tuberculous pericarditis, may result in loss of normal compliance.

The outcome is constrictive pericarditis (CP), which is characterized by two pathophysiological phenomena:

The characteristic physiological finding is a failure of the normal pressure gradient driving PV–LA–LV blood flow and left ventricular filling during inspiration. This leads to equalization of LV, LA/PCWP and RV diastolic pressures, with impairment of LV filling during inspiration. This is further exacerbated by increased RV filling, with bowing of the interventricular septum to the left.

Conversely during expiration LV filling increases, the septum is shifted to the right impairing RV filling within the fixed volume of the rigid pericardial sac. The movement of the septum from left to right and back with the respiratory cycle is detectable using echocardiography or CMR as the characteristic septal ‘bounce’.

The pericardium appears thicker (>2 mm), and may be calcified. Further suggestive features include IVC dilatation, reversal of hepatic or IVC venous flow during diastole. Normally diastolic forward flow is greater than systolic forward flow in the hepatic veins. In constrictive pericarditis (and restrictive cardiomyopathy) hepatic veins, IVC and SVC are dilated, without inspiratory collapse. Hepatic vein diastolic flow reversal may be detectable in addition to forward flow, particularly during inspiration, whereas flow reversal is absent in the normal heart. In the SVC this inspiratory flow reversal may be evident, and underlies the basis for Kussmaul’s sign.

Differentiating CP from restrictive cardiomyopathy (RCM) is a classical clinical challenge, as both conditions have similar/overlapping physiology, signs and investigations. Tissue Doppler may be helpful, as mitral annular motion is generally increased in CP, whereas it is significantly reduced in myocardial disease states including RCM. The early diastolic velocity E′ is increased in CP, and reduced below 7 cm/s (normal >7 cm/s) in myocardial disease. Therefore an increased E′ >7 cm/s in the setting of a restrictive filling pattern (E/A > 1.5, E deceleration time <160 ms) is suggestive of CP rather than myocardial disease.

The E/E′ ratio is increased in CP, and is inversely proportional to PCWP (annulus paradoxus).