TOPIC 5 Ventricular function
Athlete’s heart
Haemodynamics
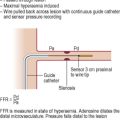
Invasive measurements
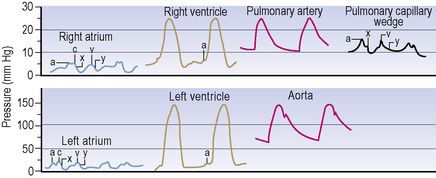

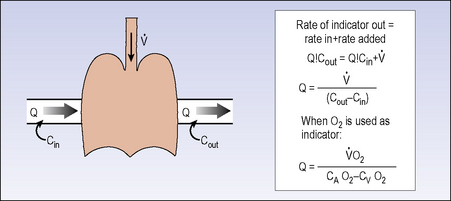
Figure 5.5 The Fick equation for calculation of cardiac output from arteriovenous oxygen gradient and VO2.


Table 5.3 Normal ranges for cardiac output and resistance indices
| Index | Normal range |
|---|---|
| Resting cardiac output (CO) | 4–6 L/min |
| Cardiac index (CI) | 2.5–4.0 L/min/m2 |
| Stroke volume (SV) | 75–105 ml |
| Stroke volume index (SVI) | 40–70 ml/m2 |
| Stroke work index (SWI) | 40–80 g/m/m2 |
| Pulmonary vascular resistance (PVR) |
Pressure–volume analysis
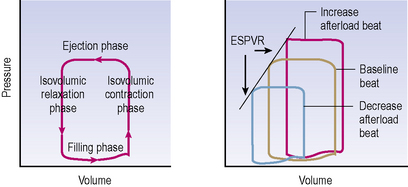
Simultaneous pressure and volume recording using high-fidelity micromanometers and conductance catheters allows construction of pressure–volume loop relationships. These allow recording of PV relations during steady state and with dynamic manoeuvres such as preload or afterload alteration to provide load-independent measures of chamber function (see Figure 5.6).
Non-invasive measurements
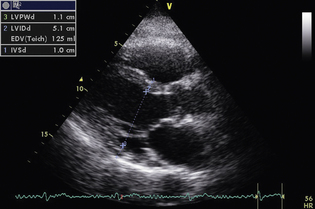
Echo

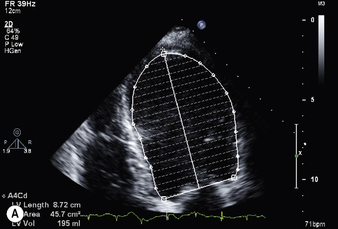
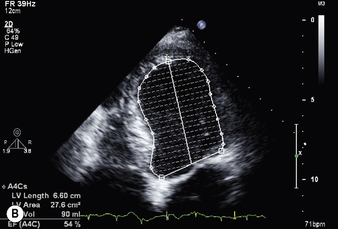
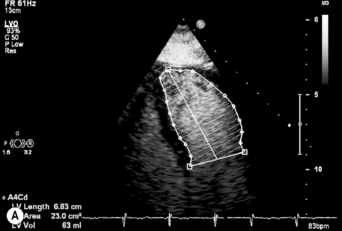
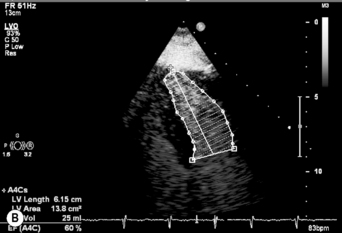
Ejection fraction (EF) is the most common measurement used to report left ventricular function, and represents the % change in LV volume between systole and diastole. Simpson’s rule is used to calculate LV volume and EF from 2D measurements. It derives volume from a cubic relationship, assuming the LV cavity is ellipsoidal (see Figure 5.7):


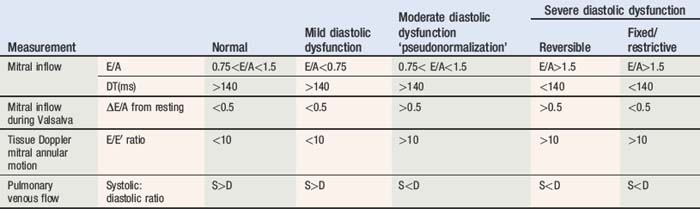
Diastolic function
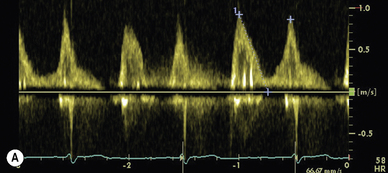
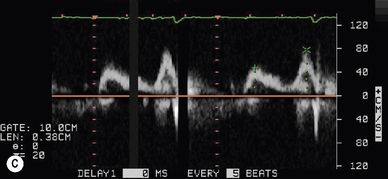
Doppler assessment of the transmitral filling pattern is a measure of ventricular diastolic compliance. The transmitral filling pattern consists of two waves, E and A (see Figures 5.8 and 5.9). The E wave reflects passive filling during early (auxotonic) diastole, and the A wave is generated by atrial systole ejecting blood into the ventricle.
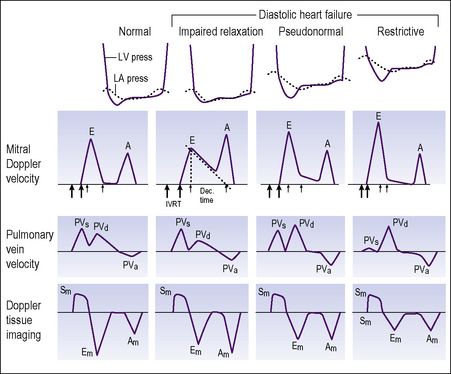
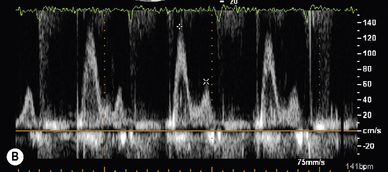
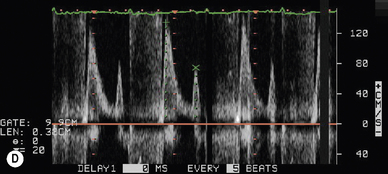
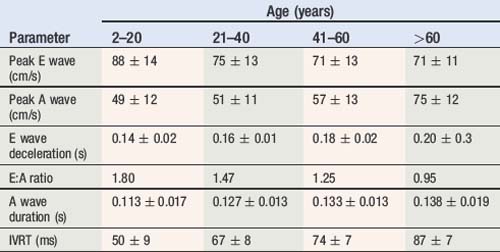
The peak amplitude of the E and A waves, E wave deceleration time and the E:A ratio are measured to determine whether diastolic dysfunction is present. The E wave is usually greater than the A wave, but this varies with gender (see Table 5.5) and age (see Table 5.6). Peak E wave amplitude, E wave deceleration and the E:A ratio tend to fall with age in normal subject. This reflects the compliant younger ventricle, with 80–85% of diastolic filling occurring during the first two thirds of diastole. As the individual ages, atrial contraction contributes an increasing proportion of diastolic filling, with E and A waves peak velocities becoming equal (E:A ratio = 1) in the sixth or seventh decade.
Table 5.5 Normal transmitral Doppler flow indices and influence of gender
| Parameter | Male | Female |
|---|---|---|
| Peak E wave (cm/s) | 66 ± 15 | 70 ± 16 |
| Peak A wave (cm/s) | 67 ± 16 | 72 ± 18 |
| E wave deceleration (s) | 0.21 ± 0.04 | 0.19 ± 0.04 |
| E:A ratio | 1.04 ± 0.38 | 1.03 ± 0.34 |
| E-at-A wave velocity (cm/s) | <20 | <20 |


Tissue Doppler
A normal spectral display recorded from the basal lateral left ventricular segment is presented in Figure 5.8.


E/E′ ratio is a measurement used to predict LA pressure. Normal range <10..
Right atrial and right ventricular function
IVC collapse normally >50% with inspiratory effort if RA pressure <10 mmHg
Table 5.9 Right atrial pressure estimation using IVC collapse and hepatic vein flow
| Mean RAP (mmHg) | IVC collapse (%) | Hepatic vein flow |
|---|---|---|
| 0–5 | >50 | VS > VD |
| 5–10 | >50 | VS = VD |
| 10–15 | <50 | VS < VD |
| >20 | <50 | Diastolic flow only |
In vivo haemodynamic monitoring
Table 5.10 Intracardiac haemodynamic monitoring in patients with normal cardiac function
| 24 hour ambulatory value (median) | Resting value (minimum nighttime) | |
|---|---|---|
| RVSP (mmHg) | 25 | 15 |
| RVDP (mmHg) | 4 | 1 |
| ePAD (mmHg) | 9 | 4 |
| +RV dPdt (mmHg/s) | 350 | 200 |
RVSP = right ventricular systolic pressure, RVDP = right ventricular diastolic pressure, estimated pulmonary artery diastolic pressure (ePAD) = RV pressure at point of PV opening = RV pressure at time of maximum +dPdt, +RV dPdt = maximum right ventricular dPdt.
Intrathoracic impedance monitoring
Normal threshold <60 Ω·d (76.9% sensitivity, 1.5 false positive results per patient year)
MVO2 exercise testing
Reporting MVO2 as a percentage of predicted MVO2 for the individual is more useful:
If MVO2 <80% predicted and RQ >1.05 – cardiac limitation of exercise.
If MVO2 <80% predicted and RQ <1.05 – non cardiac limitation of exercise e.g. check FEV1/FVC.

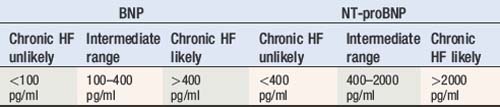
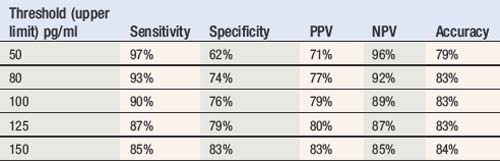
Serum natriuretic peptides
Table 5.11 shows approximate normal and abnormal ranges for diagnosis of chronic heart failure in untreated patients, although these are sensitive to the assay and local laboratory values may vary. The sensitivity and specificity may also vary depending upon the value selected as upper limit of normal. The variation of sensitivity, specificity, positive predictive value (PPV), negative predictive value (NPV) and extrapolated accuracy for BNP in the diagnosis of chronic heart failure are also presented in Table 5.11 (see also Table 5.12).
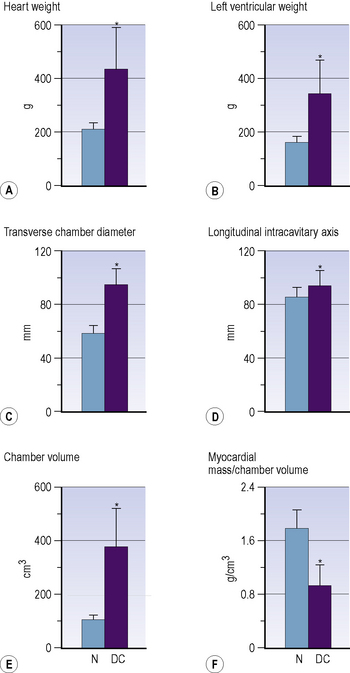
Dilated cardiomyopathy
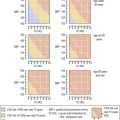
The formal diagnosis requires the left ventricle to be dilated with the internal end-diastolic dimension (LVEDD) > 2.7 m2 of body surface area and either ejection fraction < 45% or M-mode fractional shortening <30%. However, the normal distribution of ventricular dimension across the healthy population results in 1–2.5% of healthy individuals fitting either of these parameters (Figure 5.10).