Part 4 Common Diagnostic and Laboratory Tests
ARTERIAL BLOOD GAS ANALYSIS
Blood gas interpretation is based on assessing the arterial serum levels of the following variables:
| ABG COMPONENT | NORMAL LEVELS |
|---|---|
| pH | 7.35-7.45 |
| PaCO2 | 35-45 mmHg |
| HCO3 | 22-26 mEq/liter |
| PaO2 | 90-110 mmHg |
Consistent Approach Is Key
1. Evaluate pH to determine the presence of acidosis or alkalosis. The lungs and kidneys regulate the hydrogen ion status within the plasma. Alterations in these systems affect the acid-base balance, causing pH changes that affect multiple body systems.
Within normal limits (WNL) indicates normal or compensated state.
2. Evaluate PaCO2 to assess the alveolar ventilation status. In an uncompensated acidosis or alkalosis, an abnormal PaCO2 level will generally indicate that the origin of the pH imbalance is respiratory rather than metabolic.
Within normal limits—adequate ventilation
3. Evaluate HCO3 to assess the effectiveness of renal regulation of blood pH. In an uncompensated acidosis or alkalosis, an abnormal HCO3 level will generally indicate that the origin of the pH imbalance is metabolic rather than respiratory.
Within normal limits—normal renal function
4. Look for signs of compensation—With prolonged abnormalities in pH, the body tries to return the pH to normal through respiratory compensation (adjusting PaCO2 levels) or metabolic compensation (adjusting HCO3 levels). In compensated acidosis or alkalosis, the pH will be normal, but the PaCO2 and HCO3 will both be abnormal in the same “direction” (increased or decreased).
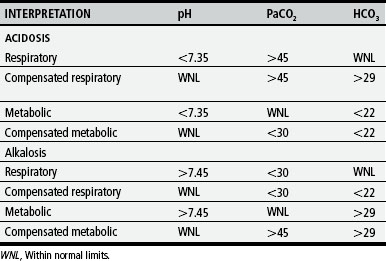
5. Evaluate PaO2 to assess the oxygenation status. It is important to be aware of a patient’s specific “normal” values. Patients with certain cardiac or pulmonary conditions may have “acceptable” PaO2 that is below normal limits. Assess each patient’s unique needs, and treat accordingly.
BRONCHOSCOPY
BOX 4-1 Bronchoscopy
Bronchoscopy is the direct observation of tracheobronchial tree via bronchoscope.
Localizes abnormalities in major airways
Provides access to (1) remove aspirated foreign bodies from major airways, (2) remove obstructive mucous plugs, (3) perform bronchial lavage, (4) directly observe and assess anatomic structures of airway for any pathology.
Procedure requires sedation and monitoring of vital signs during and after procedure until child is awake and alert.
CARDIAC CATHETERIZATION AND COMMON CARDIOLOGY TESTS
TABLE 4-3 Cardiac Catheterization and Common Cardiology Tests
| PROCEDURE | DESCRIPTIVE |
|---|---|
| Chest radiograph (X-ray) | Produces images of internal structures of chest, including air-filled lungs, airways, vascular markings, heart, and great vessels; shows heart size |
| Electrocardiography (ECG) | Graphic measure of electrical activity of heart |
| Holter monitor | 24-hour continuous ECG recording used to assess dysrhythmias |
| Echocardiography | Use of high-frequency sound waves obtained by a transducer to produce an image of cardiac structures |
| Transthoracic | Performed with transducer on chest |
| M-mode | One-dimensional graphic view used to estimate ventricular size and function |
| Two-dimensional (2-D) | Real-time, cross-sectional views of heart used to identify cardiac structures and cardiac anatomy |
| Doppler | Identifies blood flow patterns and pressure gradients across structures |
| Fetal | Imaging fetal heart in utero |
| Transesophageal (TEE) | Transducer placed in esophagus behind heart to obtain images of posterior heart structures or in patients with poor images from chest approach |
| Cardiac catheterization | Imaging study using radiopaque catheters placed in a peripheral blood vessel and advanced into heart to measure pressures and oxygen levels in heart chambers and visualize heart structures and blood flow patterns |
| Hemodynamics | Measures pressures and oxygen saturations in heart chambers |
| Angiography | Use of contrast material to illuminate heart structures and blood flow patterns |
| Biopsy | Use of special catheter to remove tiny samples of heart muscle for microscopic evaluation; used in assessing infection, inflammation, or muscle dysfunction disorders; also used to evaluate for rejection after heart transplant |
| Electrophysiology (EPS) | Special catheters with electrodes employed to record electrical activity from within heart; used to diagnose rhythm disturbances |
| Exercise stress test | Monitoring of heart rate, blood pressure, electrocardiogram (ECG), and oxygen consumption at rest and during progressive exercise on a treadmill or bicycle |
| Cardiac magnetic resonance imaging (MRI) | Noninvasive imaging technique; used in evaluation of vascular anatomy outside of heart (e.g., coarctation of the aorta, vascular rings), estimates of ventricular mass and volume; uses for MRI are expanding |
COMPLETE BLOOD CELL COUNT
| TEST (AVERAGE VALUE) | DESCRIPTION/COMMENTS |
|---|---|
| Red blood cell (RBC) count (4.5-5.5 million/mm3) |
Average or mean quantity (weight) of Hgb in a single RBC
MCH values are expressed as picograms (pg) or micromicrograms (μmcg)
MCV and MCH depend on accurate counts of RBCs, whereas MCHC does not; therefore, MCHC is often more reliable.
All indexes depend on average cell measurements and do not show individual RBC variations (anisocytosis).
Index of production of mature RBCs by bone marrow
Decreased count indicates depressed bone marrow function.
Increased count indicates erythrogenesis in response to some stimulus.
When reticulocyte count is extremely high, other forms of immature RBCs (normoblasts, even erythroblasts) may be present.
* Hemoglobin values may vary according to the child’s age and gender.
COMMON NEUROLOGIC TESTS
| TEST | DESCRIPTION | PURPOSE |
|---|---|---|
| Lumbar puncture (LP) | Spinal needle is inserted between L3-L4 or L4-L5 vertebral spaces into subarachnoid space; cerebrospinal fluid (CSF) pressure is measured, and sample is collected for examination. |
PULMONARY FUNCTION TESTS
| TEST | MEASUREMENT | SIGNIFICANCE |
|---|---|---|
| Forced vital capacity (FVC) (peak flow) | Maximum amount of air that can be expired after maximum inspiration |
RADIOLOGIC EXAMS
| TEST | DESCRIPTION | PURPOSE |
|---|---|---|
| Radiography | Pictures obtained by passing X-rays through the body and recording them on sensitized film | Produces images of internal structures of chest, including air-filled lungs, airways, vascular markings, heart, and great vessels |
| Fluoroscopy | Projection of electronically intensified image on viewing screen |
UROLOGIC DIAGNOSTIC TESTS
| TEST | PROCEDURE | PURPOSE |
|---|---|---|
| Renal/bladder ultrasound | Transmission of ultrasonic waves through renal parenchyma, along ureteral course, and over bladder |
DTPA radioisotope used to measure glomerular filtration rate; estimate of differential renal function and renal washout to determine presence and location of upper urinary tract obstruction
DMSA radioisotope allows visualization of renal scars and differential renal function; ureters and bladder are not visualized.
MAG 3 radioisotope combines features of DTPA (evaluation of upper urinary tract obstruction) with features of DMSA radioisotope (differential renal function).
Set of tests designed to measure bladder filling, storage, and evacuation functions
Uroflowmetry is a test to determine efficiency of urination.
Cystometrogram is a graphic comparison of bladder pressure as a function of volume.
Voiding pressure study is a comparison of detrusor contraction pressure, sphincter electromyelogram, and urinary flow.
| CELL COUNT | CELLS/MM3 |
|---|---|
| Preterm | |
| Newborn | |
| Neonate | |
| Thereafter | 0-5 mononuclear |
| LEUKOCYTE DIFFERENTIAL COUNT | PERCENT (%) |
| Lymphocytes | 62±34 |
| Monocytes | 36±20 |
| Neutrophils | 2±5 |
| Eosinophils | 0-rare |
| Glucose | 40-70 mg/dL* (adult values) |
| Protein | 8-32 mg/dL |
† Obtain CSF for analysis: cell count, protein, glucose, culture and sensitivity, Gram stain