CHAPTER 24 Capnography
4 Describe the capnographic waveform
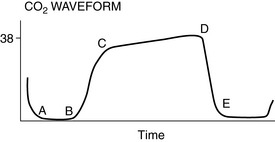
The important features include baseline level, the extent and rate of rise of CO2, and the contour of the capnograph. Capnograms may be evaluated breath by breath, or trends may be assessed as valuable clues to a patient’s physiologic status. There are four distinct phases to a capnogram (Figure 24-1). The first phase (A–B) is the initial stage of exhalation, in which the gas sampled is dead space gas, free of CO2. At point B, there is mixing of alveolar gas with dead space gas, and the CO2 level abruptly rises. The expiratory or alveolar plateau is represented by phase C–D, and the gas sampled is essentially alveolar. Point D is the maximal CO2 level, the best reflection of alveolar CO2, and is known as ETCO2. Fresh gas is entrained as the patient inspires (phase D–E), and the trace returns to the baseline level of CO2, approximately zero.
5 What may cause elevation of the baseline of the capnogram?
The baseline of the capnogram may not return to zero at high respiratory rates. However, if the baseline is elevated more than approximately 2 mm Hg CO2, the patient is receiving CO2 during inspiration, and this is often termed rebreathing (Figure 24-2). Possible causes of rebreathing include the following:


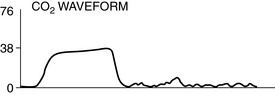
8 What might result in sudden loss of capnographic waveform?
A sudden loss of capnographic waveform (Figure 24-3) may be caused by the following:


9 What process might lead to decreases in ETCO2?
Rapid decreases in CO2 waveforms may be associated with the following:


Other, and usually less dramatic, decreases in ETCO2 may be caused by the following:


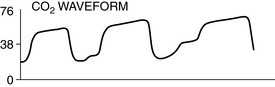
10 What processes may increase ETCO2?
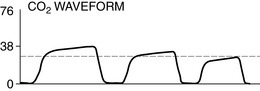
ETCO2 values may rise gradually secondary to the following (Figure 24-5):


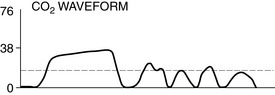
11 What processes can change the usual configuration of the waveform?
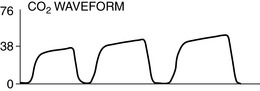
Asthma and chronic obstructive pulmonary diseases cause a delayed upslope and steep alveolar plateau (Figure 24-6).
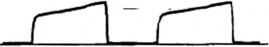
A commonly seen abnormal capnogram results when the patient makes spontaneous respiratory efforts and inhales before the next mechanical inspiration. This characteristic cleft in the alveolar plateau is a useful clinical sign indicating that the patient has started to breathe (Figure 24-7). Finally, a cuff leak may result in variable early decreases in the normal waveform configuration (Figure 24-8). Waveforms that are irregular and unlike neighboring waveforms may be caused by manipulation against the diaphragm by the surgeons, pressure of a surgeon against the chest wall, percussing against an abdomen distended by CO2, or spontaneous breathing out of phase with mechanical ventilation.
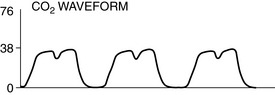
Figure 24-7 A cleft in the alveolar plateau usually indicates partial recovery from neuromuscular blockade. Surgical manipulation against the inferior surface of the diaphragm or weight on the chest may produce similar though usually other irregular waveforms as seen in Figure 24-8.