[level-membership-for-anesthesiology-category]
CHAPTER 23 Pulse Oximetry
5 How is oxygen saturation determined from the amount of red and infrared light received and absorbed?
6 How does the pulse oximeter determine the degree of arterial hemoglobin saturation?
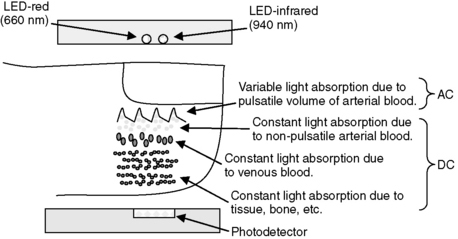
In the vascular bed being monitored, the amount of blood is constantly changing because of the pulsation caused by each heart beat. Thus the light beams pass not only through a relatively stable volume of bone, soft tissue, and venous blood, but also through arterial blood, which is made up of a nonpulsatile portion and a variable, pulsatile portion. By measuring transmitted light several hundred times per second, the pulse oximeter is able to distinguish the changing, pulsatile component (AC) of the arterial blood from the unchanging, static component of the signal (DC) made up of the soft tissue, venous blood, and nonpulsatile arterial blood. The pulsatile component (AC), generally comprising 1% to 5% of the total signal, can then be isolated by canceling out the static components (DC) at each wavelength (Figure 23-1).

8 How does the R/IR ratio relate to the oxygen saturation?
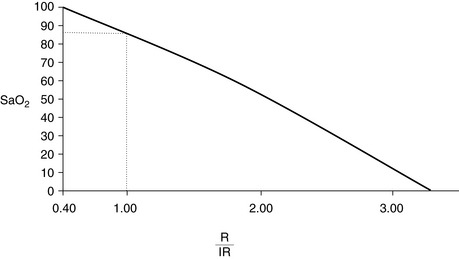
The normalized R/IR ratio is compared to a preset algorithm that gives the microprocessor the percentage of oxygenated hemoglobin in the arterial blood (the oxygen saturation percentage), and this percentage is displayed. This algorithm is derived from volunteers, usually healthy individuals who have been desaturated to a level of 75% to 80%; their arterial blood gas is drawn, and saturation measured in a standard laboratory format. Manufacturers keep their algorithms secret, but in general an R/IR ratio of 0.4 corresponds to a saturation of 100%, an R/IR ratio of 1.0 corresponds to a saturation of about 87%, and an R/IR ratio of 3.4 corresponds to a saturation of 0% (Figure 23-2).
9 What is the oxyhemoglobin dissociation curve?
It is a curve that describes the relationship between oxygen tension and binding (percentage oxygen saturation of hemoglobin) (Figure 23-3). Efficient oxygen transport relies on the ability of hemoglobin to reversibly load and unload oxygen. The sigmoid shape of the curve facilitates unloading of oxygen in the peripheral tissues, where the PaO2 is low. At the capillary level a large amount of oxygen is released from the hemoglobin, resulting in a relatively small drop in tension. This allows an adequate gradient for diffusion of oxygen into the cells and limits the degree of hemoglobin desaturation. The curve may be shifted to the left or right by many variables (Table 23-1).
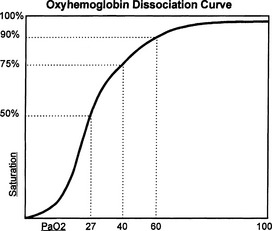
TABLE 23-1 Left and Right Shifts of the Oxyhemoglobin Dissociation Curve
| Right Shift | Left Shift |
|---|---|
| Effects: |
Hb = hemoglobin, 2, 3-DPG = 2, 3-diphosphoglycerate.
10 Why might the pulse oximeter give a false reading? Part 1—not R/IR related
 The algorithm that the pulse oximeter uses to determine the saturation loses significant accuracy as saturation drops below 80% because, as mentioned, healthy volunteers have historically been used to establish these algorithms, and it would be unethical to desaturate someone below 80%. Therefore the percentage saturation below 75% to 80% is extrapolated from these data. As the saturation lowers, it becomes less accurate.


11 Why might the pulse oximeter give a false reading? Part 2—R/IR related
 Optical shunting takes place when some of the light from the LED does not pass through the vascular bed before reaching the detector and is a result of poor, incomplete probe placement. The R/IR number trends toward 1.0 (87%) and results in a falsely low measurement for a patient who is actually better saturated. However, if it occurs in a patient who is difficult to ventilate and is desaturating, falsely high measurement will be displayed regardless of how hypoxic the patient becomes.


15 Since the patient is oxygenated before anesthetic induction, if the pulse oximeter reaches 100%, does this indicate complete denitrogenation?
17 Are there complications associated with the use of pulse oximetry probes?
KEY POINTS: Pulse Oximetry 

1. Barker S. Motion-resistant pulse oximetry: a comparison of new and old models. Anesth Analg. 2002;95:967-972.
2. Moyle J. Pulse oximetry, ed 2. London: BMJ Publishing Group, 2002.
3. Pedersen T., Moller A., Pedersen B. Pulse oximetry for perioperative monitoring: systematic review of randomized, controlled trials. Anesth Analg. 2003;96:426-431.
[/level-membership-for-anesthesiology-category][not-level-membership-for-anesthesiology-category]
CHAPTER 23 Pulse Oximetry
5 How is oxygen saturation determined from the amount of red and infrared light received and absorbed?
6 How does the pulse oximeter determine the degree of arterial hemoglobin saturation?
In the vascular bed being monitored, the amount of blood is constantly changing because of the pulsation caused by each heart beat. Thus the light beams pass not only through a relatively stable volume of bone, soft tissue, and venous blood, but also through arterial blood, which is made up of a nonpulsatile portion and a variable, pulsatile portion. By measuring transmitted light several hundred times per second, the pulse oximeter is able to distinguish the changing, pulsatile component (AC) of the arterial blood from the unchanging, static component of the signal (DC) made up of the soft tissue, venous blood, and nonpulsatile arterial blood. The pulsatile component (AC), generally comprising 1% to 5% of the total signal, can then be isolated by canceling out the static components (DC) at each wavelength (Figure 23-1).
8 How does the R/IR ratio relate to the oxygen saturation?
The normalized R/IR ratio is compared to a preset algorithm that gives the microprocessor the percentage of oxygenated hemoglobin in the arterial blood (the oxygen saturation percentage), and this percentage is displayed. This algorithm is derived from volunteers, usually healthy individuals who have been desaturated to a level of 75% to 80%; their arterial blood gas is drawn, and saturation measured in a standard laboratory format. Manufacturers keep their algorithms secret, but in general an R/IR ratio of 0.4 corresponds to a saturation of 100%, an R/IR ratio of 1.0 corresponds to a saturation of about 87%, and an R/IR ratio of 3.4 corresponds to a saturation of 0% (Figure 23-2).
