CHAPTER 22 Electrocardiography
3 Is electrocardiography sensitive or insensitive for detecting chamber enlargement and hypertrophy?
5 An adult has a large R wave in V1. What is the differential diagnosis?


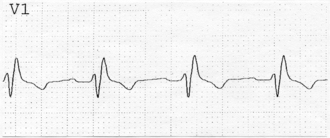
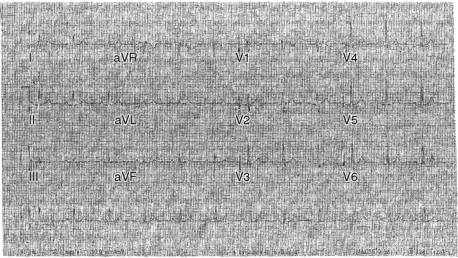
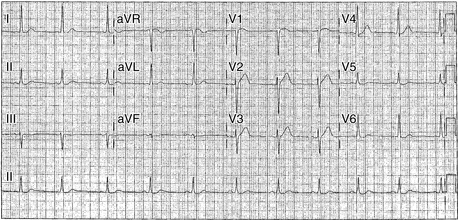
7 What are the characteristics of a right bundle-branch block?
Patients with RBBB typically have an rSR′ pattern in V1 and a broad terminal S wave in I and V6 (Figure 22-1).
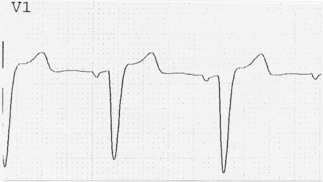
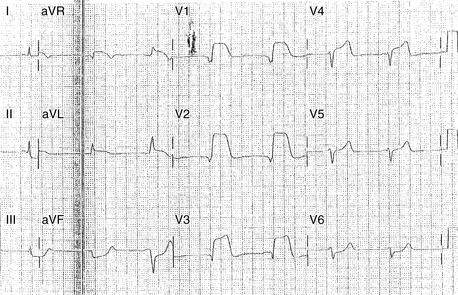
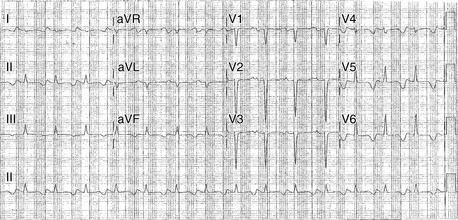
9 What are the characteristics of a left bundle-branch block?
In V1 there is a broad, deep S wave (or QS wave), with ST segment elevation, that may be preceded by a very narrow R wave (Figure 22-2). In lead I there is a broad R wave (sometimes notched) without a Q or S wave.
11 You are attempting to pass a Swan-Ganz catheter into the pulmonary artery in a patient with LBBB. When the hemodynamic tracing suggests that the catheter tip is in the right ventricle, the patient suddenly becomes bradycardic, with a heart rate of 25. What happened?
12 Does a normal ECG exclude the possibility of severe coronary artery disease?
For an example of ECG findings noted in a patient with exertional angina, see Figure 22-3.
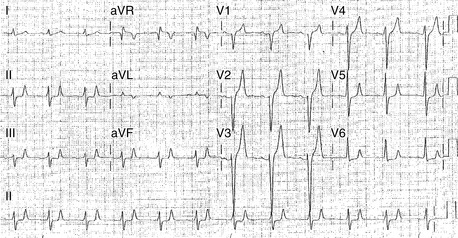
13 How are patients with myocardial infarction subdivided on the basis of ECG changes during infarction?
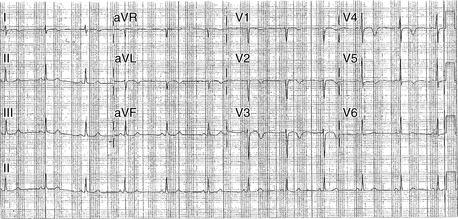
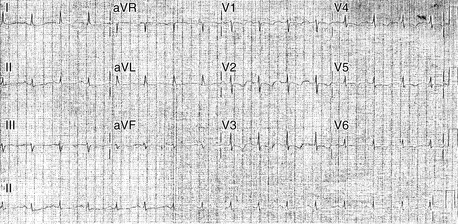
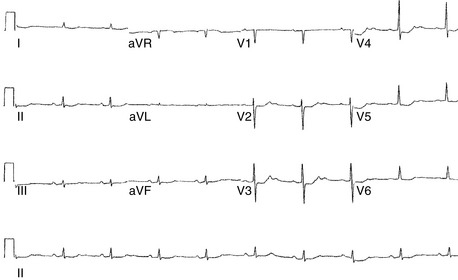
For an example of ECG changes associated with a non-ST segment elevation MI, see Figures 22-4 and 22-5.
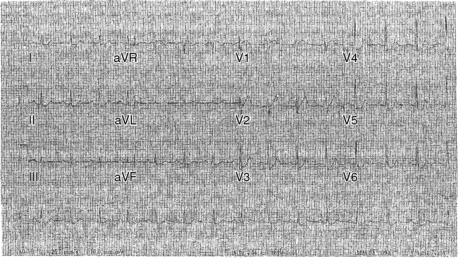
Figures 22-4 and 22-5 These ECGs are from the same patient, a vigorous 78-year-old with new chest pain that began after moderate exertion. Figure 22-4 was obtained while the patient was in an emergency room with persistent chest pain. The main finding is significant ST segment depression in the anterolateral precordial leads. The chest pain and ST segment changes resolved over the next 30 minutes (see Figure 22-5). Troponin I serum levels were mildly elevated. Because the pain was provoked by minimal exertion, with significant ECG abnormalities and abnormal troponin I, coronary angiography was performed instead of stress testing. Significant left main and multivessel coronary artery disease (CAD) was found, and the patient underwent successful coronary artery bypass surgery. In this example the suspicion of CAD was very strong, based on the ECG changes and clinical characteristics. However, more modest degrees of ST depression are less specific for coronary insufficiency, particularly when differences are subtle and when there is a potential alternative explanation (electrolyte imbalance, digoxin effect, or repolarization abnormality from left ventricular hypertrophy).
14 Does ST-segment elevation always indicate a myocardial infarction?
No. Other causes of ST-segment elevation are listed in Table 22-1.
| Acute subepicardial injury (i.e., acute ST-segment elevation myocardial infarction) | HypercalcemiaLeft ventricular hypertrophy |
| Early repolarization pattern | Left bundle-branch block |
| Pericarditis | Brugada syndrome |
| Hyperkalemia | Normal variant |
15 For patients with ST-segment elevation myocardial infarction, how is the location identified?


For an example of an ST segment elevation MI, see Figure 22-6.
16 A patient has evidence on ECG of an acute inferior myocardial infarction. What associated findings should you look for?
 Evidence of right ventricular involvement. Since V1 is really a right-sided lead, ST elevation in V1 accompanying an inferior MI suggests right ventricular involvement. Alternatively you may check right-sided leads over the right precordium. ST elevation of 1 mm in right-sided V4 or V5 indicates RV infarction.

 Evidence of bradycardia caused by sinoatrial (SA) or atrioventricular (AV) nodal block. Patients with inferior MI may require atropine and/or temporary pacing (Figure 22-7).
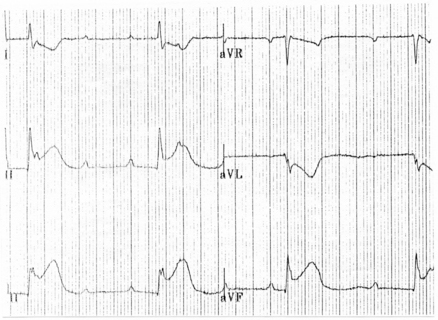
Figure 22-7 Limb leads from a patient with inferior myocardial infarction and complete heart block (see Chapter 30). The patient has ST segment elevation in II, III, and aVF, along with ST segment depression in I and aVL (reciprocal change). Complete heart block is indicated by atrioventricular dissociation with the atrial rate (≈110) greater than the ventricular rate (≈40/min) with a regular RR interval.
17 What is reciprocal change? Why is it important?
Reciprocal change is ST-segment depression that occurs in patients with an ST-elevation MI. For example, a patient with an inferior MI may have ST elevation in II, III, and aVF, with ST depression (reciprocal change) in I and aVL. Not all patients with ST-elevation MI have reciprocal change, but when it is seen, it generally confirms the diagnosis of acute MI (see Figure 22-7).
19 An elderly patient presents with fatigue, confusion, and atrial fibrillation with a slow ventricular response (heart rate = 40). The ECG demonstrates ST depression that is concave upward. The family states that the patient is on an unknown medication that is locked in his apartment. What laboratory test should you order to confirm your suspicion?
20 An ECG recorded when the operating room nurse is scrubbing the patient’s chest demonstrates wide complex electrical activity. The patient is asymptomatic. What do you suspect? How can you prove that you are correct when you analyze the ECG tracing?
21 What ECG findings suggest hyperkalemia?
QRS widening and/or peaked T waves (Figure 22-8). In the worst cases the ECG looks like a sine wave.
22 What ECG findings suggest hypokalemia?
U waves (which occur after the T wave) are prominent and may merge with the T wave, creating a broad T wave and a prolonged QT interval. In addition, the P wave may be amplified, and ST depression may occur (Figures 22-9 and 22-10).
23 What ECG findings suggest hypocalcemia?
The QT interval is prolonged without broadening of the T wave (in contrast to the situation with hypokalemia). The T wave appears to be pushed away from the QRS complex. See Figure 22-11.
24 What ECG changes suggest hypercalcemia?
Shortening of the QT interval, with or without ST segment elevation (Figure 22-12).

25 What are some of the common causes of a prolonged QT interval?
 Abnormal electrolytes, especially hypokalemia, hypocalcemia, and hypomagnesemia, can contribute to lengthening of the QT.


Many patients have QT prolongation from a combination of the above factors. For example, a patient with congenital long QT syndrome may have more extreme prolongation with the addition of a new drug or electrolyte abnormality. In some cases these multifactorial processes can result in life-threatening ventricular arrhythmias such as torsades de pointes (see Chapter 30).
26 A patient has a right bundle-branch block that is new compared to the ECG from 2 years ago. How should I proceed?
27 A patient has a left bundle-branch block that is new compared to the ECG from 2 years ago. How should I proceed?

1. Bowbrick S., Borg A.N. ECG complete. New York: Churchill Livingstone, 2006.
2. Ellis K.M. EKG Plain and simple, ed 2. Prentice Hall: Upper Saddle River, New Jersey, USA, 2007.
3. Kilgfield P., Lauer M.S. Exercise electrocardiogram resting: beyond the ST segment. Circulation. 2006;114:2070-2082.
4. Lanza G.A. The clectrocardiogram as a prognostic tool for predicting major cardiac events. Prog Cardiovasc Dis. 2007;50:87-111.
5. Nelson W.P., Marriott H.J.L., Schocken D.D. Concepts and cautions in electrocardiography, ed 1. MedInfo: Northglenn, Colorado, USA, 2007.
6. Roden D.M. Drug-induced prolongation of the QT interva. N Engl J Med. 2004;350:1013-1022.
7. Sgarbossa E.B., Pinski S.L., Barbagelata A., et al. Electrocardiographic diagnosis of evolving acute myocardial infarction in the presence of left bundle-branch block. N Engl J Med. 1996;334:481-487.
8. Surawicz B., Kailans T.K. Chou’s electrocardiography in clinical practice: adult and pediatric, ed 6. Philadelphia: Saunders, 2008.
9. Wagner G.S. Marriott’s practical electrocardiography, ed 11. Philadelphia: Lippincott, Williams & Wilkins, 2007.
10. Wang K., Asinger R.W., Marriott H.J.L. ST-segment elevation in conditions other than acute myocardial infarction. N Engl J Med. 2003;349:2128-2135.
