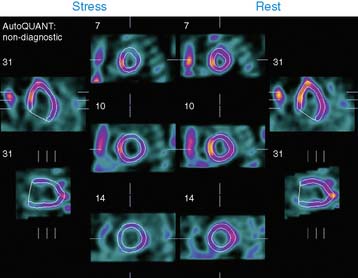
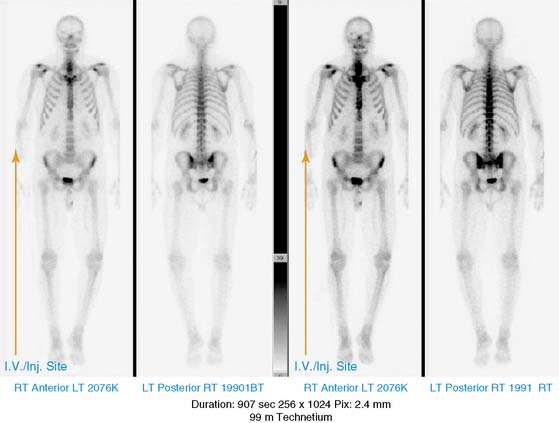
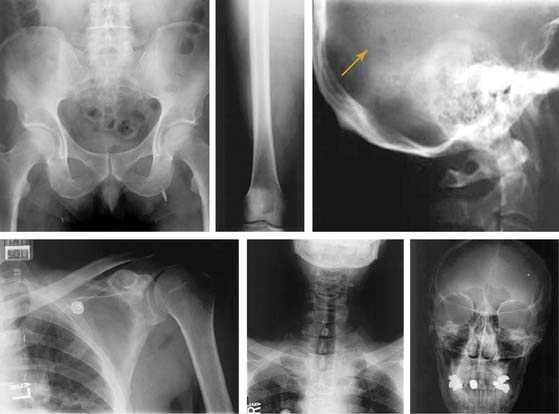
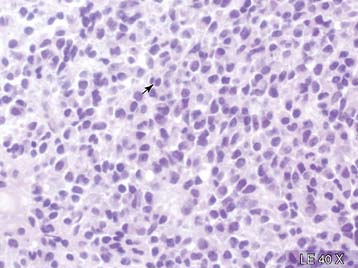
Case 22

Published on 02/03/2015 by admin

Filed under Internal Medicine

Last modified 22/04/2025

Print this page

rate 1 star rate 2 star rate 3 star rate 4 star rate 5 star
Your rating: none, Average: 0 (0 votes)

This article have been viewed 1358 times

Case 22

A 66-year-old male with hypertension, hyperlipidemia, and known coronary artery disease presented to the hospital with worsening angina over the last few weeks. He had suffered a myocardial infarction and underwent coronary artery bypass grafting in the past (1982 and 1992). He presented with angina in October 2004, and coronary angiography showed proximal complete occlusion of all three native vessels. Left internal mammary graft to the left anterior descending coronary artery was patent, but there was 70% narrowing distal to the left internal mammary artery touchdown. SVGs to the RCA and D1 were occluded. SVGs to the OM2 and OM3 had 95% occlusion. He underwent PCI and stenting of the SVGs to OM2 and OM3.

During this admission, acute myocardial infarction was ruled out, but the patient was found to be severely anemic. His hemoglobin was 5.7 g/dL, white count was 5100/μL, with a differential of N-49%, L-31%, M-17%, E-2%, Blasts-1%, and a platelet count of 93,000/μL. He was transfused with multiple units of blood, and his hemoglobin increased to 10 g/dL. He was scheduled to undergo upper and lower gastrointestinal endoscopy to look for any possible sources of blood loss. He had no evidence of hemolytic anemia.

He was referred for pharmacologic stress perfusion imaging for cardiac evaluation prior to the endoscopy procedures.

He underwent 2-day rest/stress perfusion imaging using 25 mCi of 99mTc-sestamibi on each day. With 5-minute adenosine infusion, his heart rate changed from 57 to 66 beats/min, and blood pressure changed from 168/83 to 155/84 mm Hg. He complained of chest tightness during adenosine infusion. His electrocardiogram showed normal sinus rhythm with intraventricular conduction delay and nonspecific ST-T changes. There was further 1-mm ST depression during adenosine infusion.

The representative raw images and processed stress and rest slices in the short, vertical, and horizontal long axes show marked tracer uptake in the ribs, sternum, vertebrae, and scapulae on both stress and rest images. Bone uptake interferes to some extent with the image interpretation. There is a large area of perfusion abnormality involving the anterior and lateral walls, which is predominantly reversible on the rest imaging. There is transient poststress anterior wall hypokinesia and transient poststress LV dilation. TID was calculated as 1.22 (upper limit of normal 1.16). Left ventricular ejection fraction was 49% (poststress) and 55% (rest).

This patient turned out to have high-risk abnormal images. However, extensive skeletal radiotracer uptake was quite intriguing. Prompted by the observation of marked skeletal uptake noted on the first day of imaging, whole-body images were acquired following the stress images on the second day. The whole body images showed abnormal tracer uptake predominantly in the flat bones and proximal ends of long bones.

On reexamination, he denied any symptoms of bone pain, and there was no skeletal tenderness anywhere.

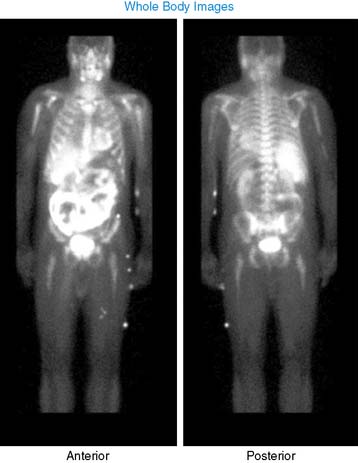
He had a whole-body bone scan, which was negative.

He underwent skeletal survey, which showed rounded lytic lesions in the calvarium. The rest of the x-rays did not show any abnormality. He also underwent extensive biochemical and hematologic workup, including bone marrow biopsy.

His bone marrow biopsy showed diffuse infiltration by neoplastic plasma cells, and this picture was consistent with plasma cell myeloma. Flow cytometry showed approximately 70% atypical plasma cells with kappa light-chain restriction.

His serum protein electrophoresis showed elevated total protein 11.6 g/dL (normal range: 6.0 to 8.0 g/dL) with predominantly alpha1 globulin 0.4 g/dL (normal range: 0.15 to 0.35 g/dL) and gamma immunoglobulins 5.5 g/dL (normal range: 0.7 to 1.5 g/dL). Albumin 3.8 mg/dL (normal range: 3.5 to 5.5 g/dL), alpha2 globulin -1 g/dL (normal range: 0.5 to 1.0 g/dL) and beta globulin 1 g/dL (normal range: 0.7 to 1.5 g/dL) were in the normal range. Beta2 microglobulin level, which is a poor prognostic indicator, was elevated to 12.07 mg/L (normal range 0 to 3.0 mg/L).

In the quantitative immunoglobulin panel, there was high level of IgG 8430 mg/dL (normal range: 751 to 1560 mg/dL) and low levels of IgA 26 mg/dL (normal range: 82 to 453 mg/dL) and IgM 29 mg/dL (normal range: 46 to 306 mg/dL). Serum immunofixation showed an electrophoretic pattern consistent with monoclonal gammopathy of IgG kappa type.

Although sestamibi is primarily a myocardial perfusion radiotracer, it is also taken up by various tumors. 99mTc-sestamibi has also been used quite successfully as a tumor imaging agent. The mechanism of sestamibi concentration in malignant tissue is still uncertain. The strong electronegative mitochondrial and plasma membrane potentials are considered relevant factors. Alterations in cell metabolism could affect the membrane potential, favoring sestamibi accumulation in plasma cells As suggested in some reports, the patterns of technetium uptake in patients with multiple myeloma are related to both the clinical state and stage of the disease; the presence of intense diffuse uptake is suggestive of active and advanced-stage disease. It also correlates with the amount of monoclonal component and the percentage of bone marrow plasma cells.

It could be a very useful technique in identifying patients with active disease, and hence guide selection of patients who need treatment and follow-up of patients after chemotherapy. This becomes very important, especially since bone scan is not sensitive in detecting myeloma lesions, and radiologic lesions would not be useful in indicating whether it is an active disease.