[level-membership-for-internal-medicine-category]ESSENTIALS OF ELECTROCARDIOGRAM READING
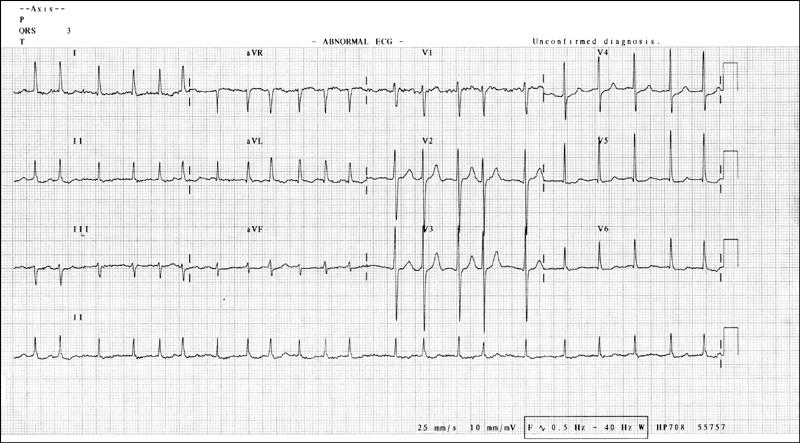
The major components to observe in the interpretation of an ECG are the rhythm, rate, axis and morphology, as shown by the P wave, P-R interval, QRS complex, ST segment, T wave and Q-T interval (see box).
It is not necessary to describe the ECG in the traditional and pedantic way, opening with the rate, rhythm and axis and then going on to describe the rest if they are normal. At the examination this may sound superfluous, and there is no time to waste! Candidates should identify the name of the patient and the date the ECG was done, and immediately start describing the abnormalities with references to the clinical findings. The following is a discussion of the various ECG findings commonly encountered in the long case examination.
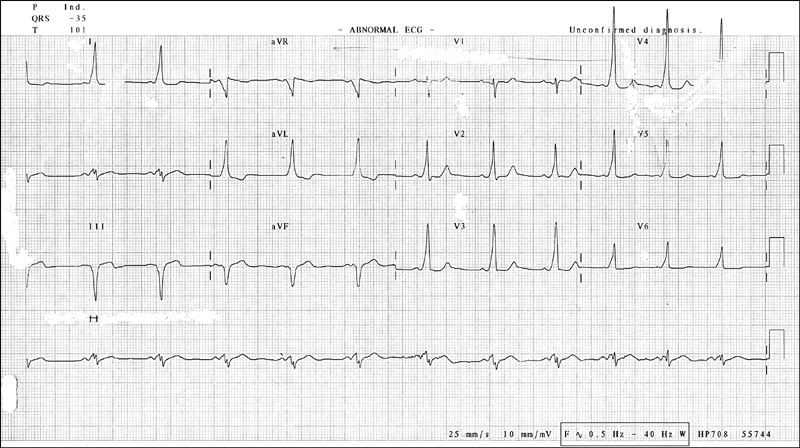
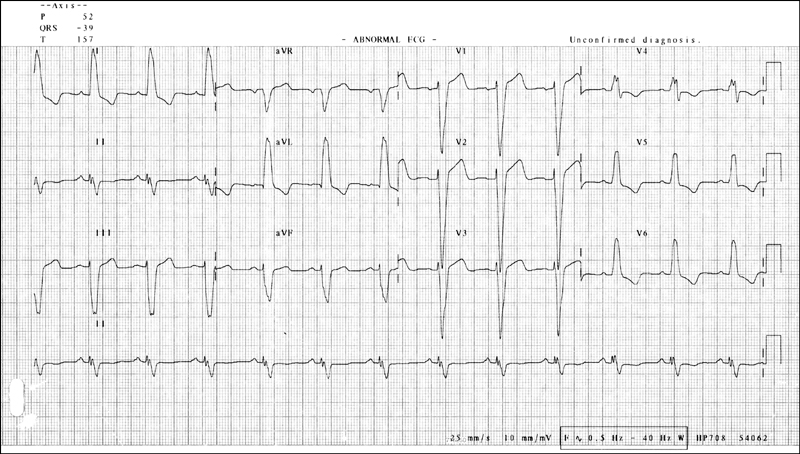
ST elevation of more than 1 mm in two contiguous leads. In anterior infarcts this would be in the chest leads V2–V6. Left heart infarcts show this in leads I, II and aVL. In inferior infarcts it is seen in leads II, III and aVF. Posterior infarctions show up as reciprocal changes in the anterior leads, and the classic findings include R waves, ST segment depression or tall T waves in leads V1 and V2. Acute myocardial infarction can sometimes present as a new bundle branch block.
Q waves are pathological if they are broader than 1 mm or deeper than 2 mm (or > 25% of the height of the following R wave).
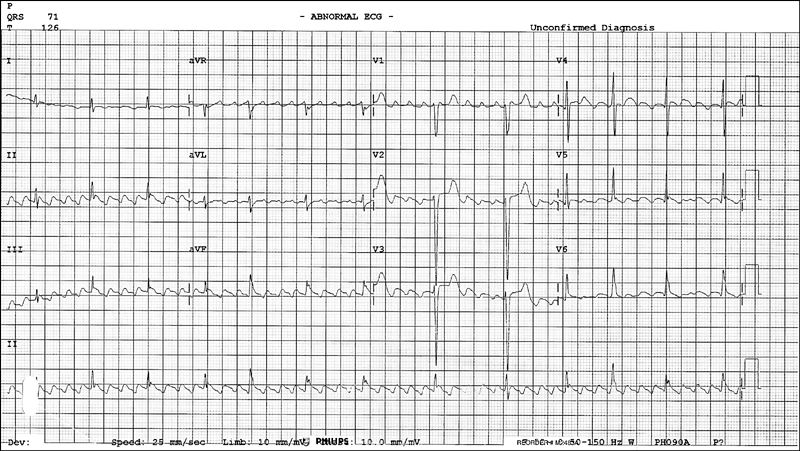
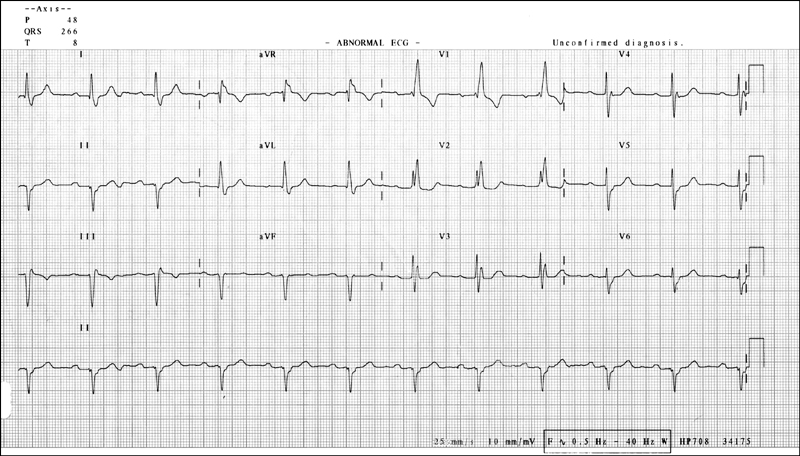
ECG changes consistent with subendocardial ischaemia (acute coronary syndrome) are ST segment depression of 1 mm or more, 0.08 seconds after the J point and corresponding T wave changes. The slope of the ST segment may provide some clues to the severity of the ischaemic phenomenon. Upward sloping indicates less severe disease, horizontal sloping indicates more severe disease, while downward sloping is usually considered the most significant and severe. The T wave changes include T wave flattening and T wave inversion.
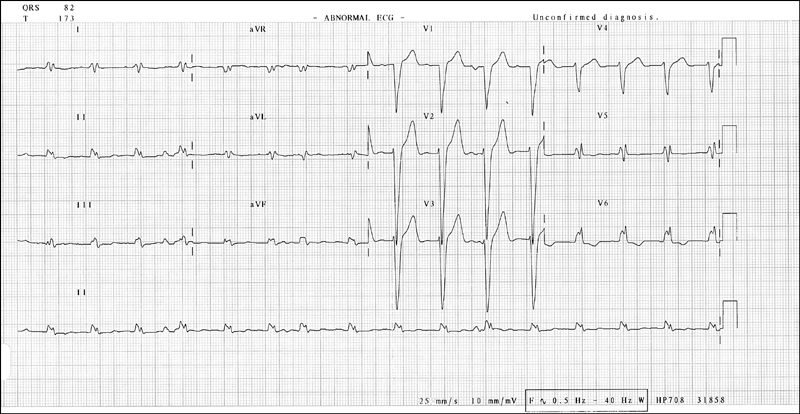
Left ventricular hypertrophy is described according to voltage criteria and strain/repolar-isation criteria.
This may be associated with pulmonary stenosis or pulmonary hypertension.
This is associated with right atrial overload, as in pulmonary hypertension and right heart failure.
This is seen in right heart strain associated with pulmonary hypertension, chronic lung disease, pulmonary emboli and mitral valve pathology. Some people may have non-pathological right bundle branch block, which is of no significance.
This is seen in ischaemic heart disease, hypertension, aortic stenosis and cardio-myopathy. Features to notice:
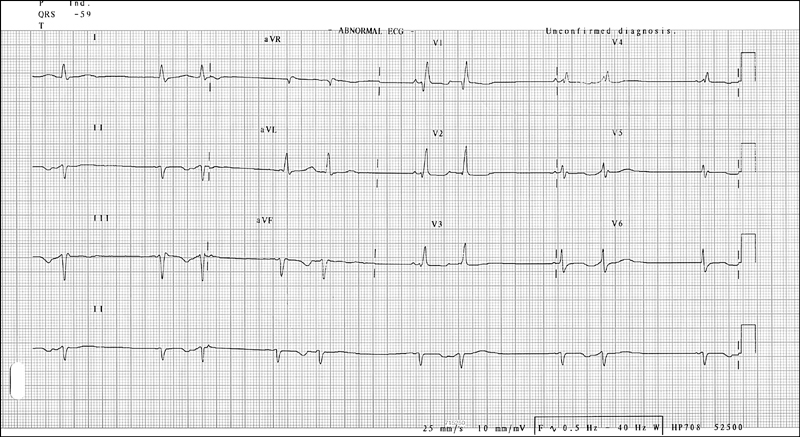
This is the most common cause of left-axis deviation. There is marginal prolongation of the QRS complex with left-axis deviation. Also notice terminal R waves in leads aVR and aVL, deep S wave in lead II, and RSR pattern in leads II, III and aVF. This feature is commonly seen in anterolateral or inferior myocardial infarcts.
This abnormality is associated with right-axis deviation of about 120°, Q waves in leads II, III and aVF, R waves in leads I and aVL. When left posterior hemiblock is present it is almost always associated with right bundle branch block. This combination has a poor prognosis, and progression to complete heart block needing a pacemaker is the likely eventuality.
Right bundle branch block in combination with a left-sided hemiblock or left bundle branch block. There is a high likelihood of progression to complete heart block requiring a permanent pacemaker.
The rate is usually normal and the main abnormality is a prolonged P-R interval (> 200 msec or 5 mm).
The sinus rate is normal but the ventricular rate is slower than normal. The main abnormality is the gradual prolongation of the P-R interval until one P wave is not conducted to the ventricles. A new cardiac cycle begins following the non-conducted P wave. Rhythm is usually irregular. This pattern has an association with inferior myocardial infarctions.
The sinus rate is normal but the ventricular rate is a definite fraction of the sinus rate. There are more P waves than QRS complexes, as only one P wave is conducted for several subsequent P waves. Note the block, which is 2:1, 3:1 or more. This condition is usually associated with anterior myocardial infarctions.
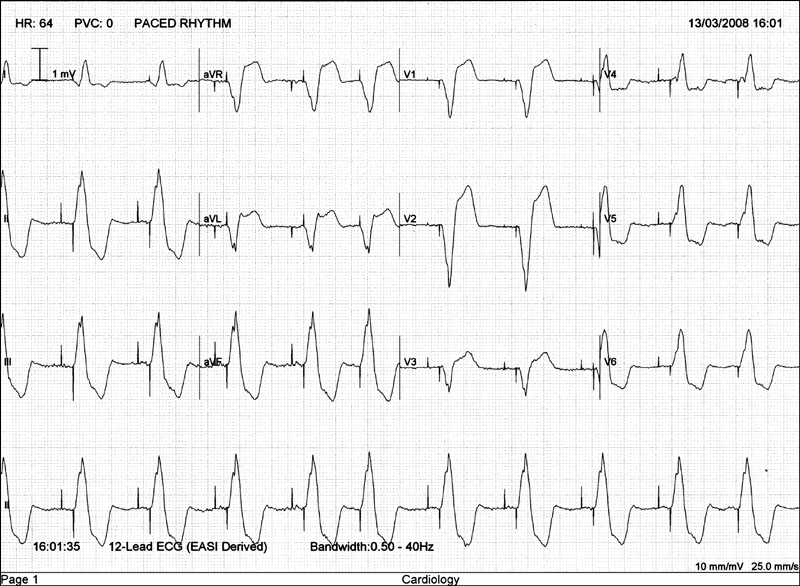
The sinus rate is normal but the ventricular rate is much slower. The ventricular rate is dependent on the site of the escape pacemaker (if it is in the AV junction, the rate would be around 40–60 bpm; if ventricular, the rate would be < 30 bpm). The P-R interval changes constantly and the P wave has no relationship to the QRS complex (AV dissociation).
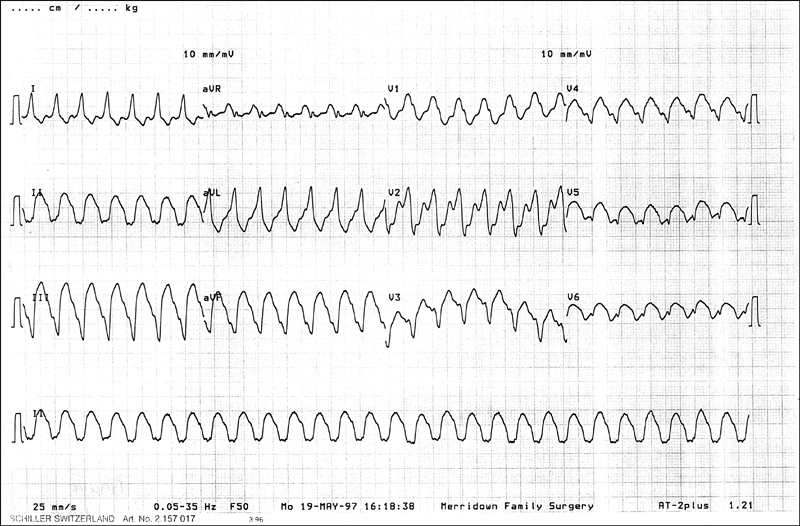
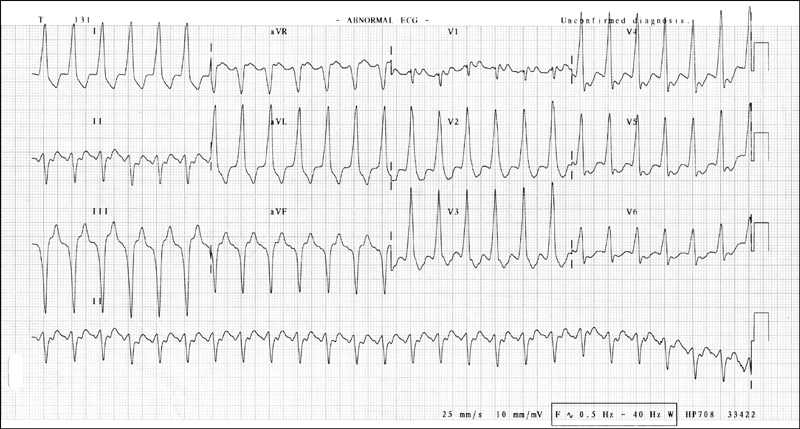
A broad complex tachycardia with a rate exceeding 100 bpm. In practice, however, it is common to see the rate at 140–200. The rhythm is regular. It is called
sustained ventricular tachycardia if it persists beyond 30 seconds. The QRS complex is longer than 140 milliseconds. There is evidence of AV dissociation, fusion beats and variable retrograde conduction. QRS pattern of all precordial leads should be in concordance. There may be features of left-axis deviation in the presence of right bundle branch block. A broad complex ventricular rhythm at a rate of less than 100 bpm is called
accelerated idioventricular rhythm.
The rhythm is regular and the rate is 140–280 bpm. QRS complex follows each P wave, but the P wave may also be buried in the QRS complex or the T wave and not be visible.
The rhythm is most often regular but may vary if the degree of AV nodal block changes. Ventricular rate may vary between 60 and 150, again depending on the block. There are characteristic atrial oscillations described as ‘sawtooth’-shaped flutter waves. These flutter waves occur regularly at a rate of 250–300 per minute. Depending on the block, the rhythm should be described as atrial flutter with 2:1, 3:2 or 4:1 block.
The rhythm is regular and the rate is 100–200 bpm. The P wave appears inverted and is located immediately before or after the QRS complex due to retrograde conduction.
This conduction defect occurs due to ventricular pre-excitation due to the presence of an accessory AV conduction pathway. The P-R interval is shorter than 110 milli-seconds and the QRS complex has a slurred upstroke (delta wave). The patient may be in atrial fibrillation. A negative delta wave in lead V1 suggests a right-sided bypass tract.
Patients with hypertrophic obstructive cardiomyopathy may show non-specific ECG features. Evidence of left ventricular hypertrophy and diffuse, widespread, deep and broad Q waves are some commonly seen abnormalities.
Blood test results encountered in the examination include the full blood count, electrolyte profile, renal function indices, liver function studies, endocrine studies and serology. Serological tests can be either infective or autoimmune serology.
Here the focus should be on haemoglobin level, haematocrit, mean cell volume, mean cell haemoglobin concentration, and white cell count with differential and platelet count.
Candidates should know the normal values of all the above so that an abnormal value can be spotted immediately and interpreted accurately. When an abnormality in the blood count is present, ask for the report of the blood film for further clarification and, if appropriate, ask for other tests such as the results of the bone marrow biopsy, haemolytic screen, iron studies and vitamin B
12 and folate levels in anaemia, results of the blood culture in the setting of significant leucocytosis and febrile illness, and antiplatelet antibodies in idiopathic thrombocytopenia.
Neutrophilia is diagnosed when the neutrophil count is elevated above 7.5 × 10
9/L. The possible causes are:
Lymphocytosis is diagnosed when the lymphocyte count is elevated above 4 × 10
9/L. The possible causes are:
Eosinophilia is diagnosed when the eosinophil count is elevated above 0.5 × 10
9/L. The possible causes are:
Basophilia is diagnosed when the basophil count is elevated above 0.1 × 10
9/L. The possible causes are:
Leucopenia is diagnosed when the white cell count is less than 4 × 10
9/L. The possible causes are:
Microangiopathic haemolytic anaemia (MAHA) should be suspected in an anaemic and coagulopathic patient if the blood film report shows fragment cells, helmet cells, polychromasia and reticulocytosis. The possible causes include:
This should be performed in cases of thromboembolic disease with a strong family history or recurrent spontaneous venous thrombosis in any patient, arterial throm-bosis in a patient aged under 30 years, and venous thrombosis in a patient aged under 40 years without a predisposing condition.
Thrombophilic screen involves testing for the following:
Look at the sodium level, potassium level, chloride level, bicarbonate level and the renal function indices. If any abnormality is noticed, try interpreting it in the context of the clinical setting or a causative medication.
The normal serum sodium level is 136–144 mmol/L.
This can be caused by hypovolaemia and dehydration as well as primary hyperaldosteronism, Cushing’s syndrome and excess salt intake. Patients present with lethargy, irritability, fever, nausea, vomiting and confusion. Management is with controlled hydration using 4% dextrose with 1/5 normal saline or 5% dextrose solution together with judicious diuretic therapy.
This can be caused by inappropriate secretion of antidiuretic hormone (SIADH), congestive cardiac failure, severe hepatic failure, Addison’s disease, aldosterone insufficiency, hypothyroidism, diuretic therapy, salt-losing nephropathy, renal tubular disorders and water retention.
The normal serum potassium level is 3.5–5.0 mmol/L.
This can be caused by ACE inhibitor therapy, potassium-sparing diuretics, inadvertent potassium supplementation, acidosis, blood transfusion, haemolysis, severe renal failure, rhabdomyolysis and hypoaldosteronism.
Patients present with severe muscular weakness, paralytic ileus, symptomatic brady-cardia and heart block. Management of hyperkalaemia includes administration of 10 mL 10% calcium gluconate if there are electrocardiographic changes of hyperkalaemia (peaked T waves, small P waves and wide QRS complexes). Rapid reversal of potassium levels can be achieved by giving 50% glucose with insulin infusion, but the levels may rise again in a few hours. Concurrently administer oral or per rectum resonium 15–30 g and repeat administration as guided by subsequently measured serum potassium levels. Hyperkalaemia of severe renal failure needs haemodialysis.
Causes of hypokalaemia include loop diuretic therapy, primary hyperaldosteronism, Cushing’s syndrome, renal tubular disease, alkalosis and hyperthyroidism. Therapy with drugs such as verapamil, beta-agonists and amiodarone should be excluded.
Hypokalaemia presents with muscle weakness or tetany. Significant hypokalaemia can lead to rhabdomyolysis. To manage hypokalaemia, usually oral supplementation alone will suffice. If the level is < 2.9 mmol/L, parenteral supplementation with KCl 10 mmol/L over an hour through a central venous line is indicated. The patient’s cardiac function should be monitored during this infusion. It should be repeated as guided by the subsequently performed serum potassium levels.
The normal serum calcium level is 2.2–2.5 mmol/L. The serum calcium level varies with the serum albumin level, and the correction can be made using the following formula:

This can be caused by primary hyperparathyroidism, squamous cell carcinoma of the lung, cancer with bony metastases, multiple myeloma, sarcoidosis, vitamin D intoxi-cation, milk-alkali syndrome and thiazide diuretics.
Significant hypercalcaemia presents with anorexia, nausea, vomiting, constipation, polyuria, severe weakness, stupor and eventually coma.
Causes of hypocalcaemia include hypoparathyroidism, vitamin D deficiency, osteomalacia, acute pancreatitis, chronic renal failure, malignancy with osteoblastic metastases, and pseudohypoparathyroidism.
Patients present with circumoral and distal limb paraesthesias, painful muscle cramps, tetany and seizures. Patients may also have Chvostek’s sign and Trousseau’s sign.
Symptomatic hypocalcaemia and corrected serum levels of < 1.88 mmol/L should be treated with parenteral calcium in the form of 10% calcium gluconate.
This diagnosis should be suspected when plasma bicarbonate (HCO
3) is less than 10 mmol/L and PaCO
2 is low with a low pH (a low HCO
3 value can be seen in respiratory alkalosis as well as in metabolic acidosis). The anion gap helps the interpretation of metabolic acidosis in more detail, and is calculated as follows:

The normal value is 10–14 mmol/L. Metabolic acidosis could be with a normal or increased anion gap.
Metabolic acidosis with a normal anion gap is due to an associated loss of HCO
3 molecules from the body. The possible causes are:
This condition is managed with volume repletion and correction of associated hypokalaemia with potassium supplementation.
Acidosis with an increased anion gap is due to the presence of non-volatile acids in the body. The possible causes are:
This is caused by excess HCO
3 or alkali or the loss of H
+ due to metabolic causes. A high HCO
3 level and an elevated PaCO
2 level together with a high pH characterises metabolic alkalosis. The serum chloride level would give further clues to its aetiology.
Hyperchloraemic metabolic alkalosis is seen in primary hyperaldosteronism, glucocorticoid excess, hypercalcaemia, Liddle’s syndrome and Bartter’s syndrome. Hypochloraemic metabolic alkalosis is seen in gastrointestinal fluid loss (vomiting), diuretic therapy and after hypercapnoea.
This is caused by alveolar hypoventilation and associated hypercapnoea. A high HCO3 and a high PaCO2 with a low pH is suggestive of respiratory acidosis.
This is caused by alveolar hyperventilation. A low HCO3 level and a low PaCO2 with an elevated pH is suggestive of respiratory alkalosis.
Be alert to mixed disorders, where the pH value does not correlate very well with the HCO3 or the PaCO2 level.
Any elevation of the blood urea or serum creatinine level is suggestive of renal failure. Ask for the previous levels, to ascertain whether the renal impairment is acute or chronic and to ascertain whether it is progressive or stable. If the renal impairment is new, further tests should be carried out to find out the cause (as described in ch 6).
This enzyme has two isoforms: alanine aminotransferase (ALT) and aspartate aminotransferase (AST). Massive elevation of the serum levels of this enzyme is seen in severe viral hepatitis, hepatotoxic-induced liver injury and ischaemic liver injury. Moderate elevations are characteristic of mild acute viral hepatitis, chronic active hepatitis, alcoholic hepatitis, cirrhosis and hepatic metastases.
Usually the ALT elevation parallels AST elevation, but in alcoholic liver disease AST elevation far exceeds that of ALT. The ratio of AST/ALT in this setting is > 2.
A striking elevation of this enzyme is seen in cholestatic disorders. Moderate and transient elevations are seen in all types of liver pathology, including hepatitis, metastatic disease and hepatic infiltrative conditions such as lymphomas, leukaemia and sarcoidosis.
The level of this enzyme correlates with that of ALP. Its level also goes up in alcoholism, diabetes mellitus, cardiac failure, pancreatic disease, fatty liver and renal failure. Elevation of the level of this enzyme is often non-specific.
Elevation of the PT level and the INR is seen when hepatic synthetic function is impaired. All clotting factors except factor V are synthesised in the liver.
This marker also reflects the hepatic synthetic capacity, and hence it is low in significant liver disease.
The conjugated (direct) bilirubin level is elevated in cholestasis. Unconjugated (indirect) hyperbilirubinaemia is seen in haemolysis, ineffective erythropoiesis, Gilbert’s syndrome and the rare Crigler-Najjar syndrome.
Commonly performed thyroid function tests include serum free T3, free T4 and thyroid-stimulating hormone (TSH) levels. The most sensitive assay of thyroid function is the serum TSH level (normal range for TSH is 0.3–3 mU/L).
Hyperthyroidism is defined as hyperactivity of the thyroid gland. Thyrotoxicosis by definition is excess thyroid hormone due to any cause.
A technetium-99 (Tc99) scan helps to identify the cause of thyrotoxicosis. Causes of thyrotoxicosis include Graves’ disease, toxic nodular goitre, initial phase of Hashimoto’s thyroiditis, excess iodine intake, thyrotoxicosis factitia and subacute thyroiditis. Radioactive iodine uptake is another test that can be performed to assess the activity of the thyroid gland. In the latter three conditions, the uptake of radioactive iodine is reduced. Thyroid scintigraphy using radioactive iodine or Tc99 pertechnetate is also useful for the assessment of hot and cold spots in a goitre.
Autoimmune markers relevant to thyroid disease should be requested in appropriate situations. Antithyroid peroxidase antibody, antimicrosomal antibody and antithyroglobulin antibody are seen in Hashimoto’s thyroiditis and Graves’ disease. In addition, in Graves’ disease, thyroid-stimulating antibodies are encountered.
Ultrasonography of the thyroid gland is done to distinguish between cystic nodules and solid nodules.
In the sick euthyroid syndrome, free T4 levels would be high, low or normal, T3 levels would be low and TSH levels would be low or normal.
Amiodarone causes an elevation in free T4 levels, decrease in T3 levels and an elevation in TSH levels.
In thyrotoxicosis (non-pituitary) the TSH level will decrease to undetectable levels (< 0.1 mU/L).
Screening tests for Cushing’s syndrome are the measurement of 24-hour urinary free cortisol or the overnight dexamethasone suppression test.
Confirmatory for the diagnosis of Cushing’s syndrome is a low-dose dexamethasone suppression test (0.5 mg dexamethasone every 6 hours for 48 hours).
To determine the aetiology of the Cushing’s syndrome, a high-dose dexamethasone suppression test can be performed (2 mg dexamethasone every 6 hours for 48 hours). If there is suppression of cortisol secretion, the likely diagnosis is that of an adrenocorticotrophic hormone (ACTH)-secreting pituitary tumour. If there is failure of suppression, the aetiology is likely to be adrenal neoplasia or ectopic secretion of ACTH.
The plasma ACTH level may also give clues to localising the focus of hypersecretion. An elevated plasma ACTH level may suggest a pituitary or an ectopic origin. To localise the pituitary tumour, imaging studies with cranial CT or MRI should be done. But for the localisation of pituitary microadenomas that do not manifest in the imaging studies, selective venous sampling of the inferior petrosal sinus is necessary.
A suppressed plasma ACTH level is highly suggestive of an adrenal neoplasia and should be followed up with pelvic imaging studies such as CT.
In patients presenting with symptoms of weakness, anorexia, weight loss, hypotension, postural drop in blood pressure, syncope and vitiligo as well as investigational findings of hyperkalaemia, hyponatraemia, hypercalcaemia and low bicarbonate levels, adrenal insufficiency should be considered as a top differential diagnosis. Screening for adrenal insufficiency involves performing a short Synacthen® test. This test involves checking the plasma cortisol level 30–60 minutes after an injection of 250 mg cosyntropin.
To localise the level where the secretory function is defective, plasma ACTH should be checked 30 minutes after the injection of 250 mg cosyntropin. If the ACTH shows an elevatory response, the likely site is the adrenal gland, and if there is no elevation the likely site is the pituitary.
When a patient presents with diastolic hypertension, headache, muscle weakness with fatigue and if there is associated hypokalaemia in the electrolyte profile, consideration should be given to the possible diagnosis of hyperaldosteronism. The first test to be performed is the plasma renin/aldosterone ratio. If it is normal or elevated, go on to measure the plasma aldosterone level before and after saline loading. If there is no suppression of aldosterone secretion with a salt load, consider aldosterone-secreting adrenal tumour and perform relevant imaging studies of the abdomen and pelvis in the form of CT and MRI.
This condition is commonly diagnosed incidentally in middle-aged women who are discovered to have hypercalcaemia. However, in any patient with hypercalcaemia it is important to exclude metastatic malignant disease, squamous cell carcinoma, multiple myeloma, chronic renal failure, hypocalciuric hypercalcaemia, thyrotoxicosis, multiple endocrine neoplasia (MEN) type 1 and MEN type 2A.
The initial test for suspected hyperparathyroidism is the serum parathyroid hormone assay. If this is elevated, surgical exploration by a skilled surgeon is the best way of localising the involved parathyroid adenoma or the hyperplastic gland. Remember to exclude chronic renal failure, as there is hyperparathyroidism associated with autonomously hypersecreting parathyroid glands in tertiary hyperparathyroidism of chronic renal failure.
In suspected growth hormone excess, the best initial tests are:
When inadequate secretion of growth hormones is suspected, the best initial test is to assess the growth hormone response to insulin, levodopa or L-arginine challenge.
In both the above situations, an abnormal test should be followed up with pituitary imaging studies in the form of MRI.
In suspected prolactin excess, the best test is the assessment of serum prolactin level.
Formal lung function studies include a flow–volume curve demonstrating the inspiratory flow rate in litres per second as depicted by the curve below the meridian, and the expiratory phase as depicted by the curve above the meridian. The candidate should be able to interpret the curve to diagnose obstructive lung pathology, restrictive lung pathology, the severity of each condition, large airway obstruction and its exact location, as well as mixed airway disease.
The other component of the lung function study is the carbon monoxide diffusion capacity. This would indicate whether the lung pathology is confined to the airways alone where the diffusion capacity is normal, or whether the pulmonary parenchyma is affected where the diffusion capacity is reduced.
By combining the two sets of information, the candidate should be able to make a diagnosis of the lung condition as guided by the clinical findings. The FEV
1/FVC ratio is an age-related phenomenon. However, a ratio less than 75% in a young individual or less than 60% in an older individual is considered consistent with obstructive airway disease. An FEV
1/FVC ratio of 80% or more with both FEV
1 and FVC values being very low is suggestive of restrictive lung pathology.
Following are some possible patterns of lung function study findings that can be expected at the examination:
Lung scans are performed to confirm or exclude a clinical diagnosis of pulmonary embolism or to ascertain lung function (gas exchange).
This is performed to confirm or exclude a clinical diagnosis of pulmonary embolism. It is of further help in the follow-up of treatment for pulmonary embolism. Radioactive Xe133 or Xe127 gas is used for the ventilation scan. Perfusion is assessed with injection of Tc99m macroaggregated albumin (MAA). A plain chest X-ray should be obtained before or soon after the scan, for reference purposes. Mismatched areas show normal ventilation with impaired perfusion. A patient whose V/Q scan has a reported high probability of pulmonary embolism should be treated with therapeutic anticoagulation, first with IV heparin and then with oral warfarin for a total of 6 months.
The finding of a high probability scan has high correlation with the findings of pulmonary angiography, which is the gold standard test. Scans reported as being of intermediate probability should be followed up with a pulmonary angiogram to confirm the diagnosis. If a scan is reported as low probability, the likelihood of pulmonary embolism is remote and other possible diagnoses should be looked for.
Follow-up scans should be performed several weeks or months after the initial study. Follow-up scans may show resolution of the initial defects as well as recurrent pulmonary embolism. A normal perfusion scan with impaired ventilation is usually due to atelectasis. Chronic airflow limitation and emphysema manifest as matched defects.
A thyroid scan is used to assess global as well as differential activity (e.g. hot or cold nodules). Scans are performed using radioactive iodine (I123) or Tc99.
Increased uptake of the nuclear marker is seen in:
Decreased uptake is seen in:
Metaiodobenzylguanidine (MIBG) is a neurotransmitter precursor that is taken up by the diseased adrenals and the thyroid gland. This agent is used to image the adrenals on blocking its uptake by the thyroid by administering Lugol’s iodide solution. A normal gland shows minimal or no uptake. Uniform increased uptake bilaterally is seen in adrenal hyperplasia. Unilateral increased uptake is suggestive of neuroectodermal tumours such as carcinoid, phaeochromocytoma and neuroblastoma. Distant meta-stases of these tumours can also be identified by their increased activity.
Tc99m DMSA is used to assess the renal cortical anatomy. Tc99m DTPA or Tc99m MAG3 is used to assess renal dynamics—perfusion and function. These are technetium-labelled radiopharmaceutical agents with low toxicity and low radiation.
These tests are useful in the assessment of renal artery stenosis in the hypertensive or vasculopathic patient. Other uses include assessment of the effects of renal revascularisation therapy, assessment of differential renal function prior to nephrectomy, assessment of glomerular filtration, and ascertaining the aetiology of transplant failure (rejection, tubular necrosis, cyclosporin toxicity).
Administration of captopril 50 mg (captopril-perfusion scan) increases the diagnostic accuracy of renal artery stenosis. The stenotic kidney shows decreased or delayed perfusion and delayed clearance of nuclear contrast. Substitution of captopril with high-dose aspirin has been shown to be equally efficacious with less toxicity.
Delayed images visualise the distal drainage system. Obstructive uropathy should be suspected if there is:
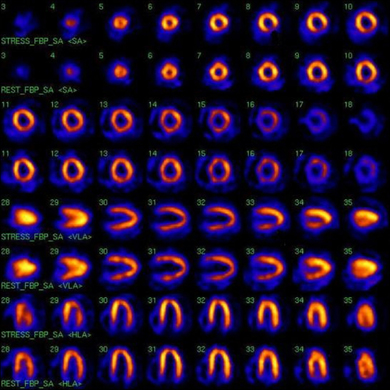
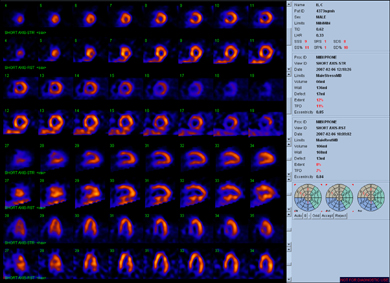
Nuclear scans are useful in the assessment of cardiac perfusion abnormalities and dynamic function. The nuclear test is more sensitive than the standard exercise stress (ECG) test for ischaemia, but has similar specificity. Agents commonly used in the assessment of the heart are thallium (TI201) chloride and technetium (Tc99m) sestamibi. Tc99m sestamibi gives images with better resolution and has better tissue pene-tration, and is therefore useful in obese subjects.
Differential perfusion of myocardium at rest and with increased activity (after exercise) or vasodilator administration (pharmacological stress test) is indicative of significant coronary artery stenosis. When the coronary artery is stenosed less than 90% but more than 50% (considered significant), perfusion during rest is preserved. But with activity or administration of vasodilator, there is relative impairment of the perfusion to the areas supplied by the relevant artery. For impairment of perfusion at rest, the artery should be narrowed by more than 90%. This differential perfusion is suggestive of significant coronary artery disease.
Pharmacological stress testing with the use of a vasodilator agent is used for those who cannot perform physical exercise. This test has similar sensitivity and specificity to the exercise test. Commonly used vasodilator agents are dipyridamole, adenosine and dobutamine. Coronary flow usually increases with the administration of the vasodilator agent in the normal arteries. But in stenotic vessels this change is not significant, so there is differential distribution of the nuclear agent, highlighting coronary ischaemia. Patients should not consume any caffeine or xanthine-containing food material for 24 hours before the study. A resting study is performed later to assess redistribution.
Reversible areas of hypoperfusion indicate significant coronary artery disease. Fixed defects highlight areas of previous myocardial infarction. False-positive results are seen in cardiomyopathy.
Tc99m pyrophosphate is used to diagnose subacute myocardial infarction. But this test is not commonly used because ECG and cardiac enzyme or troponin assessment is readily available.
This study is used to assess ventricular systolic function. Tc99m-labelled red blood cells are used to image the blood pool. Imaging is gated according to the sequence of cardiac cycle. This test also allows the assessment of segmental wall motion in the ventricle. A gated heart pool scan is of value in the assessment of myocardial damage due to ischaemia, cardiomyopathy, and cardiotoxins such as anthracyclines.
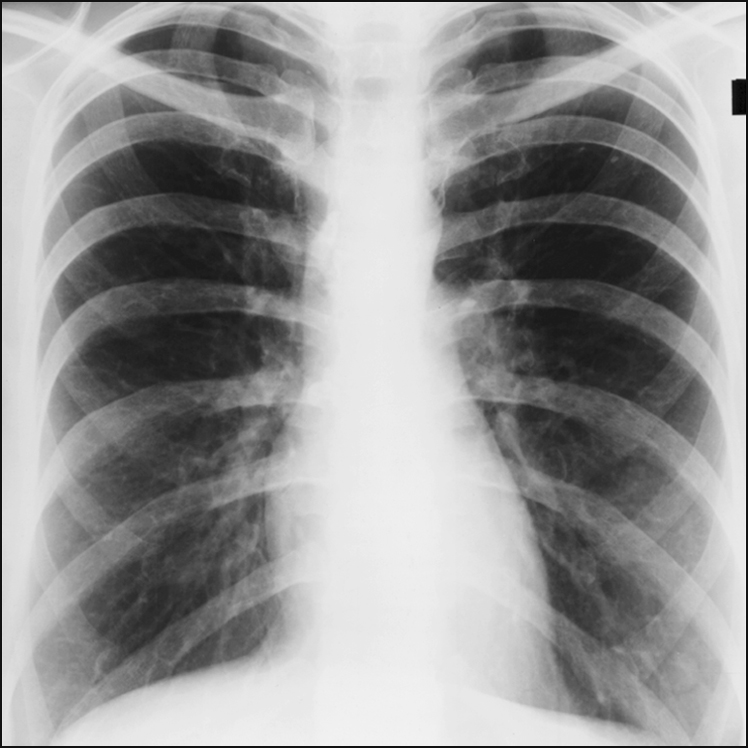
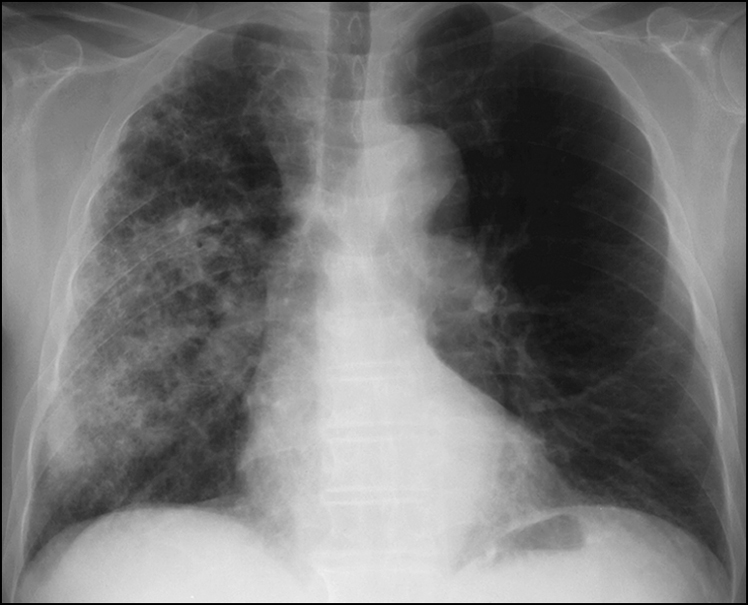
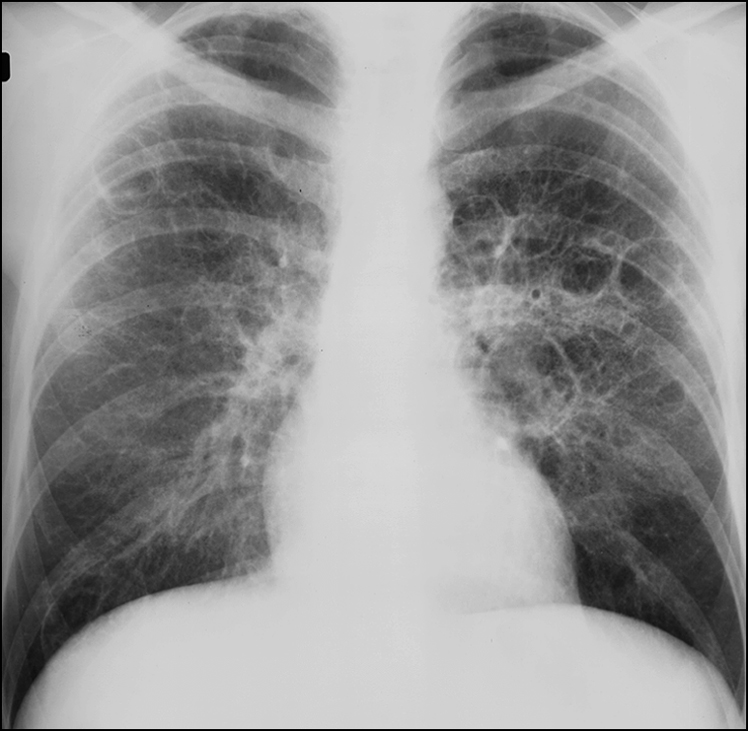
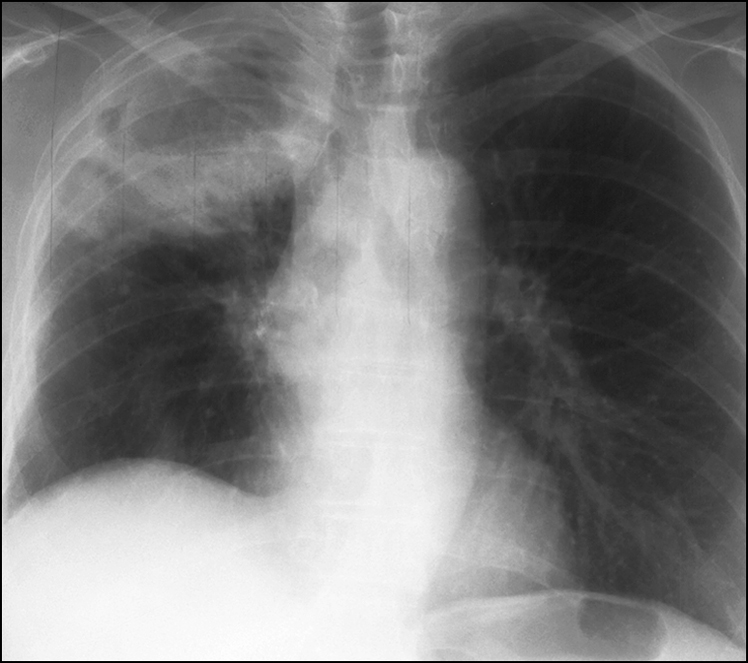
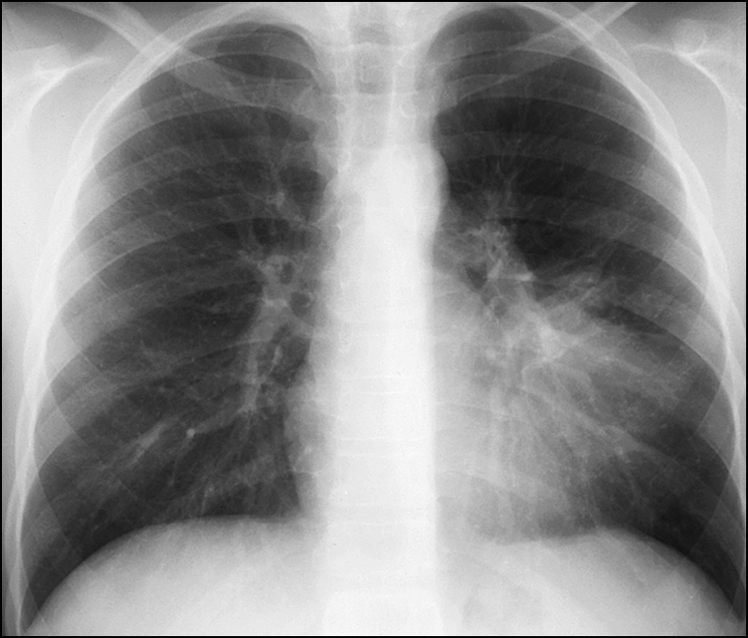
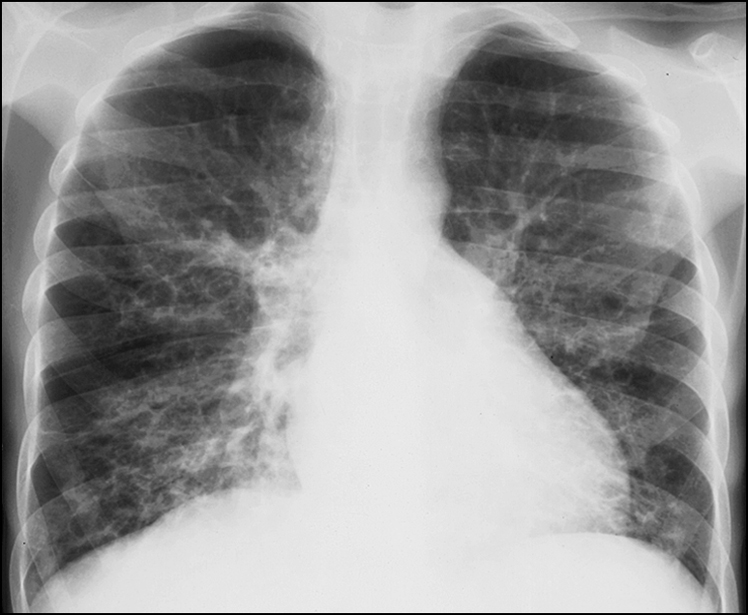
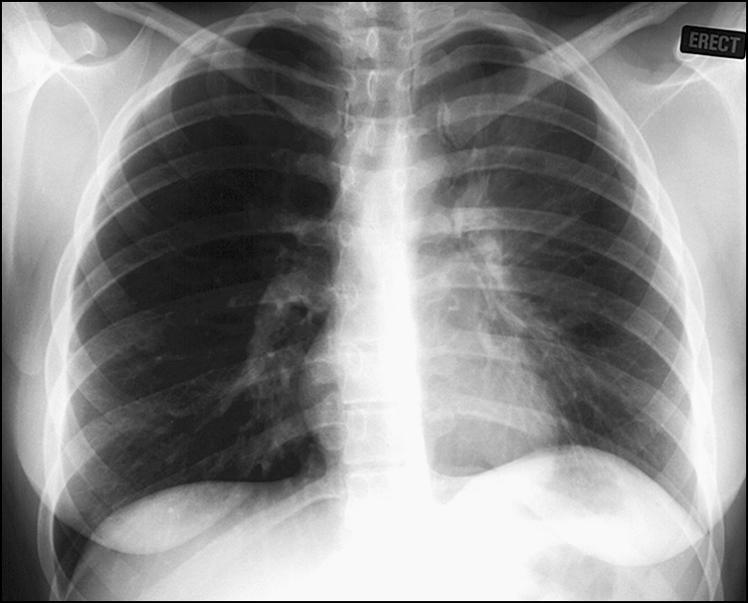
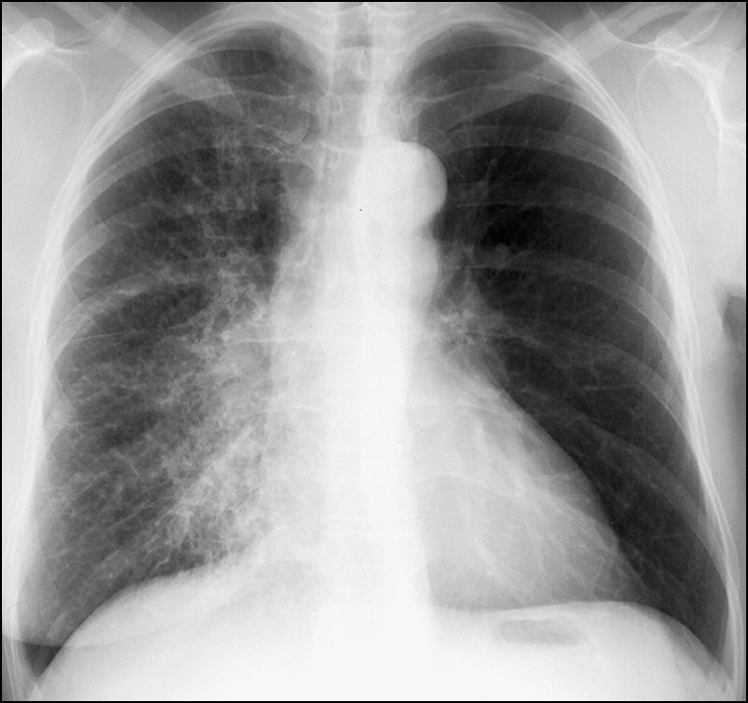
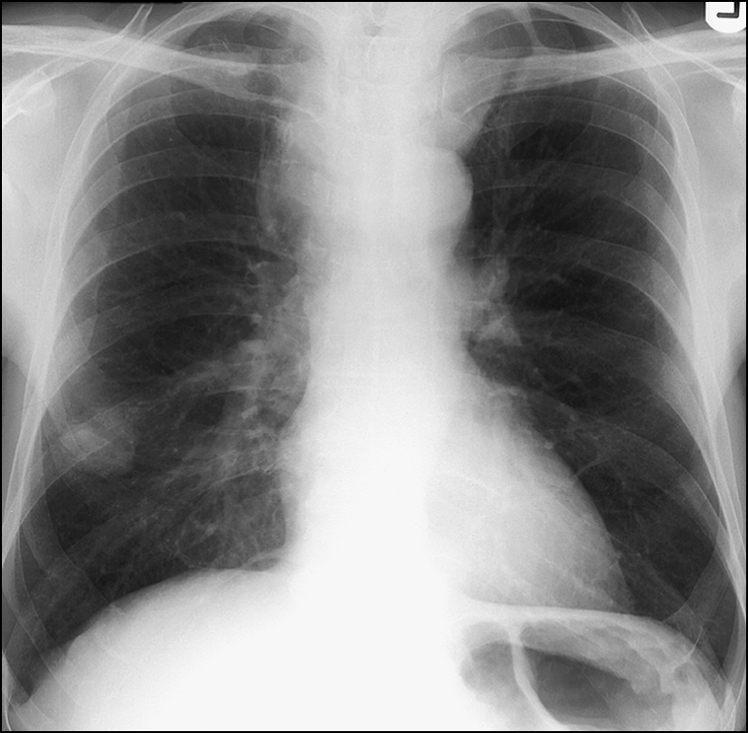
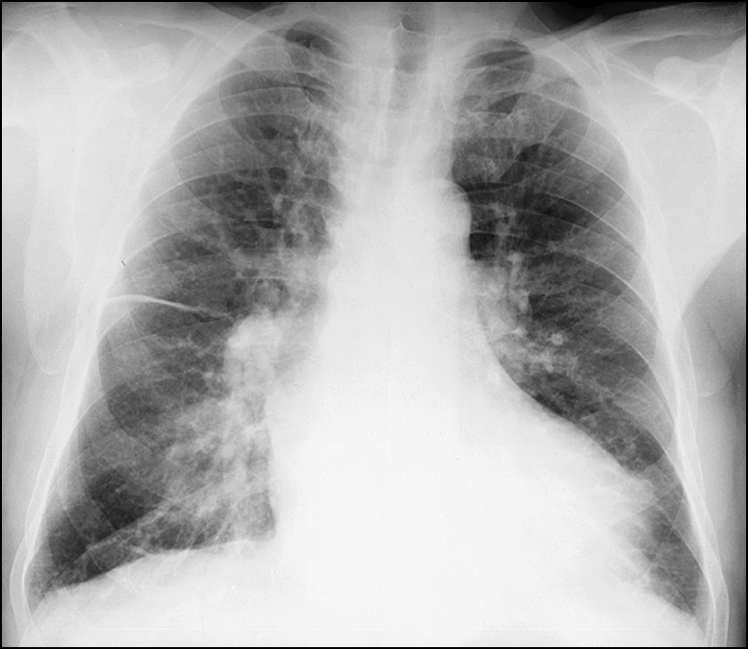
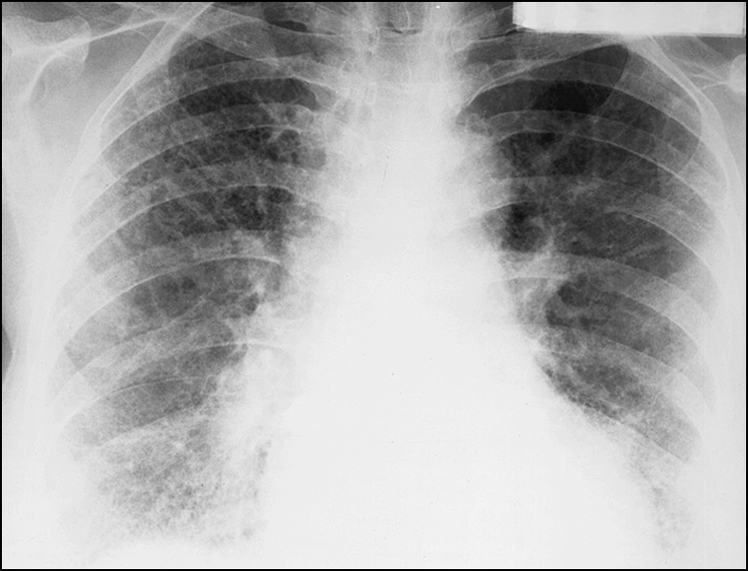
Interpretation of the patient’s chest X-ray is almost an integral part of the long case. Candidates should be able to identify and interpret the most obvious and most striking abnormality in the radiograph immediately. The most commonly encountered conditions are consolidation, pulmonary oedema (alveolar or interstitial), bronchiectasis, hyperinflation associated with emphysema, pneumothorax and mass lesions. An ideal approach is as follows:
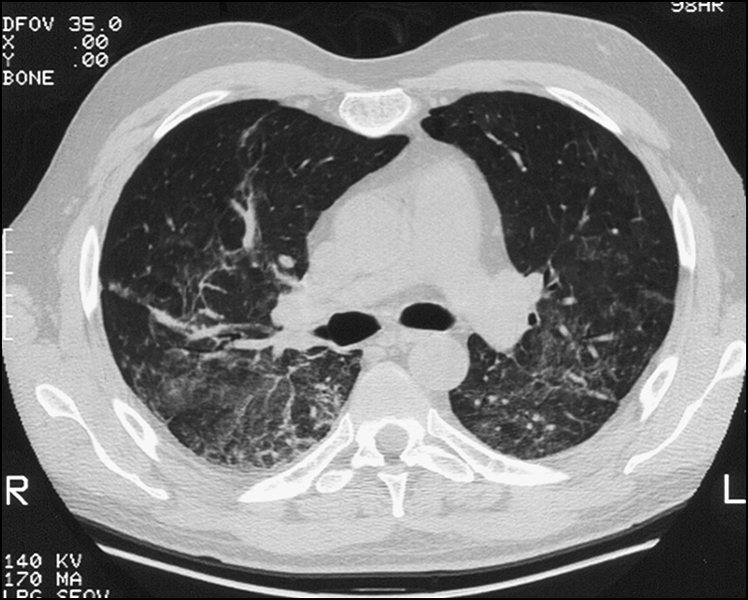
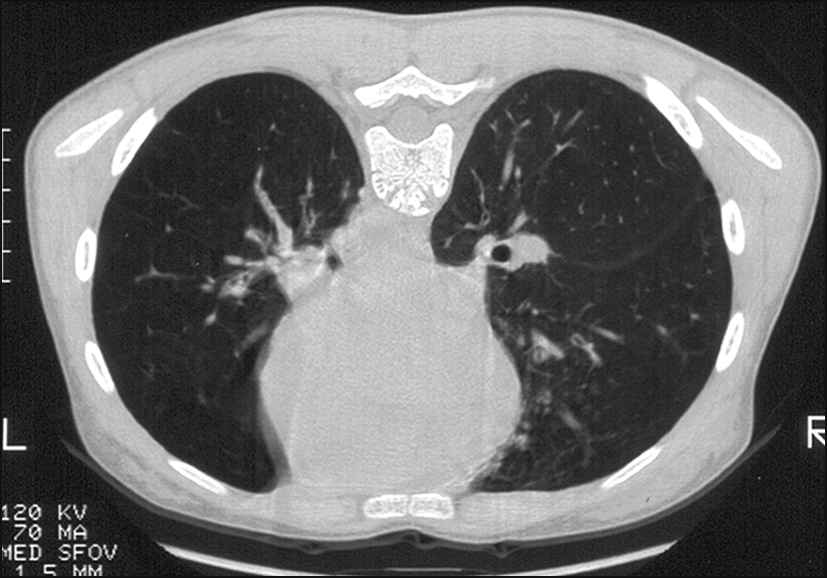
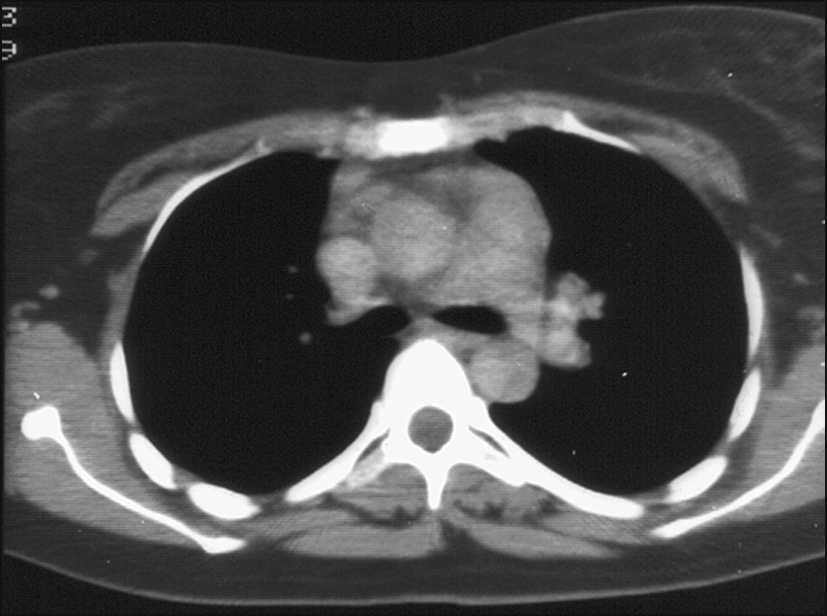
Computed tomography (CT) of the chest is necessary to further clarify information gathered from the chest X-ray. There are different types of chest CT scan—the high-resolution scan, the helical scan, the scan with lung windows and the scan with media-stinal windows. The candidate should be familiar with the different types so that the scan most appropriate to the clinical setting can be requested.
Slices of the images are 1 mm thick and are made 1 cm apart. These scans can demon-strate fine changes in the parenchymal architecture. This helps examine the lung parenchyma in more detail to better define interstitial lung pathology. It is indicated in parenchymal lung disease, alveolar disease, emphysema, pneumonitis, drug effects, BOOP and small airway disease.
It is most useful in the diagnosis of interstitial pneumonitis and lung fibrosis. If the pneumonitis shows a ‘ground glass’ appearance, this is consistent with an active inflammatory process progressing to fibrosis. Some reversibility may be achieved in this situation, and a trial of systemic corticosteroid therapy is indicated. If the picture is that of ‘honeycombing’, the fibrosis has progressed beyond reversibility.
These images are of 1 cm slices taken in a contiguous run. They give a good overall impression of the lung architecture.
This scan looks at the pulmonary vasculature, and the indication is for the diagnosis of pulmonary thromboembolism, particularly involving larger arteries. Contemporary radiography involves helical or spiral scanning on all occasions.
The following are some commonly encountered conditions where CT scan of the lung may be indicated.
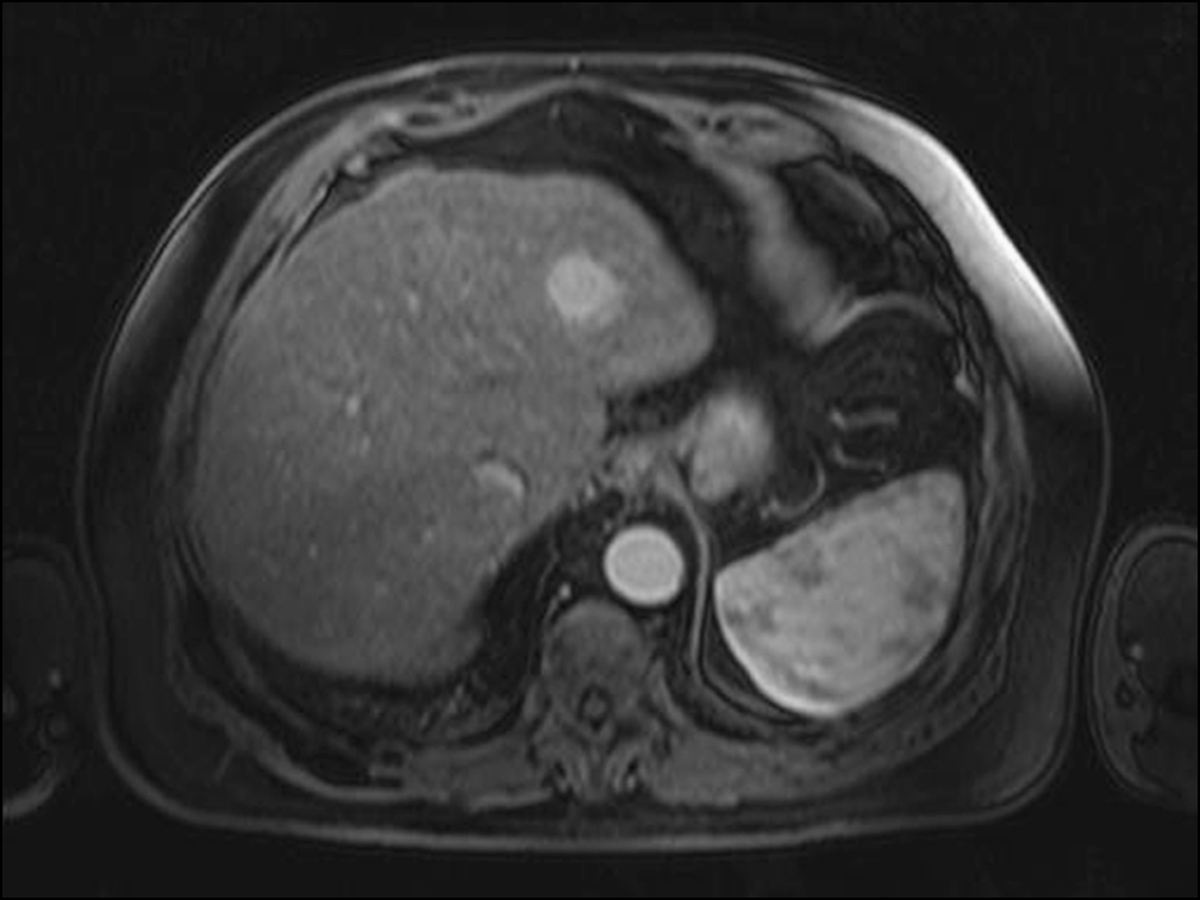
Abdominal imaging should be requested when there is suspicion of abdominal malignancy, intestinal obstruction, organomegaly, liver disease, pancreatitis, septic collections or biliary obstruction.
Look at the hepatic parenchyma, gallbladder, cystic duct, hepatic duct and common bile duct. Dilatation of the common bile duct (> 6 mm diameter) suggests possible obstruction. Ultrasound can show hepatic mass lesions, stones in the gallbladder, stones in the duct system, chronic cholecystitis and tumour of the gallbladder or the bile duct. To further clarify the above lesions, ask for the abdominal CT scan or the result of endoscopic retrograde cholangiopancreatography (ERCP) or magnetic resonance cholangiopancreatography (MRCP), depending on the clinical setting.
This is indicated in the setting of intestinal obstruction (look for air-fluid levels in the erect film), suspected intestinal perforation (look for gas under the diaphragm), chronic pancreatitis (pancreas appears calcified), gastric dilatation and megacolon.
This is performed to assess mechanical or functional obstruction of the oesophagus.
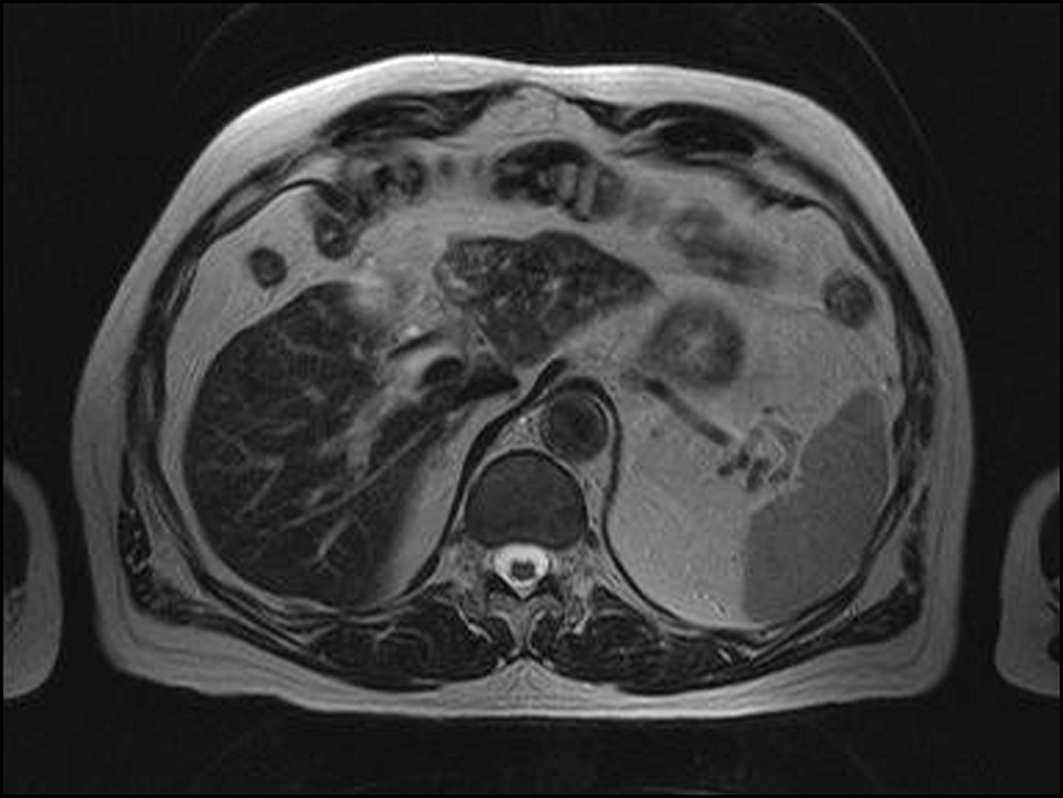
This is usually performed with oral as well as IV contrast. Look at the hepatic parenchyma, porta hepatis, stomach, duodenum, gallbladder, bile duct, portal vein, small and large intestines, abdominal aorta, inferior vena cava, pancreas, kidneys, pelvic organs and retroperitoneum as clinically indicated.
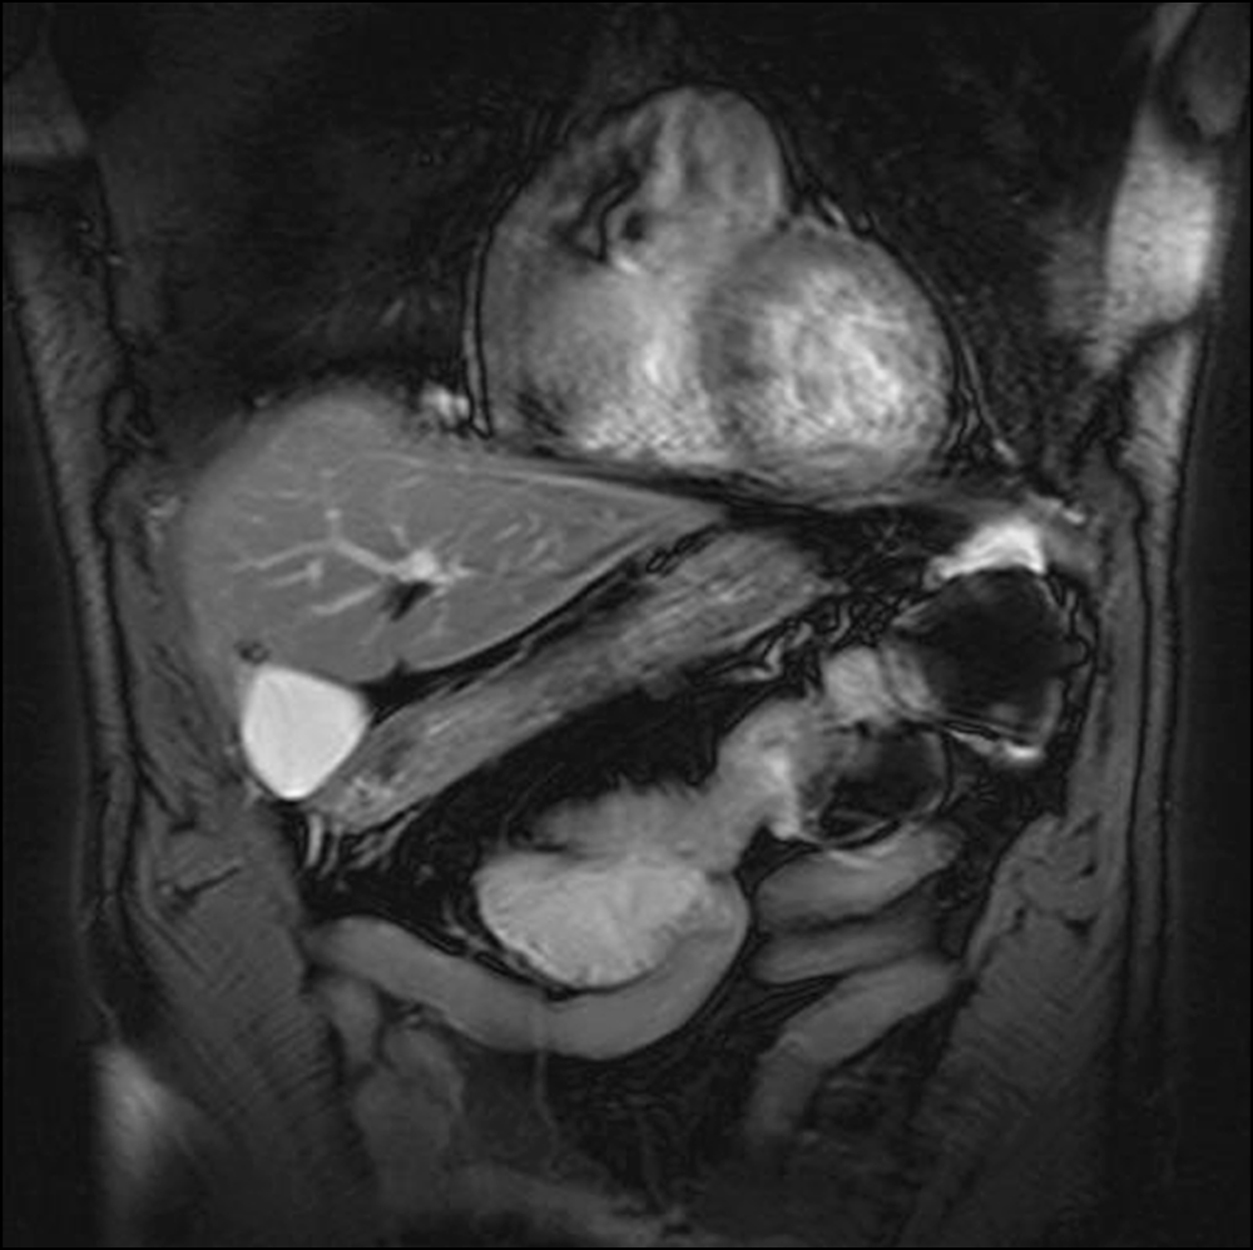
This is used to define the anatomy of abdominal and pelvic organs and vasculature with better resolution and definition. It is a preferred imaging modality to better identify pathology.
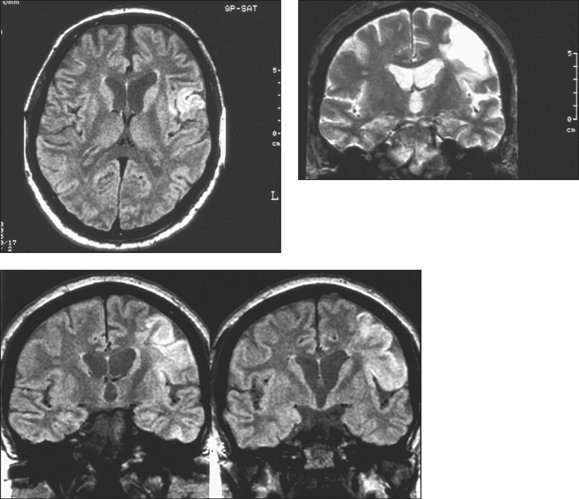
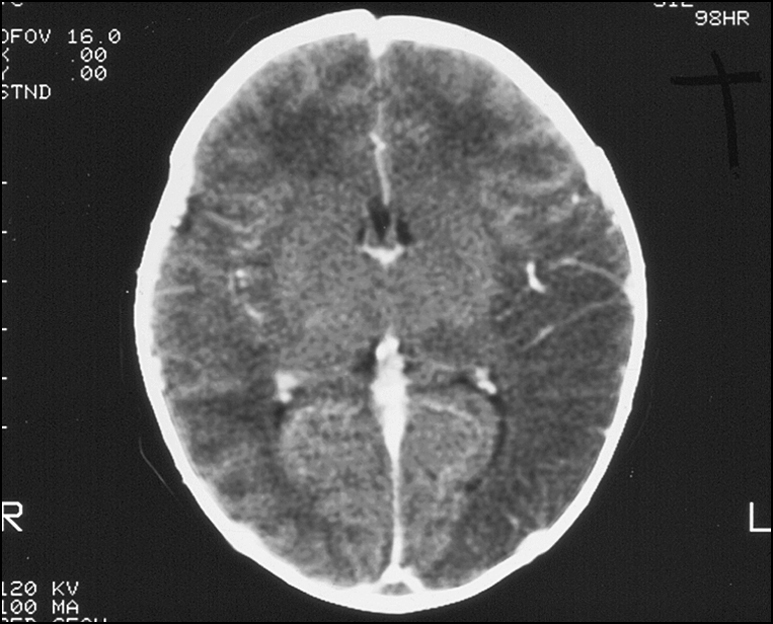
Cranial imaging is done to look for intracranial mass lesions, intracranial haemorrhage, cerebral oedema, cerebral atrophy and hydrocephalus. Investigations for suspected intracranial or intracerebral haemorrhage should be done without the injection of radiocontrast media, as fresh blood is highlighted in white.
The following are some conditions in which MRI scan of the brain is indicated.
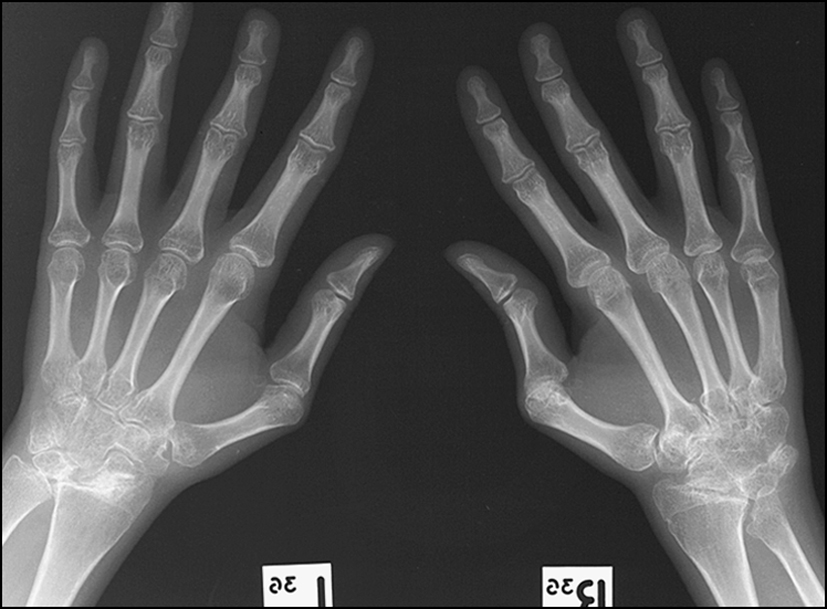
It is appropriate to ask for skeletal and joint imaging in patients with arthritis, joint pain or back pain, if the condition is relevant and important in the current clinical setting. Rheumatoid arthritis, chronic or acute backache, seronegative arthropathy, Paget’s disease and crystal-induced arthropathy are some of the more commonly encountered conditions in the long case examination where the candidate should consider skeletal and joint imaging as appropriate to clarify the diagnosis and assess the disease severity.
The following pages contain some radiographic imaging studies commonly encountered in the examination. The text underneath each image gives an example of the way in which it needs to be interpreted.
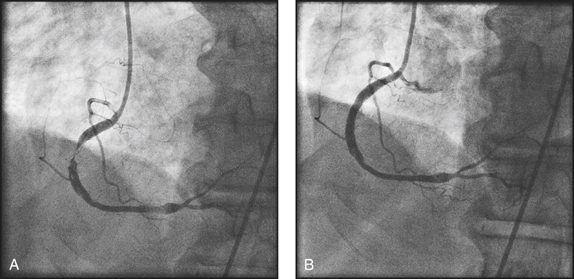
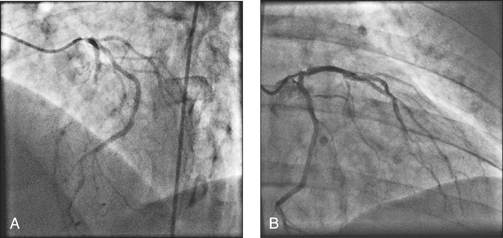
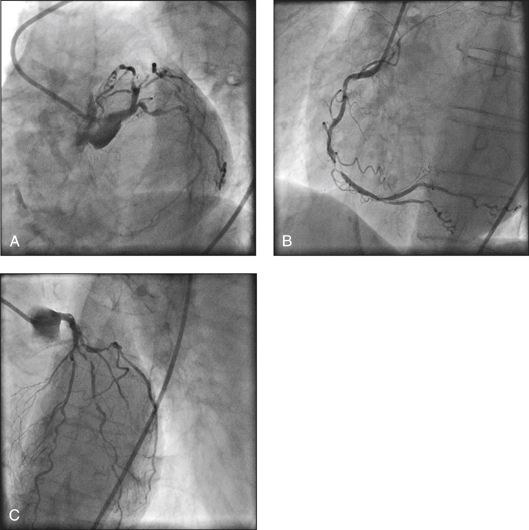
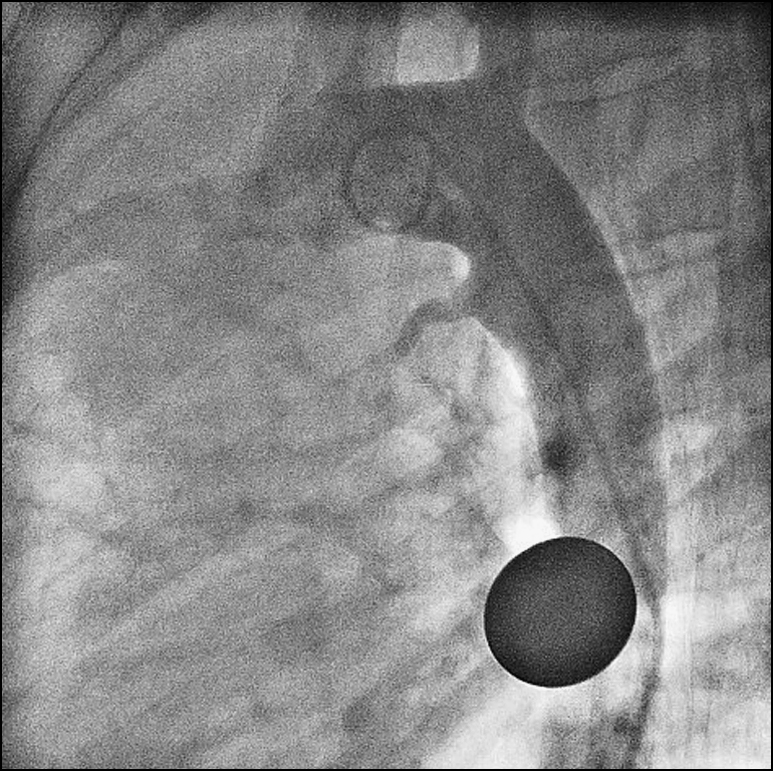
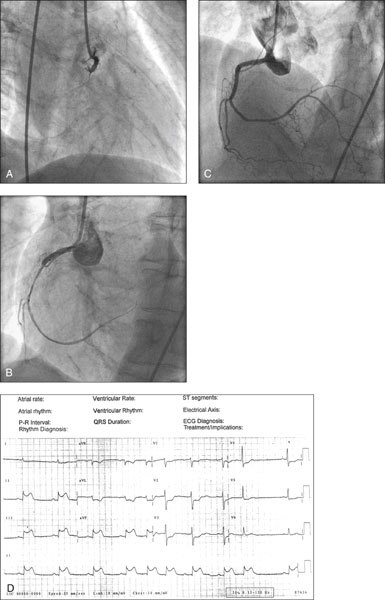
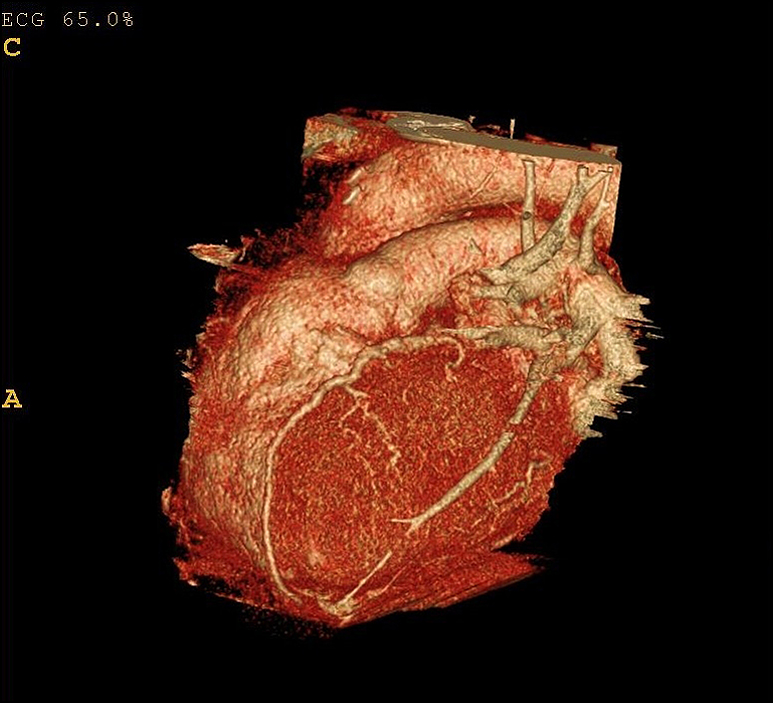
Study the left coronary tree first. Notice the calibre of the vessels along their length and estimate the percentage stenosis of the diameter of narrowed segments due to atherosclerosis. Define the left main segment and the left anterior descending artery (LAD) (the artery that spans all the way to the cardiac apex) and the left circumflex (LCX) artery. The LAD has diagonal and septal branches arising from it. The LCX has obtuse marginal branches and posterolateral branches originating from it. Then go on to examine the right coronary artery and the posterior descending branch (PDA) arising from it. In 10% of the population the PDA arises from the LCX and this is described as left coronary dominance. If the patient has had coronary artery bypass grafts, study the graft angiograms for any stenoses or disease. The grafts could be vein (saphenous) grafts, radial arterial grafts, or left or right internal mammary artery (LIMA or RIMA) grafts. Usually the LIMA is grafted to the LAD.
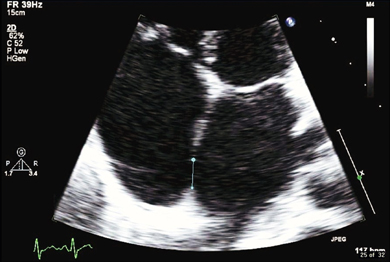
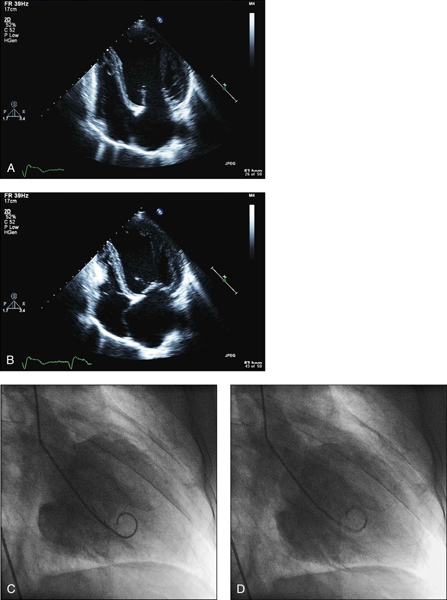
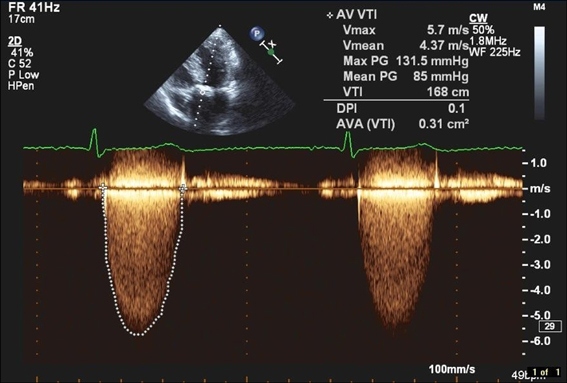
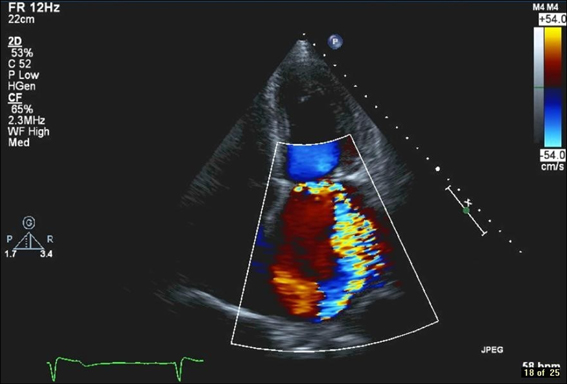
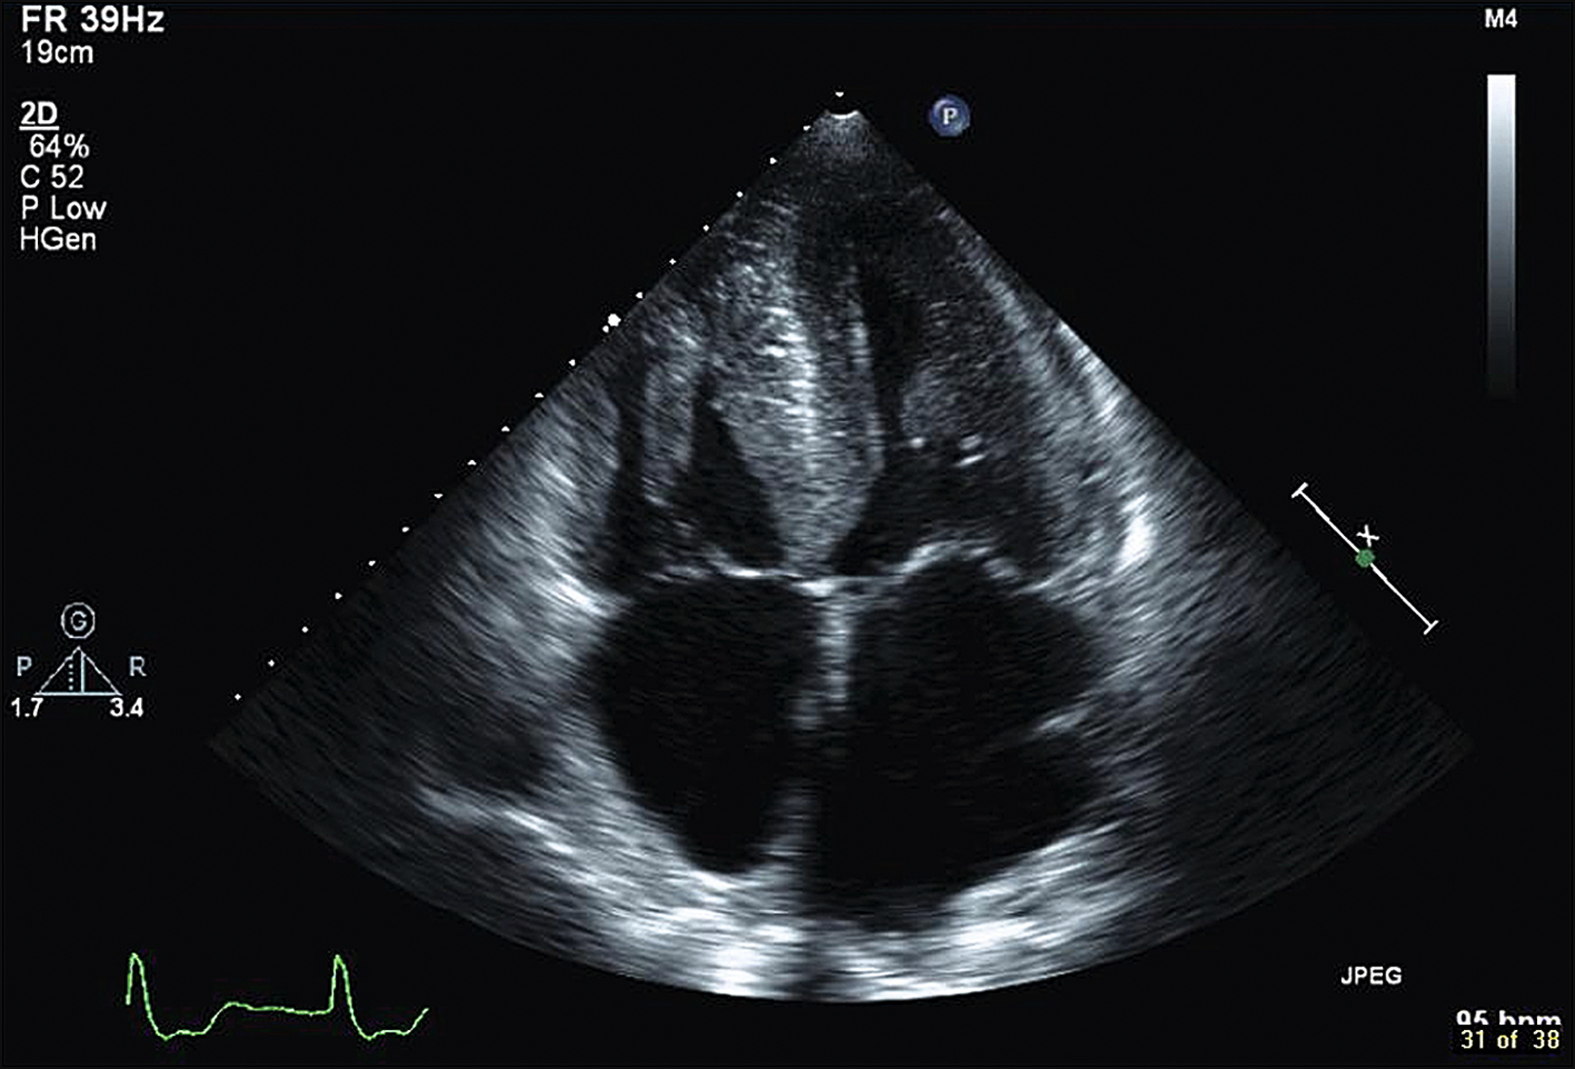
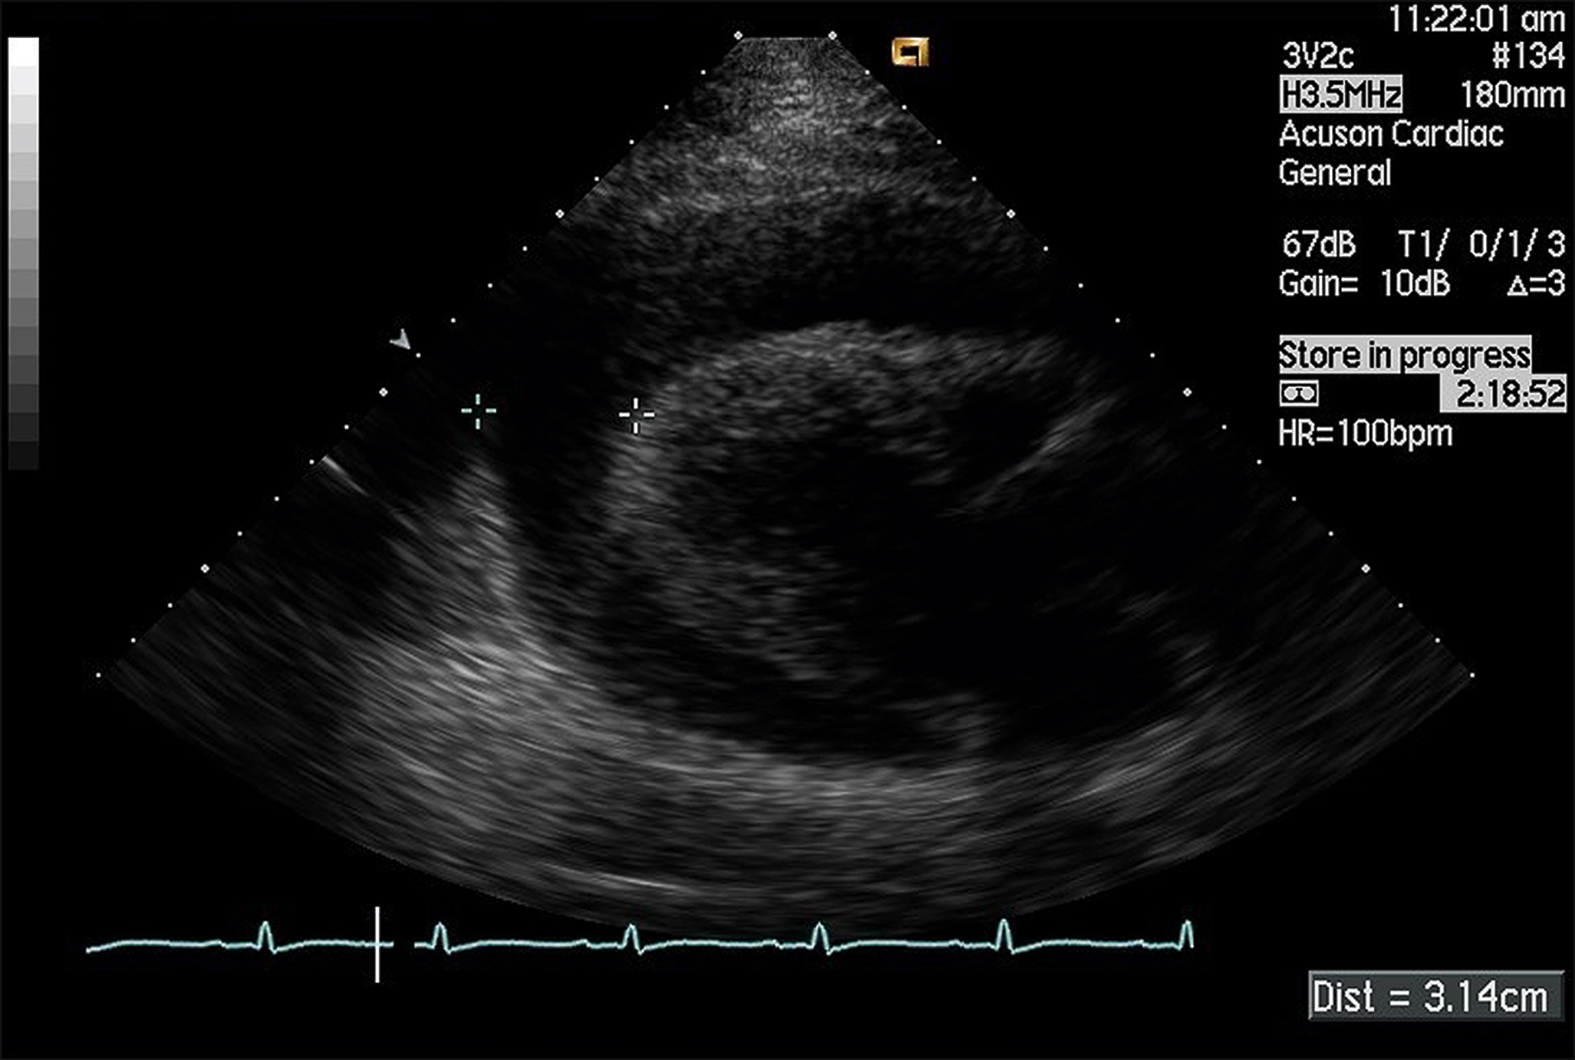
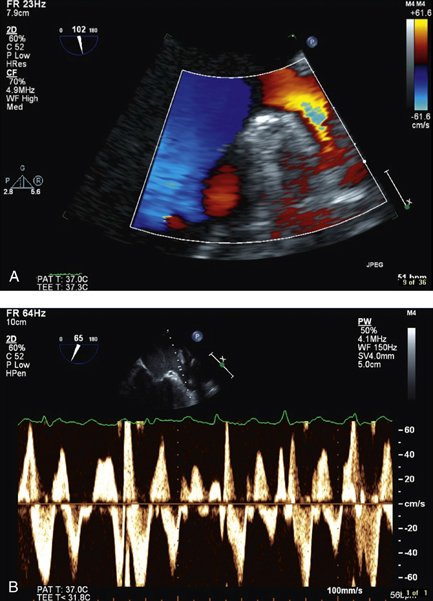
Study the echo images or the report first, looking at left ventricular dimensions and the contractility. Check the ejection fraction. Look at the sizes of the four chambers and left ventricular wall and septal thickness. Then study the valves for stenosis and regurgitation. In the febrile patient look for valvular vegetations. Study the septi for any left/right communications or shunts. If there is a septal defect, note the direction of blood flow. Read the pressure gradient across the stenotic valve. Study the chamber pressures and the estimated pulmonary pressure. In the patient with atrial fibrillation look for intracardiac thrombi, particularly in the left atrial appendage. Examine the pericardial space for any effusion and the pericardium for calcification.
Coronary CT is gaining rapid popularity as a less invasive imaging modality of the coronary arterial anatomy. The study is useful as a screening test for coronary or vein graft stenosis. It is useful in the investigation of patients who are stable and in an intermediate risk category. Calcification of the arteries and metallic stents can cause interference and shadows, compromising its definition. The images are acquired during diastole in the cardiac cycle, and therefore heart rate needs to be slow for satisfactory results. If the heart rate is too rapid, beta-blocker administration is indicated.
Useful in defining cardiac anatomy. Motion artifacts compromise the quality of images.
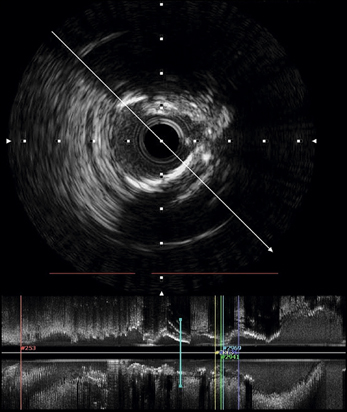
Useful in studying the cross-section of a coronary artery by introducing a rotating ultrasound transducer into the coronary artery. This is more sensitive at detecting and measuring coronary stenosis. This modality is useful in studying stent apposition to the vessel wall after coronary stent deployment.
This imaging technology facilitates a closer scrutiny of the cardiac chambers by introducing an ultrasound probe into the right atrium via the inferior vena cava. The access is from a femoral vein. This modality is particularly useful in the device closure of intracardiac shunts and in performing septal puncture to access the left atrium from the right-sided circulation.
These studies are done to identify and isolate aberrant conduction pathways in the heart that create rhythm disturbances. Catheters are introduced into the heart and placed in the areas of interest, which may include the cardiac chambers, bundle of His, coronary sinus (allows access to conduction pathways to the left ventricle) and pulmonary veins (to study atrial fibrillation). When the culprit pathways have been identified and isolated, they can be ablated with radiofrequency energy (RF ablation) and thus, on most occasions, cure the patient of the rhythm disorder.
[/level-membership-for-internal-medicine-category][not-level-membership-for-internal-medicine-category]ESSENTIALS OF ELECTROCARDIOGRAM READING
The major components to observe in the interpretation of an ECG are the rhythm, rate, axis and morphology, as shown by the P wave, P-R interval, QRS complex, ST segment, T wave and Q-T interval (see box).
It is not necessary to describe the ECG in the traditional and pedantic way, opening with the rate, rhythm and axis and then going on to describe the rest if they are normal. At the examination this may sound superfluous, and there is no time to waste! Candidates should identify the name of the patient and the date the ECG was done, and immediately start describing the abnormalities with references to the clinical findings. The following is a discussion of the various ECG findings commonly encountered in the long case examination.
ST elevation of more than 1 mm in two contiguous leads. In anterior infarcts this would be in the chest leads V2–V6. Left heart infarcts show this in leads I, II and aVL. In inferior infarcts it is seen in leads II, III and aVF. Posterior infarctions show up as reciprocal changes in the anterior leads, and the classic findings include R waves, ST segment depression or tall T waves in leads V1 and V2. Acute myocardial infarction can sometimes present as a new bundle branch block.
Q waves are pathological if they are broader than 1 mm or deeper than 2 mm (or > 25% of the height of the following R wave).
ECG changes consistent with subendocardial ischaemia (acute coronary syndrome) are ST segment depression of 1 mm or more, 0.08 seconds after the J point and corresponding T wave changes. The slope of the ST segment may provide some clues to the severity of the ischaemic phenomenon. Upward sloping indicates less severe disease, horizontal sloping indicates more severe disease, while downward sloping is usually considered the most significant and severe. The T wave changes include T wave flattening and T wave inversion.
Left ventricular hypertrophy is described according to voltage criteria and strain/repolar-isation criteria.
This may be associated with pulmonary stenosis or pulmonary hypertension.
This is associated with right atrial overload, as in pulmonary hypertension and right heart failure.
This is seen in right heart strain associated with pulmonary hypertension, chronic lung disease, pulmonary emboli and mitral valve pathology. Some people may have non-pathological right bundle branch block, which is of no significance.
This is seen in ischaemic heart disease, hypertension, aortic stenosis and cardio-myopathy. Features to notice:
This is the most common cause of left-axis deviation. There is marginal prolongation of the QRS complex with left-axis deviation. Also notice terminal R waves in leads aVR and aVL, deep S wave in lead II, and RSR pattern in leads II, III and aVF. This feature is commonly seen in anterolateral or inferior myocardial infarcts.
This abnormality is associated with right-axis deviation of about 120°, Q waves in leads II, III and aVF, R waves in leads I and aVL. When left posterior hemiblock is present it is almost always associated with right bundle branch block. This combination has a poor prognosis, and progression to complete heart block needing a pacemaker is the likely eventuality.
Right bundle branch block in combination with a left-sided hemiblock or left bundle branch block. There is a high likelihood of progression to complete heart block requiring a permanent pacemaker.
The rate is usually normal and the main abnormality is a prolonged P-R interval (> 200 msec or 5 mm).
The sinus rate is normal but the ventricular rate is slower than normal. The main abnormality is the gradual prolongation of the P-R interval until one P wave is not conducted to the ventricles. A new cardiac cycle begins following the non-conducted P wave. Rhythm is usually irregular. This pattern has an association with inferior myocardial infarctions.
The sinus rate is normal but the ventricular rate is a definite fraction of the sinus rate. There are more P waves than QRS complexes, as only one P wave is conducted for several subsequent P waves. Note the block, which is 2:1, 3:1 or more. This condition is usually associated with anterior myocardial infarctions.
The sinus rate is normal but the ventricular rate is much slower. The ventricular rate is dependent on the site of the escape pacemaker (if it is in the AV junction, the rate would be around 40–60 bpm; if ventricular, the rate would be < 30 bpm). The P-R interval changes constantly and the P wave has no relationship to the QRS complex (AV dissociation).
A broad complex tachycardia with a rate exceeding 100 bpm. In practice, however, it is common to see the rate at 140–200. The rhythm is regular. It is called
sustained ventricular tachycardia if it persists beyond 30 seconds. The QRS complex is longer than 140 milliseconds. There is evidence of AV dissociation, fusion beats and variable retrograde conduction. QRS pattern of all precordial leads should be in concordance. There may be features of left-axis deviation in the presence of right bundle branch block. A broad complex ventricular rhythm at a rate of less than 100 bpm is called
accelerated idioventricular rhythm.
The rhythm is regular and the rate is 140–280 bpm. QRS complex follows each P wave, but the P wave may also be buried in the QRS complex or the T wave and not be visible.
The rhythm is most often regular but may vary if the degree of AV nodal block changes. Ventricular rate may vary between 60 and 150, again depending on the block. There are characteristic atrial oscillations described as ‘sawtooth’-shaped flutter waves. These flutter waves occur regularly at a rate of 250–300 per minute. Depending on the block, the rhythm should be described as atrial flutter with 2:1, 3:2 or 4:1 block.
The rhythm is regular and the rate is 100–200 bpm. The P wave appears inverted and is located immediately before or after the QRS complex due to retrograde conduction.
This conduction defect occurs due to ventricular pre-excitation due to the presence of an accessory AV conduction pathway. The P-R interval is shorter than 110 milli-seconds and the QRS complex has a slurred upstroke (delta wave). The patient may be in atrial fibrillation. A negative delta wave in lead V1 suggests a right-sided bypass tract.
Patients with hypertrophic obstructive cardiomyopathy may show non-specific ECG features. Evidence of left ventricular hypertrophy and diffuse, widespread, deep and broad Q waves are some commonly seen abnormalities.
Blood test results encountered in the examination include the full blood count, electrolyte profile, renal function indices, liver function studies, endocrine studies and serology. Serological tests can be either infective or autoimmune serology.
Here the focus should be on haemoglobin level, haematocrit, mean cell volume, mean cell haemoglobin concentration, and white cell count with differential and platelet count.
Candidates should know the normal values of all the above so that an abnormal value can be spotted immediately and interpreted accurately. When an abnormality in the blood count is present, ask for the report of the blood film for further clarification and, if appropriate, ask for other tests such as the results of the bone marrow biopsy, haemolytic screen, iron studies and vitamin B
12 and folate levels in anaemia, results of the blood culture in the setting of significant leucocytosis and febrile illness, and antiplatelet antibodies in idiopathic thrombocytopenia.
Neutrophilia is diagnosed when the neutrophil count is elevated above 7.5 × 10
9/L. The possible causes are:
Lymphocytosis is diagnosed when the lymphocyte count is elevated above 4 × 10
9/L. The possible causes are:
Eosinophilia is diagnosed when the eosinophil count is elevated above 0.5 × 10
9/L. The possible causes are:
Basophilia is diagnosed when the basophil count is elevated above 0.1 × 10
9/L. The possible causes are:
Leucopenia is diagnosed when the white cell count is less than 4 × 10
9/L. The possible causes are:
Microangiopathic haemolytic anaemia (MAHA) should be suspected in an anaemic and coagulopathic patient if the blood film report shows fragment cells, helmet cells, polychromasia and reticulocytosis. The possible causes include:
This should be performed in cases of thromboembolic disease with a strong family history or recurrent spontaneous venous thrombosis in any patient, arterial throm-bosis in a patient aged under 30 years, and venous thrombosis in a patient aged under 40 years without a predisposing condition.
Thrombophilic screen involves testing for the following:
Look at the sodium level, potassium level, chloride level, bicarbonate level and the renal function indices. If any abnormality is noticed, try interpreting it in the context of the clinical setting or a causative medication.
The normal serum sodium level is 136–144 mmol/L.
This can be caused by hypovolaemia and dehydration as well as primary hyperaldosteronism, Cushing’s syndrome and excess salt intake. Patients present with lethargy, irritability, fever, nausea, vomiting and confusion. Management is with controlled hydration using 4% dextrose with 1/5 normal saline or 5% dextrose solution together with judicious diuretic therapy.
This can be caused by inappropriate secretion of antidiuretic hormone (SIADH), congestive cardiac failure, severe hepatic failure, Addison’s disease, aldosterone insufficiency, hypothyroidism, diuretic therapy, salt-losing nephropathy, renal tubular disorders and water retention.
The normal serum potassium level is 3.5–5.0 mmol/L.
This can be caused by ACE inhibitor therapy, potassium-sparing diuretics, inadvertent potassium supplementation, acidosis, blood transfusion, haemolysis, severe renal failure, rhabdomyolysis and hypoaldosteronism.
Patients present with severe muscular weakness, paralytic ileus, symptomatic brady-cardia and heart block. Management of hyperkalaemia includes administration of 10 mL 10% calcium gluconate if there are electrocardiographic changes of hyperkalaemia (peaked T waves, small P waves and wide QRS complexes). Rapid reversal of potassium levels can be achieved by giving 50% glucose with insulin infusion, but the levels may rise again in a few hours. Concurrently administer oral or per rectum resonium 15–30 g and repeat administration as guided by subsequently measured serum potassium levels. Hyperkalaemia of severe renal failure needs haemodialysis.
Causes of hypokalaemia include loop diuretic therapy, primary hyperaldosteronism, Cushing’s syndrome, renal tubular disease, alkalosis and hyperthyroidism. Therapy with drugs such as verapamil, beta-agonists and amiodarone should be excluded.
Hypokalaemia presents with muscle weakness or tetany. Significant hypokalaemia can lead to rhabdomyolysis. To manage hypokalaemia, usually oral supplementation alone will suffice. If the level is < 2.9 mmol/L, parenteral supplementation with KCl 10 mmol/L over an hour through a central venous line is indicated. The patient’s cardiac function should be monitored during this infusion. It should be repeated as guided by the subsequently performed serum potassium levels.
The normal serum calcium level is 2.2–2.5 mmol/L. The serum calcium level varies with the serum albumin level, and the correction can be made using the following formula:
This can be caused by primary hyperparathyroidism, squamous cell carcinoma of the lung, cancer with bony metastases, multiple myeloma, sarcoidosis, vitamin D intoxi-cation, milk-alkali syndrome and thiazide diuretics.
Significant hypercalcaemia presents with anorexia, nausea, vomiting, constipation, polyuria, severe weakness, stupor and eventually coma.
Causes of hypocalcaemia include hypoparathyroidism, vitamin D deficiency, osteomalacia, acute pancreatitis, chronic renal failure, malignancy with osteoblastic metastases, and pseudohypoparathyroidism.
Patients present with circumoral and distal limb paraesthesias, painful muscle cramps, tetany and seizures. Patients may also have Chvostek’s sign and Trousseau’s sign.
Symptomatic hypocalcaemia and corrected serum levels of < 1.88 mmol/L should be treated with parenteral calcium in the form of 10% calcium gluconate.
This diagnosis should be suspected when plasma bicarbonate (HCO
3) is less than 10 mmol/L and PaCO
2 is low with a low pH (a low HCO
3 value can be seen in respiratory alkalosis as well as in metabolic acidosis). The anion gap helps the interpretation of metabolic acidosis in more detail, and is calculated as follows:
The normal value is 10–14 mmol/L. Metabolic acidosis could be with a normal or increased anion gap.
Metabolic acidosis with a normal anion gap is due to an associated loss of HCO
3 molecules from the body. The possible causes are:
This condition is managed with volume repletion and correction of associated hypokalaemia with potassium supplementation.
Buy Membership for Internal Medicine Category to continue reading.
Learn more here
[/not-level-membership-for-internal-medicine-category]
Mastering the Medical Long Case