Physiology
Cardiovascular Examination
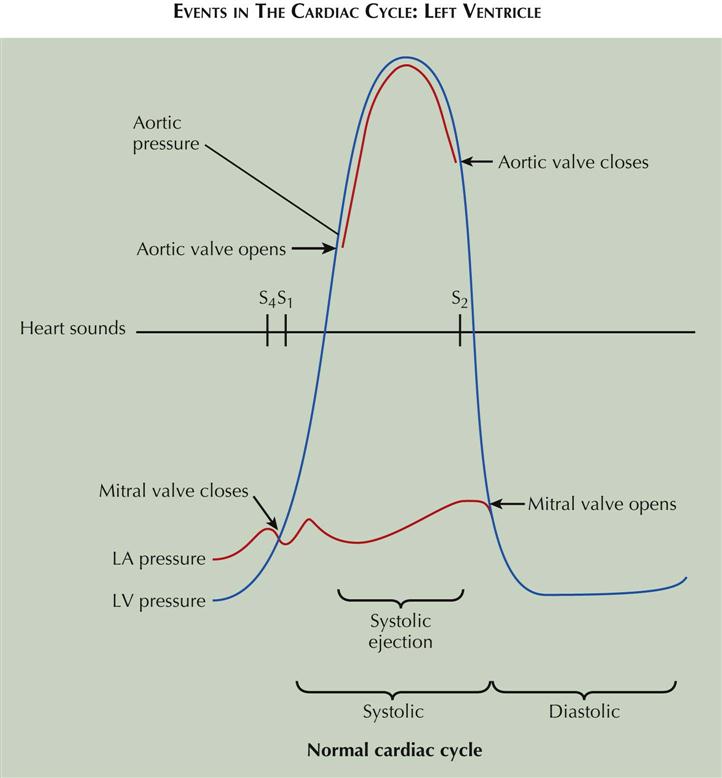
Events in the Cardiac Cycle: Left Ventricle
The events occurring during the cardiac cycle are driven by the left ventricular (LV) pressure. The mitral valve closes and results in the first heart sound (S1) when LV pressure rises above left atrial (LA) pressure (see Plate 2-1). The aortic valve opens when LV pressure rises above aortic diastolic pressure and is the onset of systolic ejection. The aortic valve closes and produces the second heart sound (S2) when LV pressure falls below aortic pressure and terminates systolic ejection. The mitral valve opens when LV pressure falls below LA pressure. The fourth heart sound (S4) occurs in late diastole following atrial contractions.
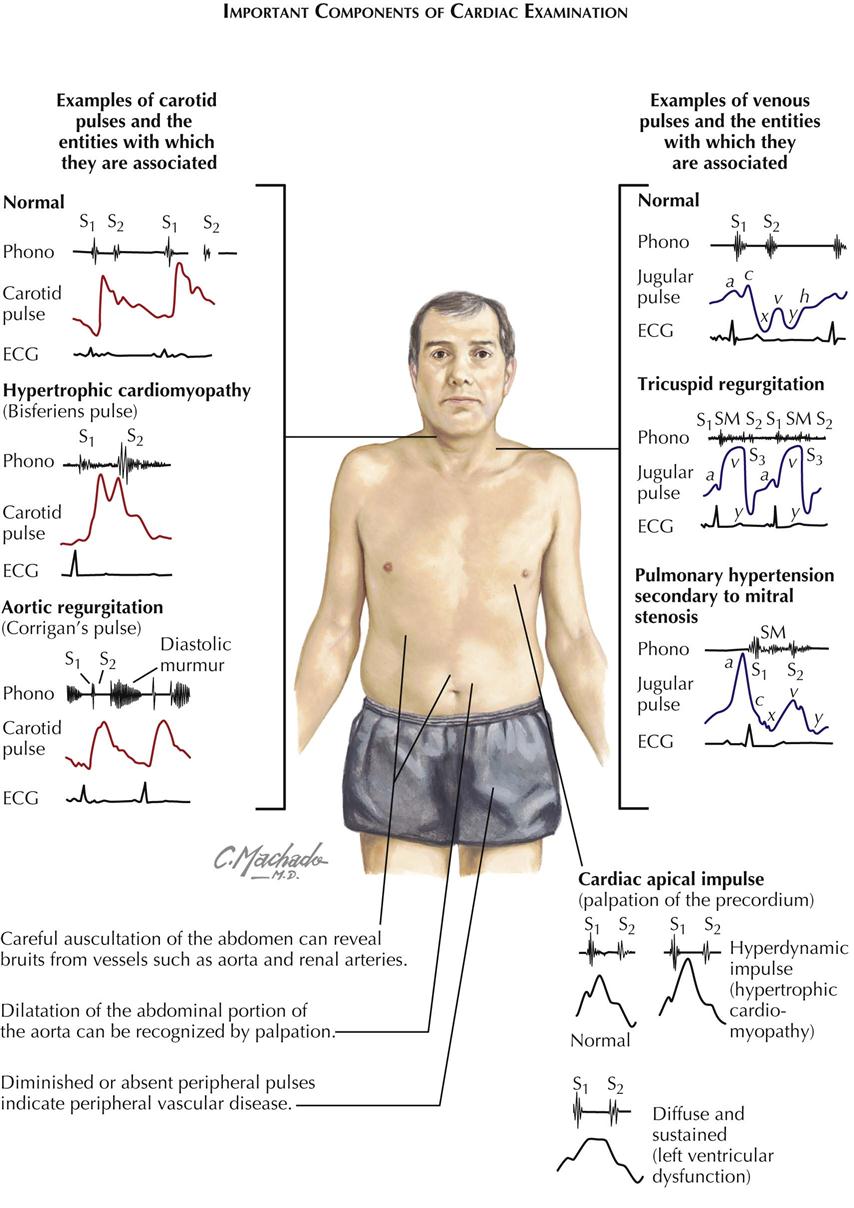
Cardiac auscultation is not the only way to examine the cardiovascular system. Peripheral vessels reflect what is occurring in the cardiovascular system; for example, carotid and femoral artery examination can reveal peripheral vascular disease. Bruits over these vessels may indicate carotid stenosis or aortofemoral stenosis. An abdominal bruit may indicate renal artery stenosis. A decrease in blood pressure in either arm suggests subclavian artery stenosis. If the ankle-brachial index (ratio of systolic pressure in arm to systolic pressure in ankle using Doppler technique) is less than 0.9, some peripheral artery disease may be present.
Jugular venous pulsations seen when the patient is lying with the upper body elevated to 30 degrees suggests elevated RA pressure of several causes.
Precordial palpation before auscultation of the heart can help the examiner make the proper cardiac diagnosis. The apical impulse can suggest LV hypertrophy (enlargement) if sustained and slow rising. Palpation along the left sternal border may reveal a parasternal lift, which suggests an elevated right ventricular (RV) pressure of about 40 mm Hg. Plate 2-2 illustrates some examples of carotid pulses and venous pulsations and cardiac apical impulses associated with specific cardiac disease states.
The basic instrument of auscultation is the human ear. Although the stethoscope has technical advantages, it often distorts, decreases, or selectively emphasizes certain vibrations. Frequently, the naked ear is superior to the stethoscope in the detection of low-pitched vibrations (S3, S4) because the ear is a larger collector of sound and fuses auditory with palpatory perception.
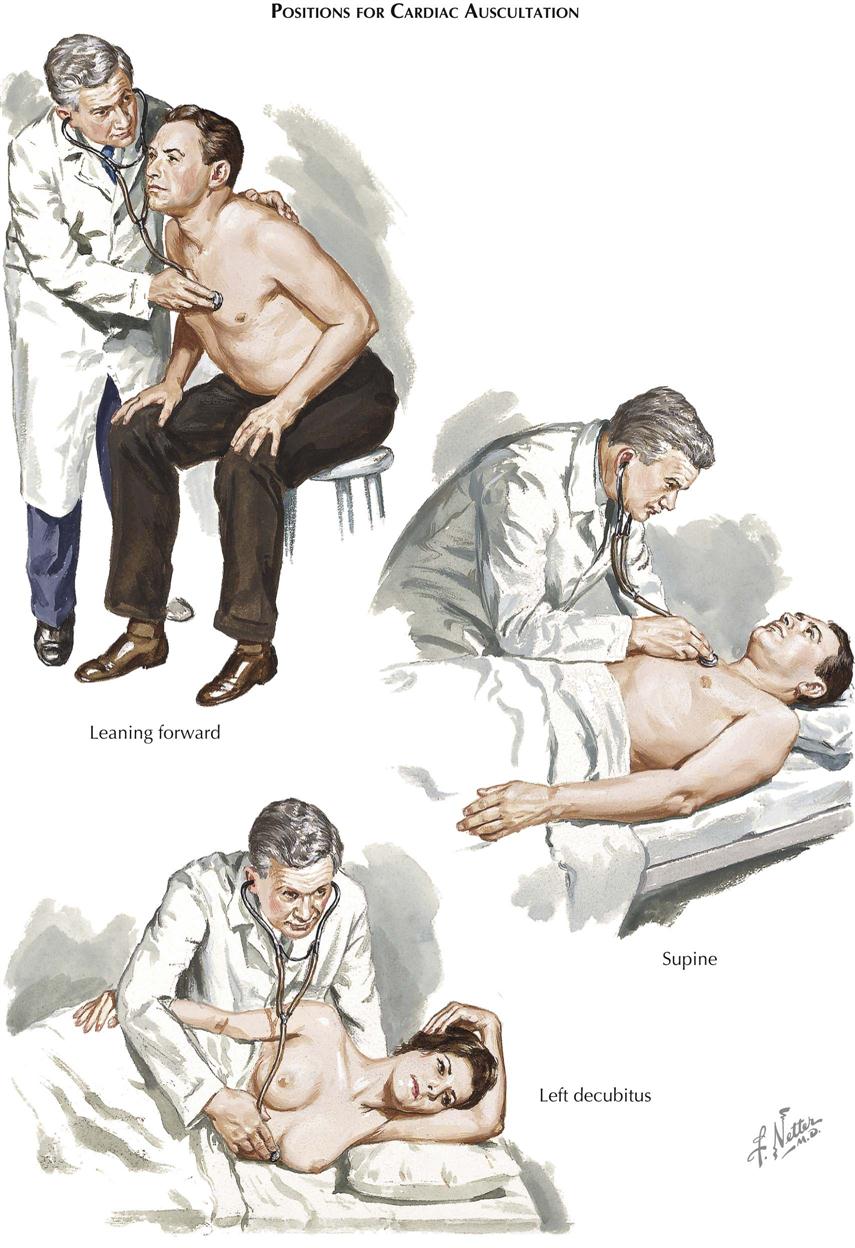
Positions for Cardiac Auscultation
In auscultation, various patient positions can be used (see Plate 2-3). The patient may be sitting, supine, lying on the left side, or bent forward to increase the contact of the apex with the chest wall, as preferred for mitral or LV sounds and murmurs. The left side (left decubitus) position accentuates the rumbling murmur of mitral stenosis. The bent-forward position is preferred for aortic diastolic murmurs, whereas the supine position is best for pulmonic and tricuspid murmurs.
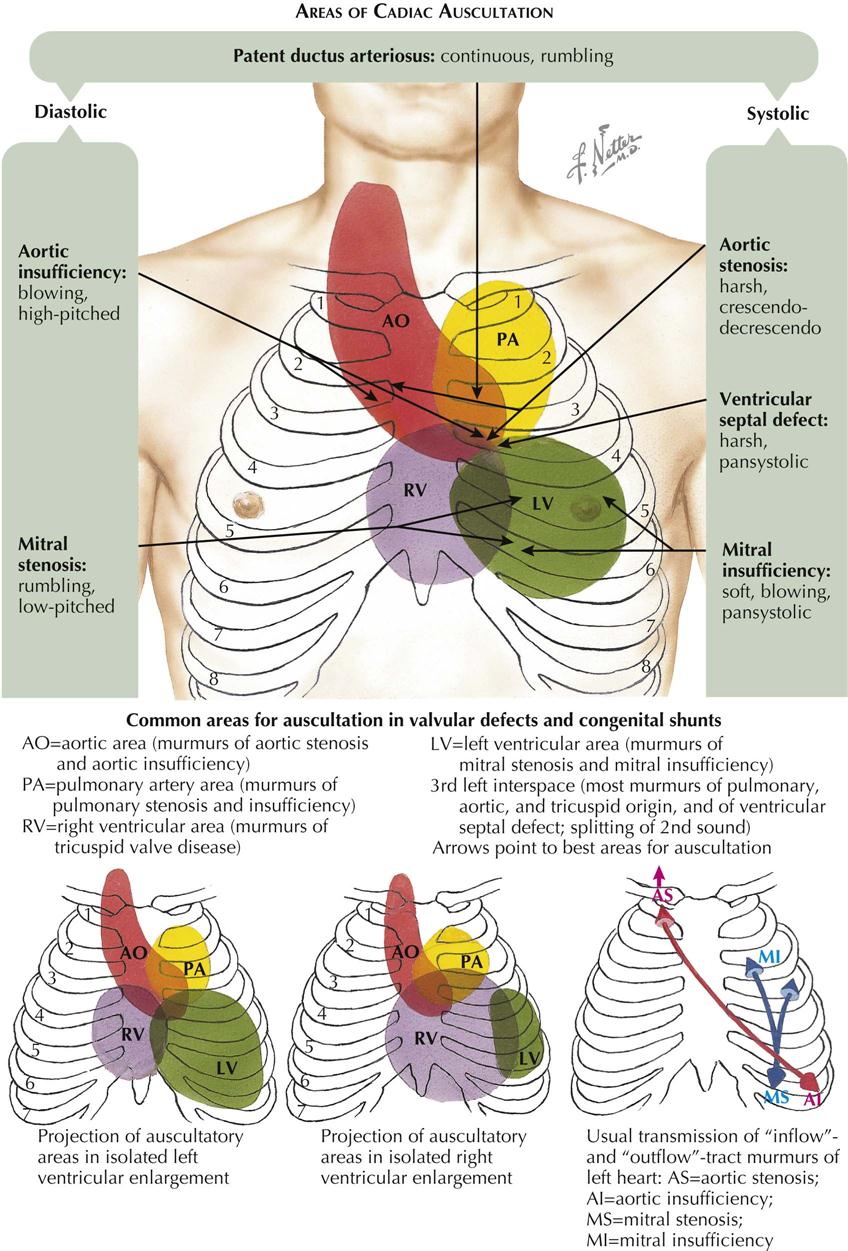
Areas of Cardiac Auscultation
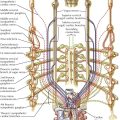
The conventional designations for areas of auscultation have been mitral, tricuspid, aortic, and pulmonary. Current understanding divides the thorax into seven areas: left ventricular, right ventricular, left atrial, right atrial, aortic, pulmonary, and descending thoracic aortic (see Plate 2-4).
Left Ventricular Area
The apical area (“mitral” area) is the best location for detecting not only the murmur of mitral stenosis or insufficiency but also the LV or atrial gallops and the aortic component of the second sound (A component of II). The murmurs of aortic stenosis and especially of aortic insufficiency also are often heard well at this location. However, these vibrations are detected over a larger area formed by the entire left ventricle, centering around the apical beat and extending to the fourth and fifth left interspaces medially and to the anterior axillary line laterally. In patients with ventricular enlargement, the sound shifts to either the left or the right.
Right Ventricular Area
The “tricuspid” area is renamed the right ventricular area. In addition to the murmurs of tricuspid stenosis and insufficiency, RV and atrial gallops and the murmurs of pulmonary insufficiency and ventricular septal defect can be well heard here. The RV area includes the lower part of the sternum and the fourth and fifth interspaces, 2 to 4 cm to the left and 2 cm to the right of the sternum. This area may extend also to the point of maximal impulse, in the presence of severe RV enlargement; the “apex” in such patients is formed by the right ventricle.
Aortic Area
The aortic component of S2 and the murmurs of aortic valve defects are often heard well at the third left interspace (Erb’s area). This point is frequently more revealing than the second right interspace, except in patients with dilatation of the ascending aorta, where the manubrium or the second right interspace may be more informative. The aortic area should designate both the aortic root and part of the ascending aorta. The vibrations heard best in this area include the murmurs caused by aortic stenosis, aortic insufficiency, augmented flow across the aorta or dilatation of the ascending aorta, and abnormalities of the neck arteries, as well as the aortic ejection click and aortic component of S2.
Pulmonary Area
The pulmonary area should refer to the pulmonary artery rather than the pulmonary (pulmonic) valve. The murmurs of pulmonary stenosis and insufficiency, the murmur caused by increased flow or dilatation of the pulmonary artery, the pulmonary ejection click, the pulmonary component of the second sound (P component of II), and the murmur of patent ductus arteriosus are heard best here. The pulmonary area is formed by the second left interspace near the sternal edge and extends upward to the clavicle and downward to the third left interspace near the sternal margin. However, it may also extend posteriorly at the level of the fourth and fifth dorsal vertebrae.
Most Significant Auscultatory Findings
Heart Sounds
The first heart sound (S1) is often louder over the LV area (apex and midprecordium), whereas the second heart sound (S2) is frequently louder over the aortic and pulmonary areas (base). The first sound is a long noise of lower tonality, whereas the second sound is shorter and sharper.
In normal adolescents or young people, S1 may be split. The best area for hearing this split sound is at the third left interspace. This splitting is not influenced by respiration. The loudness of S1 is decreased in myocarditis, myocardial infarction (MI), myocardial fibrosis, hypothyroidism, mitral insufficiency (soft), aortic insufficiency, and pericarditis with effusion. S1 is increased in mitral stenosis, systemic hypertension, and hyperthyroidism.
The second sound is frequently split during inspiration and in normal children and young people. The best area for hearing this splitting is the third left interspace, close to the sternum (Erb’s point). S2 has an increased loudness of the aortic component in systemic hypertension, coarctation of the aorta, and aortitis. Decreased loudness of S2 characterizes aortic stenosis. The aortic component may be so delayed as to follow the pulmonary component, a paradoxical splitting. S2 has increased loudness of the pulmonary component in pulmonary hypertension, whereas loudness is decreased in pulmonary stenosis. The pulmonary component not only is smaller but also is delayed, causing a wider splitting. S2 has wider, fixed splitting in conditions presenting a diastolic overload of the right side of the heart and in right bundle branch block, because of a delay in the pulmonary component. Patients with left bundle branch block may present with such a delay in the aortic component as to cause paradoxical splitting.
The third heart sound (S3) may be normal in children, adolescents, and young athletes but may be audible over the LV or RV area in ventricular overload, myocarditis, tachycardia, or heart failure.
The fourth heart sound (S4) is not heard in the normal heart. S4 is audible over the LV area in hypertension, during myocardial ischemia, or when the ventricle is stiff and noncompliant, as in diastolic dysfunction. S4 can also be heard in patients with ventricular volume overload, myocarditis, tachycardia, atrial flutter, and complete or incomplete atrioventricular (A-V) block or obstruction. The fourth sound is then called atrial gallop. A left atrial gallop is frequently heard in aortic stenosis or systemic hypertension. A right atrial gallop is often heard in pulmonary stenosis or pulmonary hypertension. A slightly different type is the summation gallop, caused by the summation of S3 and S4. This is most often seen in patients with tachycardia and grade 1 A-V block.
A systolic ejection click can be heard over either the pulmonary area (pulmonary ejection sound) or the aortic area (aortic ejection sound). These clicks are caused by “doming” of the aortic or pulmonary valve; the aortic valve may be bicuspid. These ejection sounds occur with dilatation of the aorta or pulmonary artery or narrowing of the aortic or pulmonary valve, usually with poststenotic dilatation. The ejection click is a high-frequency sound due to abrupt halting of the valve opening.
A diastolic opening snap can be heard in the fourth left interspace, close to the sternum, over the entire LV area, or even over the entire precordium, in patients with a pliable noncalcified valve. This is the mitral opening snap most often heard in mitral stenosis. Occasionally it can be heard in diastolic overload of the left side of the heart (mitral insufficiency, patent ductus). A tricuspid opening snap is audible over the RV area in patients with tricuspid stenosis and occasionally can be heard in diastolic overload of the right ventricle (tricuspid insufficiency, atrial septal defect).
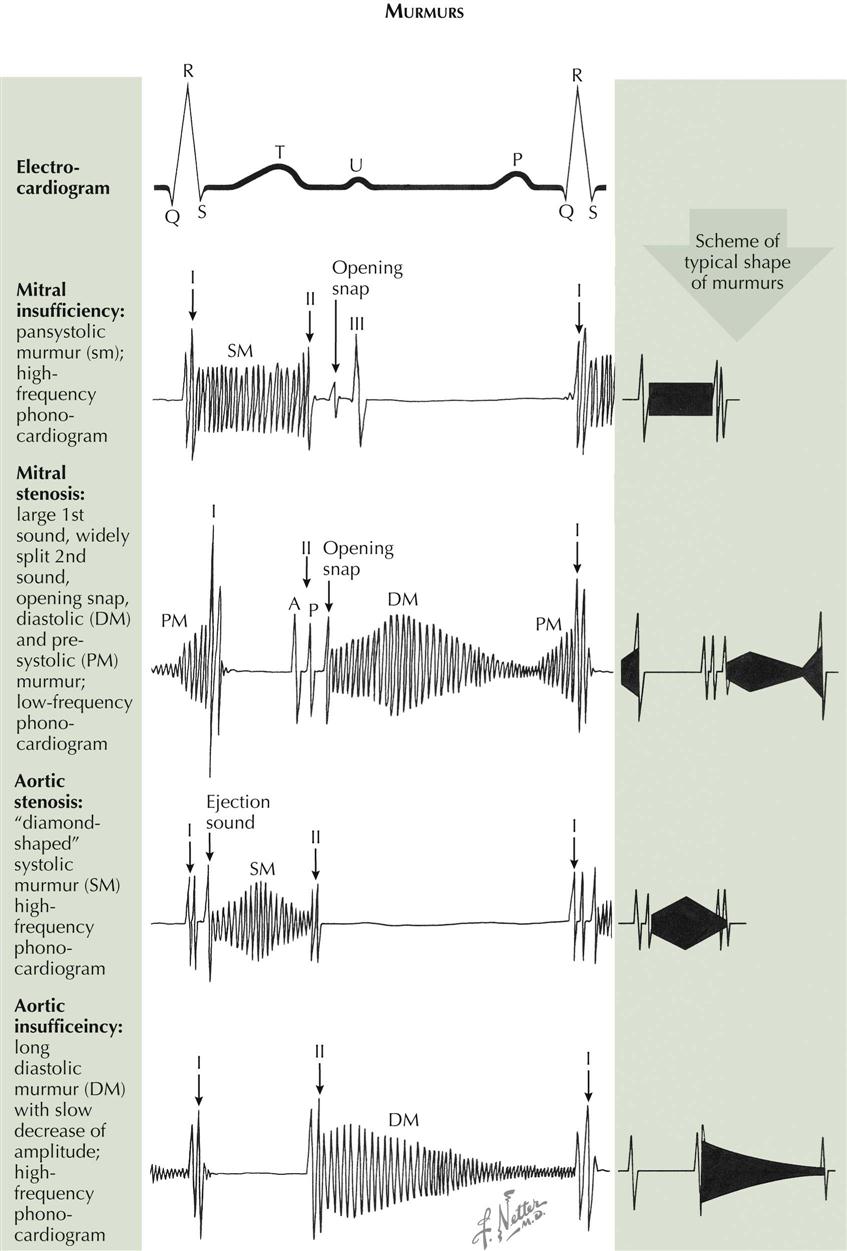
Murmurs
The regurgitant murmur of A-V valve insufficiency is holosystolic and usually loud (see Plate 2-5). The murmur of mitral insufficiency is maximal over the LV area and easily audible at the left axilla, whereas the murmur of tricuspid insufficiency is maximal over the RV area and is well heard over the right precordium. Inspiration or inspiratory apnea increases the loudness of the tricuspid murmur but decreases the loudness of the mitral murmur.
The murmur of A-V valve stenosis is a typical, low-pitched rumble which acquires higher pitch and greater loudness in presystole (presystolic accentuation) if there is sinus rhythm. It is heard best in mitral stenosis in the fourth left intercostal space, halfway between the apex and the sternal border. In tricuspid stenosis this rumble is heard best over the RV area. This murmur becomes louder in inspiration because of increased flow across the tricuspid valve during inspiration.
The regurgitant murmur of semilunar valve insufficiency is a high-pitched, blowing, occasionally musical decrescendo. In aortic insufficiency the murmur is loudest in the third left interspace (Erb’s area), and can be followed along the left sternal border toward the apex. If the ascending aorta is dilated, the murmur is louder in the second right interspace and can be followed downward along the right sternal border. In pulmonary insufficiency the murmur is loudest over the second left interspace and can be followed downward from the upper left to the lower right part of the sternum. If the patient has pulmonary hypertension, the murmur sounds similar to aortic regurgitation. If the pulmonary artery pressure is normal or low, the murmur may have a rumbling character.
The stenotic murmur of the semilunar valves is the loudest of all murmurs. It is harsh, starts slightly after S1 with aortic valve opening, and is often preceded by an ejection click, especially if the valve is bicuspid and mobile. The murmur often has a crescendo-decrescendo quality and ends before or with S2, depending on the severity of the stenosis. In aortic stenosis the murmur is maximal in the third left or second right interspace. It is readily heard over the suprasternal area and the carotid arteries and can be heard at the apex. In subvalvular aortic stenosis, it is maximal over the LV area. In pulmonary stenosis the murmur is best heard over the pulmonary area. It radiates moderately downward and often can be heard in the back over the lungs.
The murmur caused by a ventricular septal defect is long, harsh, and pansystolic. It is heard best over the RV area.
The murmur caused by patency of the ductus arteriosus is a continuous, machinery-like murmur because aortic systolic and diastolic pressures are higher than pulmonary systolic and diastolic pressures. It is best heard over the first and second intercostal spaces.
Friction Rubs
Friction rubs can be heard over various areas and resemble the sound made by rubbing new leather. Friction rubs can be heard in atrial systole, ventricular systole, and ventricular diastole (i.e., three-component rub).
Neural and Humoral Regulation of Cardiac Function
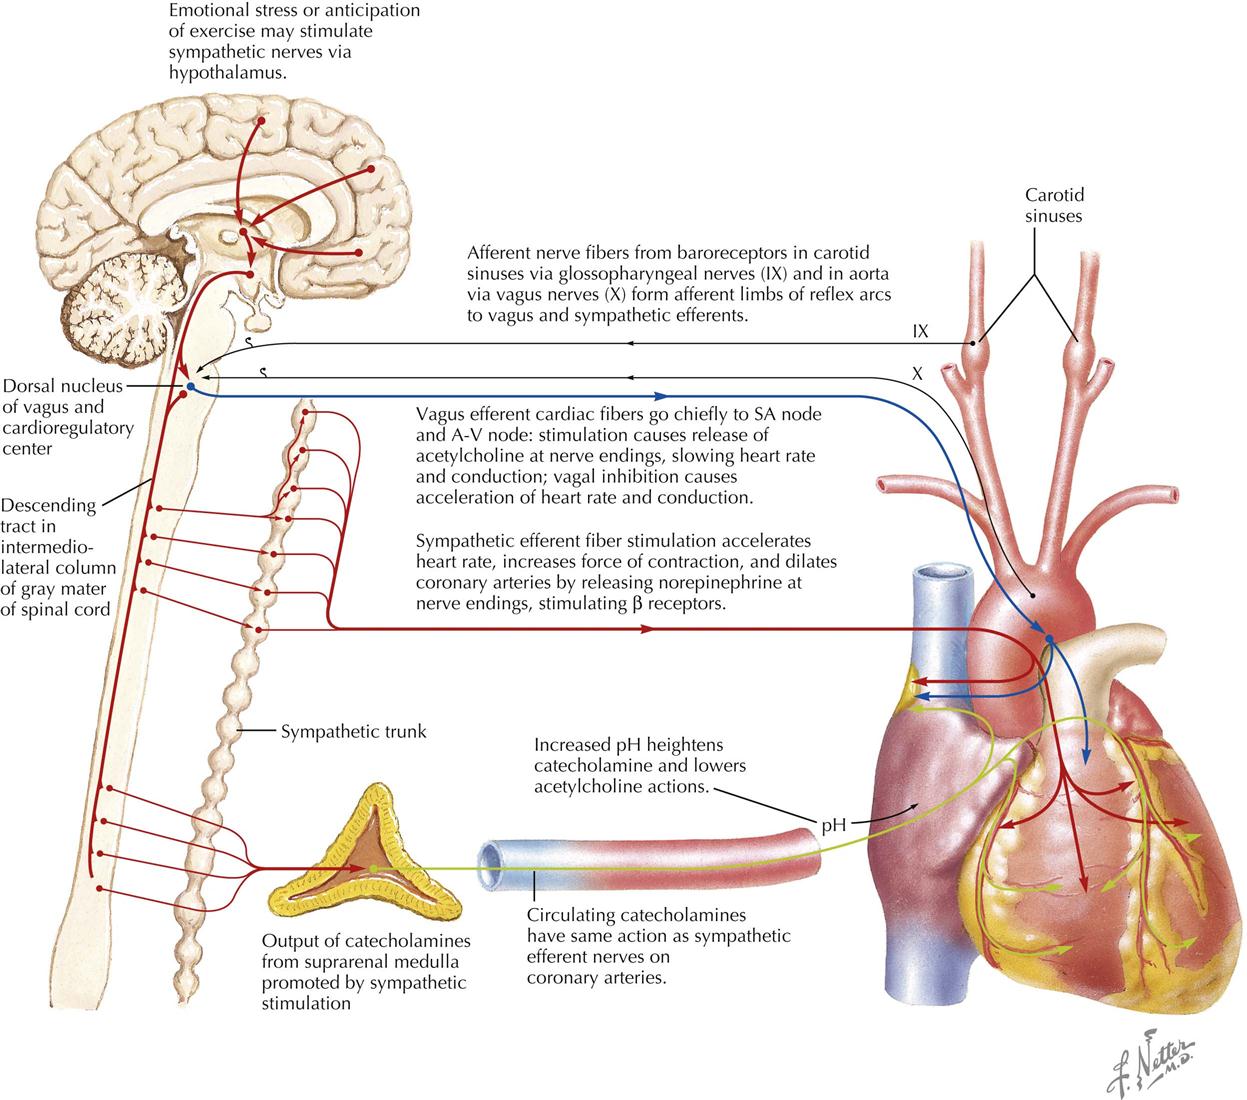
The efferent innervation of the heart is controlled by both the sympathetic nervous system and the parasympathetic nervous system. Afferent fibers accompany the efferents of both systems. The sympathetic fibers have positive chronotropic (rate-increasing) effects and positive inotropic (force-increasing) effects. The parasympathetic fibers have a negative chronotropic effect and may be somewhat negatively inotropic (but small and masked) in the intact circulatory system by the increased filling that occurs when diastolic filling time is increased.
The heart is normally under the restraint of vagal inhibition, and thus bilateral vagotomy increases the heart rate. Vagal stimulation not only slows the heart but also slows conduction across the A-V node. Sectioning of the cardiac sympathetics does not lower heart rate under normal circumstances.
The totally denervated heart loses some (but surprisingly little) of its capacity to respond to changes in its load. The denervated heart still responds to humoral influences, more slowly and less fully, but it is remarkable how well the secondary mechanisms, such as the suprarenal medullary output of catecholamines, can substitute for the primary mechanism that controls heart rate in exercise.
The nervous mechanisms controlling heart rate include the baroreceptor reflexes, with afferent arms from the carotid sinus, the arch of the aorta, and other pressoreceptor zones operating as negative feedback mechanisms to regulate pressure in the arteries. These reflexes affect not only heart activity but also the caliber of the resistance vessels in the vascular system.
The heart is also affected reflexively by afferent impulses via the autonomic nervous system. The response may be tachycardia or bradycardia, depending on whether the sympathetic or parasympathetic system is activated more strongly in the individual patient. Tachycardia is the common response in excitement.
Physiologic Changes During Pregnancy
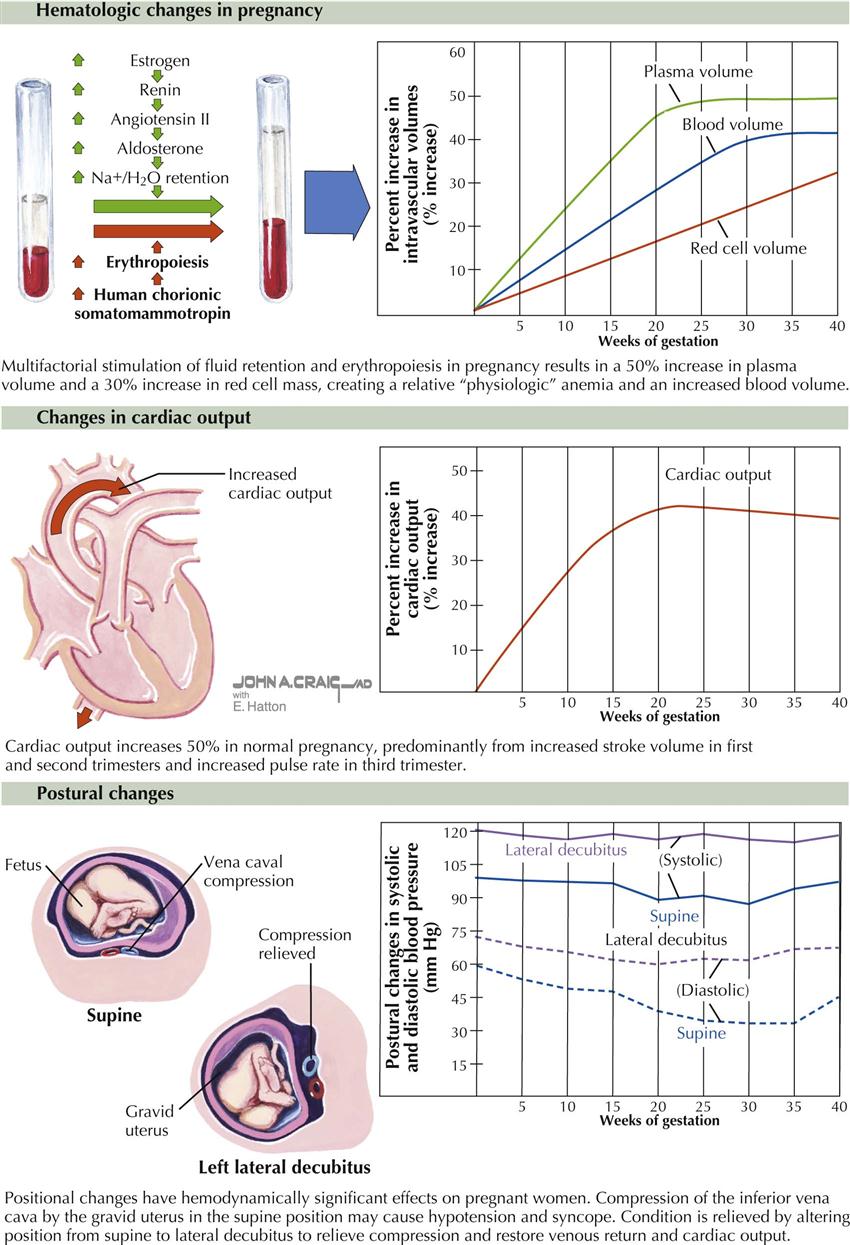
During a normal pregnancy, a woman undergoes multiple cardiovascular physiologic changes to support the increased metabolic demands of the woman and the unborn child. The changes are fairly typical in a healthy pregnant woman but may vary in magnitude from patient to patient. Early in the pregnancy, the first trimester, the changes are usually mild or may not be evident. The classic changes include the following;
Anatomic factors related to the enlarged uterus can also influence physiologic changes, particularly in the third trimester. Inferior vena cava compression can increase femoral venous pressure and can elevate the diaphragm, which in turn can shift the axis of the heart and alter the axis of the electrocardiogram toward the left.
Cardiac Catheterization
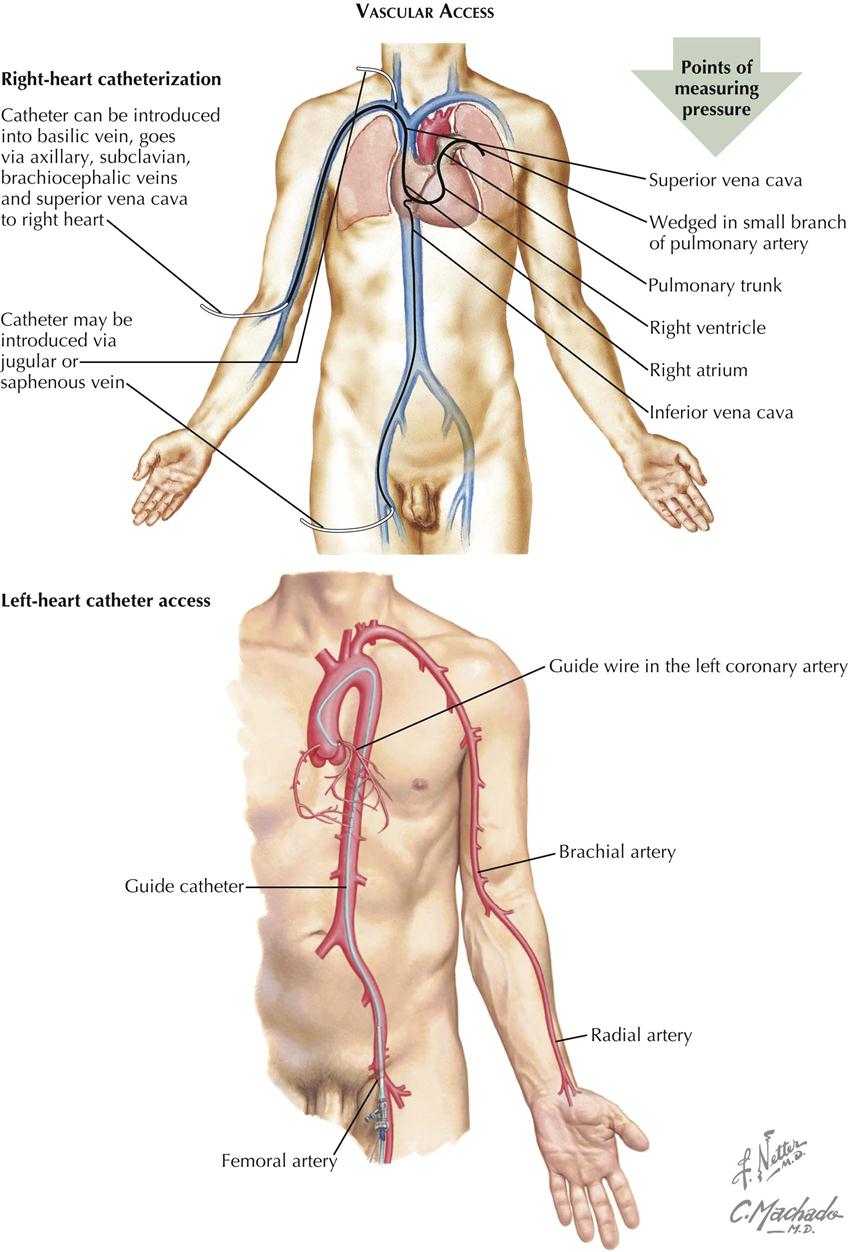
Vascular Access and Right-Sided Heart Catheterization
Cardiac catheterization, first attempted by Forssmann on himself in 1928, was developed by Cournand, Richards, and their colleagues and is now a common procedure in both clinical and research laboratories.
Technique
The primary goal of right-sided heart catheterization is to access the conditions existing in the chambers and great vessels of the right side of the heart. In these procedures a radiopaque flexible catheter of various designs, including balloon tipped, is introduced into a vein, usually the femoral or jugular, percutaneously using local anesthesia. After introduction into the vein, the catheter is manipulated under fluoroscopic control and constant electrocardiographic monitoring downstream through the venous system to the right atrium, and eventually into the right ventricle and pulmonary artery. The catheter is often wedged and is advanced into the most peripheral branch of the pulmonary artery that will accept the catheter tip or occlusion by a balloon-tipped catheter.. A pressure recorded from the wedge position has essentially the same mean pressure as the left atrium and the same but delayed phasic features. If there is no mitral stenosis, the pulmonary capillary wedge pressure (PCWP) reflects the left ventricular end-diastolic pressure (LVEDP).
Diagnostic Procedures
The position of the catheter in the fluoroscopic image may indicate some departure from the intracardiac course normally taken by a catheter. Examples include passage into a persistent left superior vena cava through the coronary sinus from the right atrium, passage through a patent ductus arteriosus, and traversal of an interatrial or interventricular septal defect.
Blood can be sampled for oxygen or other analysis, and pressures can be measured through the catheter from any point reached. Oxygen samples can be used to determine the site of entry into the right side of the heart and the size of a left-to-right intracardiac shunt at atrial, ventricular, or pulmonary artery levels in patients with congenital heart disease. Oxygen values from the pulmonary artery are used with other data to calculate the pulmonary blood flow with thermodilution and balloon-tipped catheters. Measurement of pressures through the catheter using external pressure transducers allows determination of the phasic form of the pressure in any location. Pressures recorded as a catheter traverses a valve permit an evaluation of the site and degree of valvular stenosis.
Special sensors at the tip of a catheter have been designed for the detection and recording of intracardiac ECGs and pressures.
Complications
Brief arrhythmias, vasovagal episodes, and minor phlebitis may be observed in patients undergoing catheterization. More serious complications are rare.
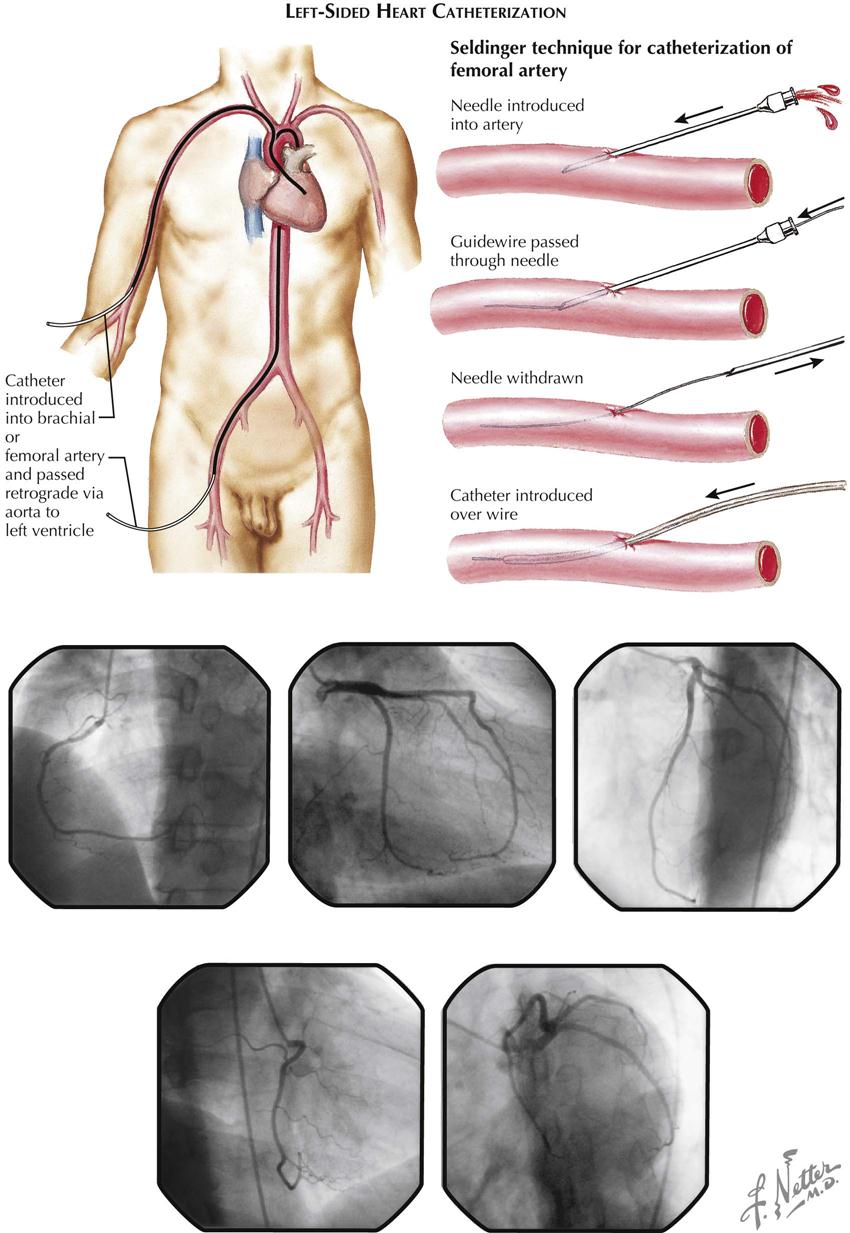
Left-Sided Heart Catheterization
Technique
The aim of left-sided heart catheterization is the study of conditions in the chambers and vessels of the left side of the heart. In congenital heart disease the catheter may reach the left side of the heart from a right-sided heart chamber, passing through an atrial septal defect or a patent ductus arteriosus.
More often the left side of the heart is approached by retrograde passage of the catheter from its point of insertion into a peripheral artery, most commonly by percutaneous technic. This technique was designed by Seldinger (see Plate 2-9). The catheter is manipulated under fluoroscopic control in a retrograde direction using the Seldinger technique through the artery to the aorta and frequently across the aortic valve into the left ventricle. Entry into the left atrium retrograde through the mitral valve is possible but not typically used. Approach to the left atrium can also be accomplished using a transseptal technique by passage of the transseptal catheter and transseptal needle from a right femoral vein to the right atrium and across the atrial septum at the level of the fossa ovalis. The catheter can then be advanced into the left ventricle. Direct percutaneous needle puncture of the LV apex may be done to reach the left ventricle in special circumstances, such as LV pressure measurement in patients with mechanical aortic and mitral valves.
Diagnostic Procedures
Sampling and pressure measurements for left-sided heart catheterization do not differ from right-sided procedures. Valvular abnormalities can be estimated using simultaneous pressure measurements on both sides of the valve.
Complications
Arrhythmias, the most common complication of left-sided catheterization, usually respond to simple catheter withdrawal, although rarely may require therapy. Other complications include arterial spasm and the rare dissection or occlusion of the artery. Perforations of the walls of an artery or the aorta, a heart chamber, or a coronary artery also can occur rarely. Fluid should never be forced through a catheter from which blood cannot be withdrawn, particularly if the catheter is in the ascending aorta; a clot can be expressed and embolize peripherally to the brain.
Cardiac Output: Thermodilution Technique
A balloon-tipped pulmonary artery catheter (Swan-Ganz catheter) with a thermistor at the tip (introduced in 1970) floats into the pulmonary artery from the right ventricle as an embolus when the balloon is inflated. The balloon occludes the distal pulmonary branches, and a pressure similar to the PCWP can be measured. When deflated, the catheter measures pulmonary artery pressure, and the thermistor measures a thermodilution curve after injection of 10 mL of cold saline or glucose into the right atrium. The cardiac output can be calculated from the measured thermodilution curve. When the cardiac output is low, the temperature change from right to distal pulmonary artery changes little. When the cardiac output is high, the temperature change is large. Thus the degree of change in temperature is directly proportional to the cardiac output.
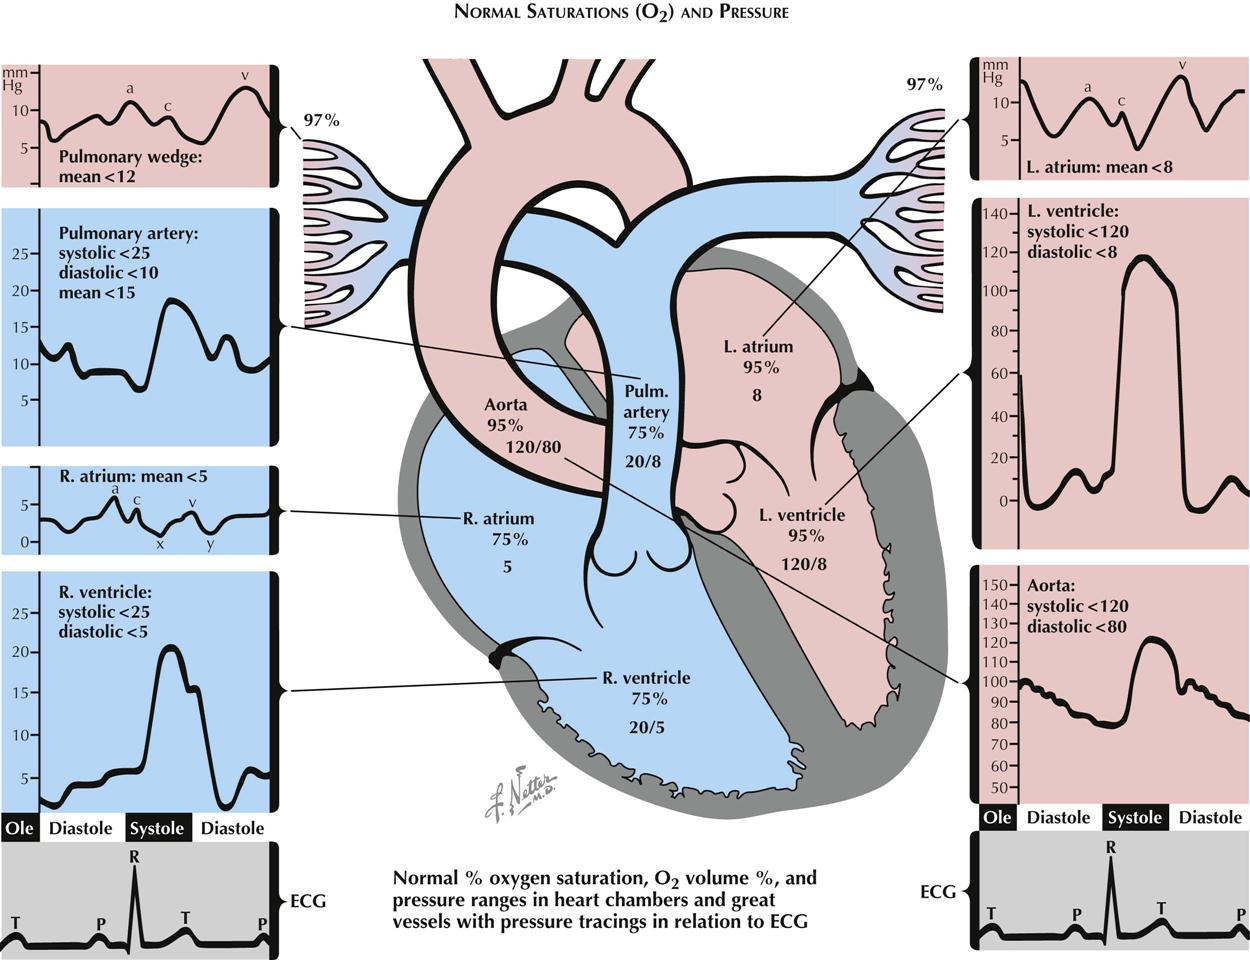
Normal Oxygen Saturations and Pressure
In the venae cavae, right atrium, right ventricle, and pulmonary arteries, oxygen saturation (SO2) is normally close to 75% (see Plate 2-10). Small, phasic variations in SO2 of blood sampled from the right-sided heart chambers can be measured. The variation is maximal in the right atrium, where contributions of blood from the renal veins (with a relatively high SO2), from the hepatic veins (with relatively low SO2), from the coronary sinus (with very low SO2), and from the lower inferior vena cava and superior vena cava (with intermediate SO2), meet and start mixing. The mixing is probably complete by the time the blood reaches the pulmonary artery. In the pulmonary wedge position, 97% to 99% saturated blood can be withdrawn through the wedged catheter, approximating the values of pulmonary venous blood. Blood leaving the pulmonary capillary bed is at least 97% saturated. Blood entering the left atrium is slightly less saturated because of its admixture with blood passing through pulmonary arteriovenous and other small shunts.
Normal Intracardiac Pressures
Atrial and Wedge Pressures
The phasic pressures in the right atrium, the left atrium, and the pulmonary artery wedge position (essentially a slightly delayed left atrial pressure) share the same characteristics, with small differences in the amplitude and timing of the phasic features. In normal sinus rhythm the pressure pulse in these chambers is characterized by an a wave produced by the atrial contraction that begins with completion of the atrial P wave in the electrocardiogram (ECG). After a brief delay, the P wave is followed by the QRS signaling the depolarization of the ventricular myocardium. Immediately after depolarization, ventricular contraction begins. The A-V valves close, and the c waves in the atrial pressure curves are produced by changes in the dimensions of the atria and by bulging of the valves into the atria secondary to ventricular contraction. After the c wave, pressure decreases to a low value (the x descent) in response to further atrial volume changes during continued ventricular contraction. During the remainder of systole, continuous venous inflow produces an increase in pressure, the v wave). The peaks of the v waves coincide with the opening of the mitral and tricuspid valves. A pressure decrease in the atria (the y descent) accompanies the transfer of blood from the atria into the ventricles.
Ventricular Pressures
Except for the peak systolic pressure in the left ventricle being approximately five times greater than that in the right, the phasic pressures in the left and right ventricles are similar in contour. The ventricles begin to contract approximately 60 milliseconds after the QRS in the ECG, with the right preceding the left. This action is associated with closure of the A-V valves, resulting in elevated ventricular pressures. During the subsequent period of sequential myocardial contraction, lasting 10 msec and 40 msec for the right and left ventricles, respectively, there are no volume changes, the period of isovolumic contraction.
When the ventricular pressures exceed the end-diastolic pressures in the pulmonary artery and aorta, the semilunar valves open and ejection begins. During the ejection period, the right ventricle and pulmonary artery and the left ventricle and aorta have the same phasic pressures until, systole being completed, the semilunar valves close and the pressures begin to drop in the ventricles. This is followed by the brief period of isovolumic relaxation.
As soon as the ventricular pressures fall below the pressures in the atria, the A-V valves open; and diastole starts and proceeds with venous filling of the common ventricular and atrial chambers, leading to superposable pressures in the atria and ventricles.
Aortic and Pulmonary Artery Pressures
During ejection the ventricular pressures and the pressures in the aorta or pulmonary artery are identical and are characterized by a smooth rise to a peak, then a steady fall to the dicrotic notch, signaling the closure of the aortic and pulmonary valves. This is followed by a steady decrease in pressure as a “runoff” of blood from the arterial system into the venous system occurs through the capillary beds. This is abruptly terminated by the next ejection.
Abnormal Oxygen and Pressure Findings
Ventricular Septal Defect
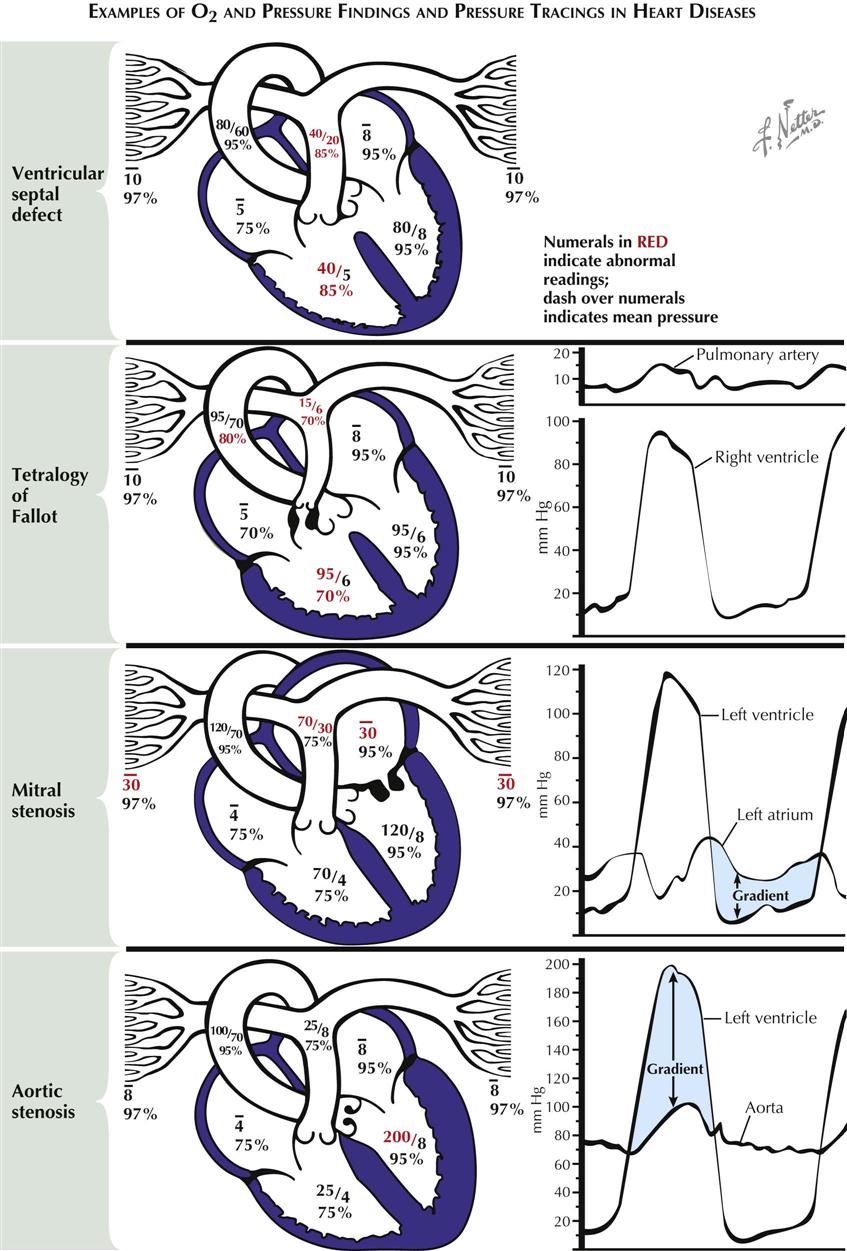
In ventricular septal defect a shunt of 95% saturated blood is ejected during systole by the left ventricle through the defect into the right ventricle, under the influence of the normally occurring pressure difference between the two ventricles (see Plate 2-11). There the shunted blood contaminates the less-saturated mixed-venous blood. Thus an increased volume of blood with a greater-than-normal SO2 (85%) flows into the pulmonary artery. In the majority of cases the volume of blood shunted depends on the systolic pressure difference between the two ventricles and on size of the defect. The increased SO2 of the blood in the pulmonary artery is in direct proportion to the volume of the shunt. The pressures in the pulmonary artery and right ventricle are usually elevated because of the increased pulmonary vascular resistance, which is secondary to the failure of neonatal involution to take place in the normal prenatal medial hypertrophy of the small arteries. The pressures may be greatly elevated by subsequent intimal and other pathologic changes. Eventually, after development of very high RV pressures, the shunt may be reversed, and desaturated blood may flow from the right to the left ventricle and the systemic arteries.
Tetralogy of Fallot
The basic abnormalities in the tetralogy of Fallot are pulmonary stenosis (valvular or infundibular) interventricular septal defect, disproportion in the diameter between and usually some displacement of the aorta and pulmonary artery, with secondary RV hypertrophy (see Plate 2-11). Because of the pulmonary stenosis, which significantly increases normal outflow resistance, RV hypertension may reach systemic levels. This results in a shunt of unsaturated blood through the defect, with a mild reduction in SO2 in the left ventricle and a greater reduction in the aorta and systemic arteries. The latter causes the cyanosis characteristic of these patients. The greatly reduced pulmonary blood flow reaches full saturation in the lungs. Systolic pressure in the right ventricle reaches the level of the aortic pressure. Distal to the pulmonary stenosis, however, the pressures are lower than normal, and the pressure contour is often distorted.
Mitral Stenosis
The resistance to diastolic flow from left atrium to left ventricle after narrowing of the mitral valve increases left atrial (LA) pressures and eventually reduces LV flow (see Plate 2-11). A pressure gradient across the mitral valve throughout diastole can be demonstrated by simultaneous PCWP measurements or direct LA and LV pressure measurements. This gradient is inversely proportional to the square of the cross-sectional area of the valve orifice and is directly proportional to the square of the volume flow. The gradient is greater with increases in the degree of stenosis and during exercise. The LA hypertension is accompanied by pulmonary venous hypertension, which results in pulmonary hypertension and RV hypertension, increased RV work, and hypertrophy. Diastolic pressures in the pulmonary artery and left atrium are identical until pulmonary vascular resistance is increased because of pathologic changes in the vascular bed, resulting in a gradient between the two pressures. Acute bouts of LA hypertension lead to pulmonary edema, whereas chronic pulmonary artery hypertension may eventually cause RV failure.
Aortic Stenosis
In aortic stenosis, obstruction to the ejection of blood from the ventricle into the aorta, caused by subvalvular, valvular, or supravalvular stenosis, results in abnormally high pressure in the left ventricle and abnormally low pressure in the aorta and thus a systolic pressure gradient across the valve. Progressive obstruction to LV outflow magnifies these effects and leads to LV hypertrophy and eventually acute or chronic LV systolic and diastolic failure (see Plate 2-11).
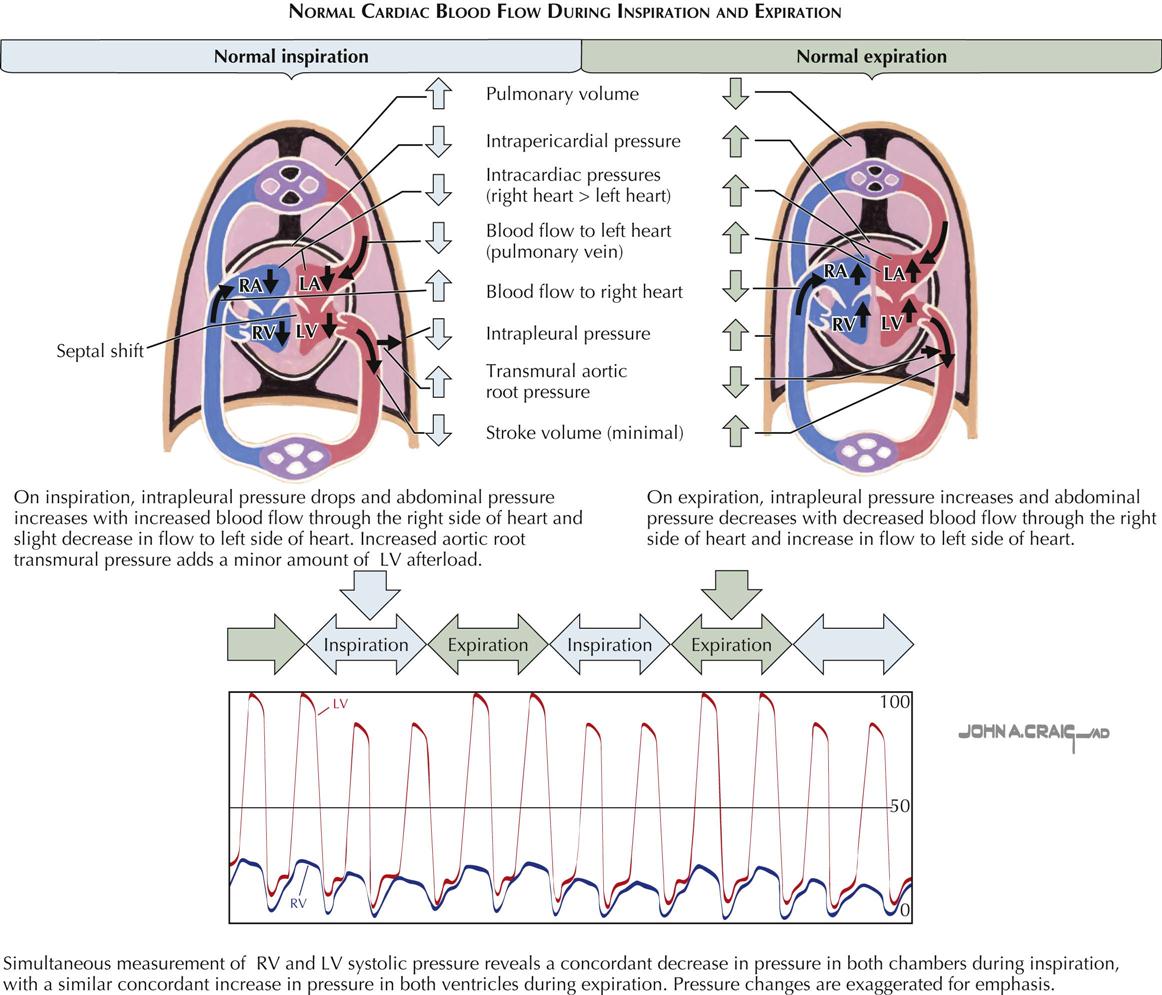
Effects of Inspiration and Expiration on Intracardiac Pressures and Flow
During inspiration, systolic blood pressure decreases and pulse rate increases slightly, because the intrathoracic pressure becomes more negative relative to atmospheric pressure. Systemic venous return increases, more blood flows into the right side of the heart, and pulmonary vasculature compliance increases (see Plate 2-12). This results in pooling of blood in the lungs and a decrease in pulmonary venous return, reducing flow to the left side of the heart. The reduced left-sided heart filling leads to a decreased stroke volume and systolic blood pressure. The decrease in systolic blood pressure leads to a faster heart rate because of the baroreceptor reflex, which stimulates sympathetic outflow to the heart. These changes are reversed with expiration.
Specialized Conduction System
Physiology of Specialized Conduction System
Under normal conditions, heart activation results from an impulse originating in a cell or cell group (the pacemaker) and from the propagation of this impulse to all fibers of the atria and ventricles. Arrival of the electrical signal at the contractile fibers of the heart initiates contraction. Regular rhythmic activity requires the presence of specialized automatic fibers. Coordinated contraction of the atria and ventricles requires a system that distributes the electrical impulse to the muscle fibers of these chambers in the proper sequence and at the proper time. Both these functions are performed by specialized groups of cardiac fibers.
The automaticity that underlies pacemaker activity is a unique property not only of the fibers in the sinoatrial node but also of other groups of specialized atrial fibers and cells of the His-Purkinje system. The conduction system is composed of the fibers of the internodal tracts, Bachmann’s bundle, the atrioventricular node, the bundle of His, the bundle branches, and the peripheral Purkinje fibers. The cells of the conduction system, in addition to having a characteristic histologic appearance, possess unique electrical properties. These properties, and the basis for electrical activity of all cardiac fibers, can best be understood by recording the transmembrane potentials through intracellular microelectrodes.
Basis for Transmembrane Potentials
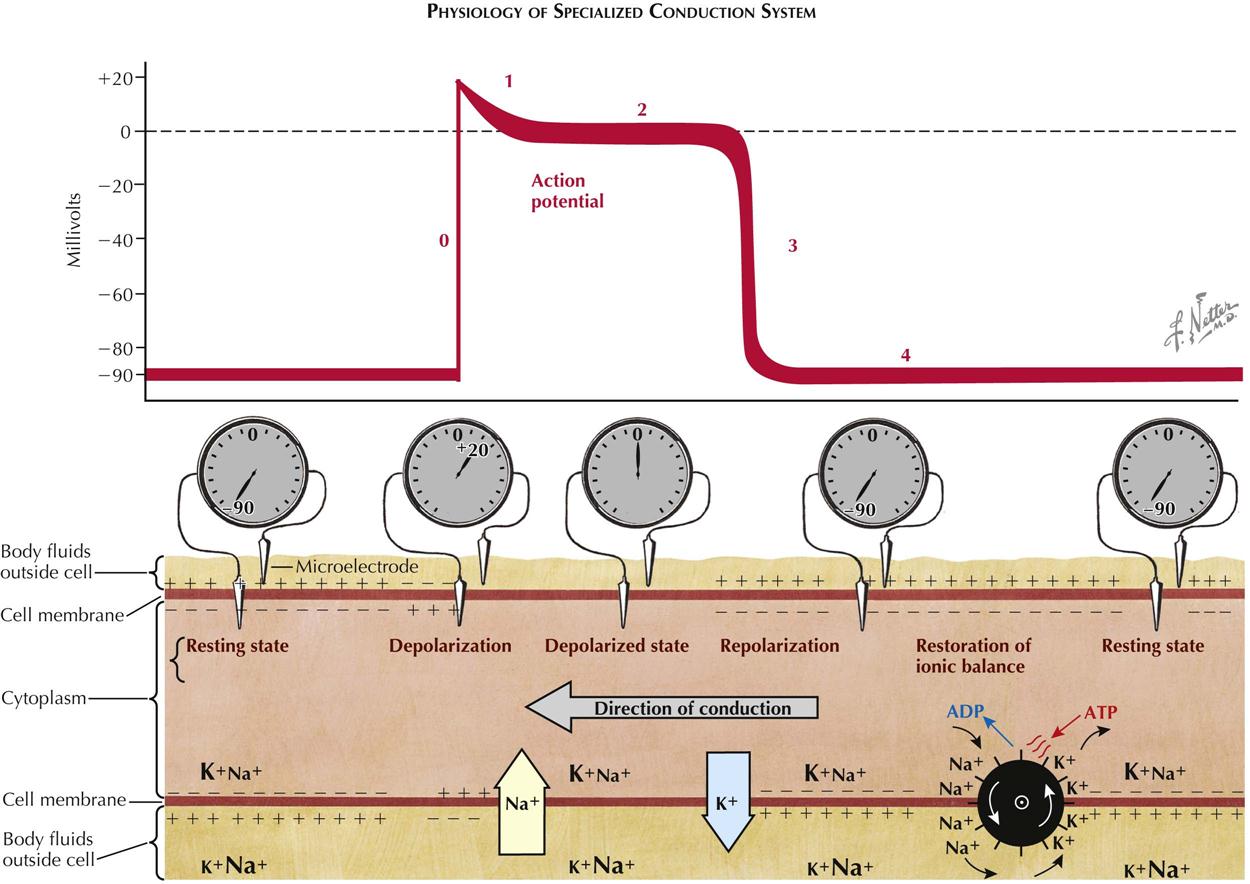
As with other excitable mammalian tissues, cardiac cells have an intracellular ionic composition that differs from that found in the extracellular fluids (see Plate 2-13). For our consideration, the most important ions are sodium (Na+) and potassium (K+). The relative magnitude of the concentration of these ions is indicated by the sizes of the symbols in the illustration. Intracellular K+ concentration is approximately 30 times greater than the extracellular concentration, whereas intracellular Na+ concentration is approximately 30 times less. Because of this difference, and because the resting membrane is more permeable to K+ than to Na+, the membrane of the resting fiber is polarized. The magnitude of this polarization, the transmembrane resting potential, can be measured by inserting a microelectrode inside the cell and measuring the potential difference across the membrane. This is shown schematically both as the recorded voltage (−90 mV) and as an oscilloscopic tracing.
With the onset of excitation, there is a change in the permeability of the membrane that permits sodium ions, carrying a positive charge, to move rapidly down their electrochemical gradient, across the membrane, and inside the fiber. This sudden influx of positive charge carried by Na+ actually reverses the transmembrane potential, and the inside becomes 20 to 30 mV more positive than the outside. The inward Na+ current is represented by the large arrow in Plate 2-13; the resulting change in transmembrane potential is shown as the upstroke (phase 0) of the oscilloscopic tracing. After excitation there is a period of variable duration (phases 1 and 2) when the membrane potential remains close to zero. This period, often described as the plateau of the transmembrane action potential, results from a decrease in Na+ and K+ permeability. Subsequently, repolarization, or restoration of the normal resting potential, takes place because of an increase in K+ permeability and an efflux of K+ from the cells. The phase of rapid repolarization (phase 3) is followed by a period of stable resting potential (phase 4) until the arrival of the next wave of excitation. To maintain the normal concentration gradients for the sodium and potassium ions, an active transport system, often referred to as a “pump,” must extrude the sodium that has entered and pump in an equivalent amount of potassium. The pump is represented by the wheel with gates.
Plate 2-13 is a representation of a longitudinal section of a single fiber during propagation of the impulse. The activity, conduction, is spreading from right to left. At the extreme left of the tracing, the resting potential has not yet been changed by the coming wave of excitation. At the right, repolarization is complete, and the resting potential has been restored. In the middle of the figure, the current flow associated with excitation is shown under the upstroke (phase 0) of the action potential; the currents associated with repolarization appear under phase 3. The relative magnitude and polarity of the transmembrane potential are suggested by the plus and minus signs inside and outside the membrane. Propagation, or the spread of the impulse, occurs because a change in transmembrane potential at one point, during phase 0, causes a local longitudinal potential difference. This produces a flow of current across the membrane in advance of the action potential upstroke, resulting in excitation of the next adjacent segment of the fiber. During propagation these processes are continuous, and thus activity spreads from its point of origin throughout all excitable fibers.
Electrical Activity of the Heart
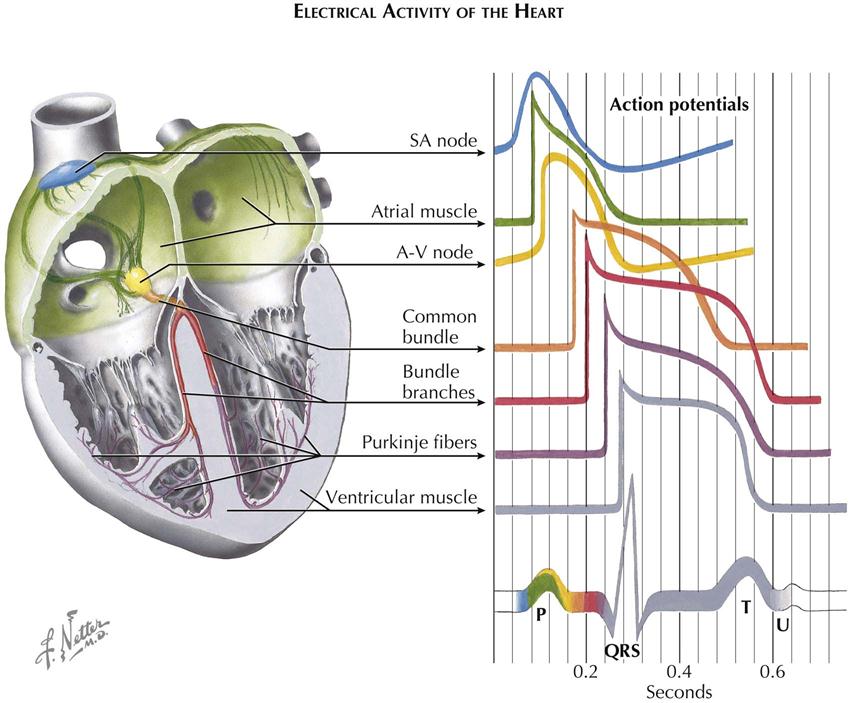
The previous description applies in general to all cardiac fibers. However, records of transmembrane action potentials recorded from cells in different parts of the heart show special characteristics in the initiation and spread of the normal cardiac impulse (see Plate 2-14).
Sinoatrial Node and Atrium
This trace is recorded from a single automatic fiber in the sinoatrial (SA) node. There is no steady resting potential; instead, after repolarization the transmembrane potential decreases spontaneously. This slow, spontaneous depolarization during phase 4 causes the automatic activity of sinus fibers. A similar cause of automaticity has been recorded from all the specialized cardiac fibers capable of normal pacemaker activity. Further, the rate of rise of the upstroke of the action potential is slow, causing slow conduction of the impulse within the node. The action potential recorded from an ordinary atrial muscle fiber is shown below that from the SA node. Here the upstroke is rapid and the resting potential steady.
Atrioventricular Node
Action potentials recorded from fibers of the A-V node resemble those shown for sinus fibers. The extremely slow spread of the impulse through the A-V node results largely from the slow rate of rise of the action potential. The phase 4 depolarization shown probably causes automatic activity only in fibers of the lower node in proximity to the common bundle.
His-Purkinje System
The action potentials recorded from the fibers of this part of the specialized conduction system (Purkinje fibers) have the following important characteristics:
1. The rate of rise of the action potential is fast, and thus conduction is rapid.
2. The duration of the action potential is great, and thus the refractory period is long.
The bottom trace in Plate 2-14, recorded from an ordinary muscle fiber of the ventricle, is included to contrast the time of excitation and action-potential duration with the other records.
Sequence of Excitation and the Electrocardiogram
The seven tracings of transmembrane action potentials indicate the normal sequence of heart activation in relation to the schematic electrocardiogram (ECG) shown below them. The coloring of the ECG trace suggests the temporal relationship of each type of action potential to the normal ECG, as well as the contribution of electrical activity in each type of cell to the ECG recorded from the body surface.
Activity of pacemaker fibers in the SA node precedes the first indication of activity in the ECG (the P wave) and cannot be demonstrated in the body-surface leads. Depolarization of atrial muscle fibers, in a sequence largely determined by the specialized atrial paths shown, causes the P wave. Repolarization of atrial fibers ordinarily is not seen in the surface ECG. Activity reaches the upper part of the A-V node early during the P wave. Propagation through the node is slow, and excitation of fibers in the His bundle does not occur until the middle of the P-R interval. The spread of activity through the common bundle, the bundle branches, and parts of the Purkinje system precedes the earliest excitation of ventricular muscle. There is no indication in the surface ECG of excitation of the fibers of the His-Purkinje system. The QRS complex results from activation of the muscle fibers of the ventricles. The isoelectric S-T segment corresponds to the plateau of the ventricular action potential, and the T wave results from repolarization of ventricular fibers. The U wave corresponds in time with repolarization of the specialized fibers of the bundle branches and Purkinje system and may reflect this event as recorded at the body surface.
Although the normal sequence of heart activation results from the anatomic distribution and unique electrical properties of specialized cardiac cells, no signal recorded in the ECG corresponds to these events. Thus the sequence of excitation of the specialized tissues can be determined only by implication when noting the temporal characteristics of the P wave and QRS complexes and their interrelationships. Further, since excitation and the resulting depolarization cause contraction of the myocardial fibers, the coordinated mechanical activity of the heart depends on the specialized cardiac fibers.
Electrocardiogram
An electrocardiogram is a graphic representation of voltage variations plotted against time. The variations result from the depolarization and repolarization of the cardiac muscle, which produces electric fields that reach the surface of the body where electrodes are located. An electrocardiographic machine is a galvanometer that records voltage variations, usually on paper tape. The first such machine was developed by Wilhelm Einthoven in 1906. It consisted of a silver-plated quartz string situated in a fixed magnetic field. Voltage variations from the body passed through the string, and the interaction of the electric fields between the magnet and the string resulted in the string’s movement, which was photographed. The modern ECG machine is similar to these early models, but microelectronics and computer interfaces have been incorporated, making them more useful and powerful. Although more convenient to use, these newer machines are no more accurate than the original ECG built by Einthoven.
Since the development of a practical method of recording the ECG, much has been learned about the electrophysiology of the heart. In the major contribution, Nobel Prize winner Einthoven described the vector concept and stated that the action current of the heart, often called the “accession” or “regression” wave, can be represented by a vector that has magnitude, direction, and sense. The magnitude of the voltage of the accession wave is the length of the arrow shaft, the direction is determined with respect to a line of reference, and the sense is indicated by the presence of an arrowhead on the shaft. In its simplest concept, the vector represents the magnitude of a single dipole (i.e., a paired electric charge, minus and plus). Likewise, the electrical effect of a group of dipoles can be represented by a vector.
Normal Electrocardiogram
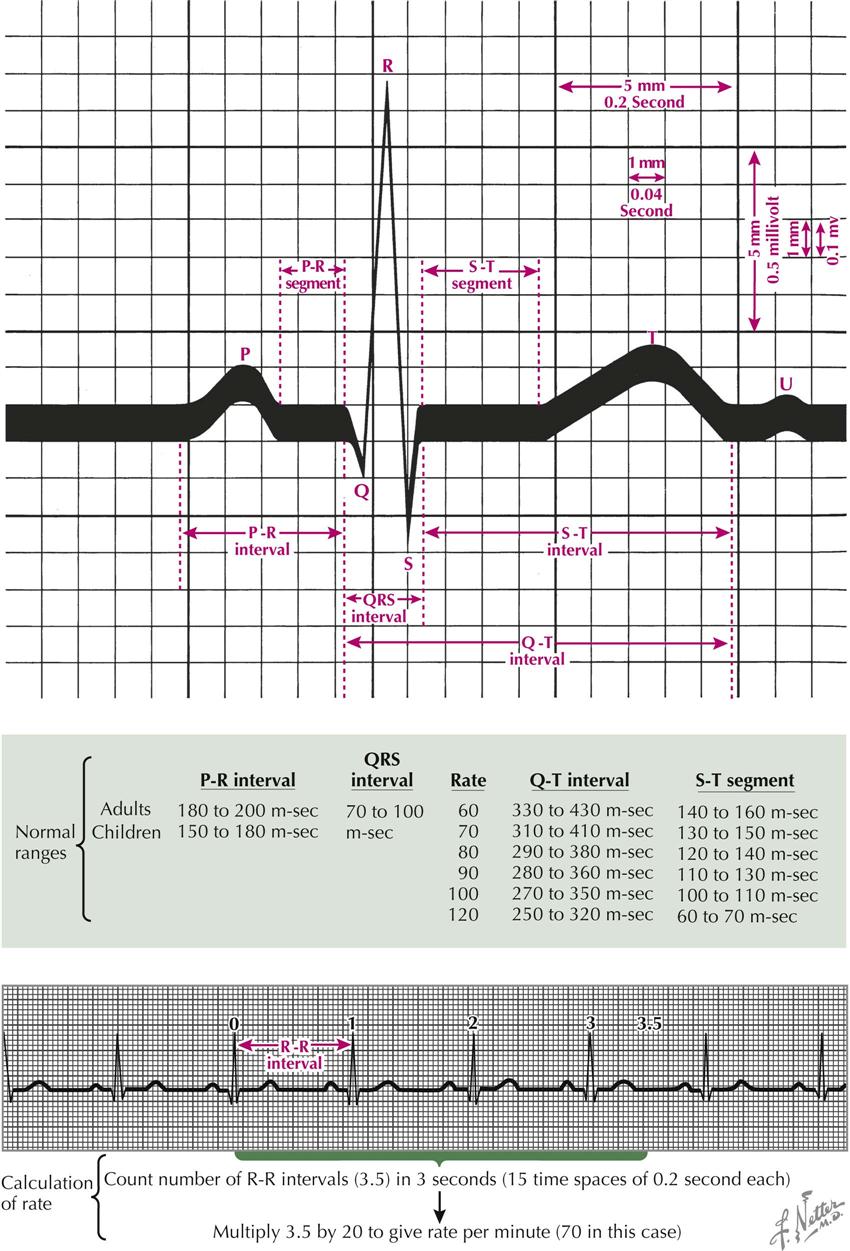
The electrocardiogram is a record of voltage variations plotted against time. The paper on which the ECG is recorded is ruled in 1-mm-spaced lines, horizontally and vertically. When the tracing is properly standardized (1-mV change produces 10-mm stylus deflection), each vertical space represents a voltage change of 0.1 mV, and each horizontal space an interval of 40 milliseconds (“m-sec” in Plate 2-15). Each fifth line, horizontal and vertical, is heavy. The time between the heavy lines is 0.2 second. The voltage change between two heavy lines is 0.5 millivolt (mV).
A P wave is the result of atrial depolarization and should not exceed 2.5 mm (0.25 mV) in height in lead II or longer than 0.12 second. The P-R interval, which includes the P wave plus the P-R segment, is a measure of the interval from the beginning of atrial depolarization to the beginning of ventricular depolarization. This interval should not be greater than 0.2 second for rates greater than 60 beats per minute. The Q wave is the first downward deflection of the QRS complex and represents septal depolarization. The R wave is the first positive, or upward, deflection of the QRS complex, normally caused by apical LV depolarization. The S wave is the first negative deflection after the R wave, caused by depolarization of the posterior basal region of the left ventricle. The voltage of the R wave in the precordial leads should not exceed 27 mm. The Q-T interval is measured from the beginning of the QRS complex to the end of the T wave, including the QRS complex, S-T segment, and T wave intervals, the latter two constituting the ST interval. The Q-T interval varies with the cardiac rate and should not be greater than 0.43 second for rates greater than 60 beats/min. The total QRS interval should not exceed 0.1 second.
The cardiac rate may be determined by counting the number of R-R intervals within 16 heavy vertical time lines (15 time spaces) and multiplying by 20. The first interval counted is coincident with the zero time line (see Plate 2-15).
Electrocardiographic Leads and Reference Lines
The conventional electrical connections used for recording the ECG are the limb leads, augmented limb leads, and precordial leads.
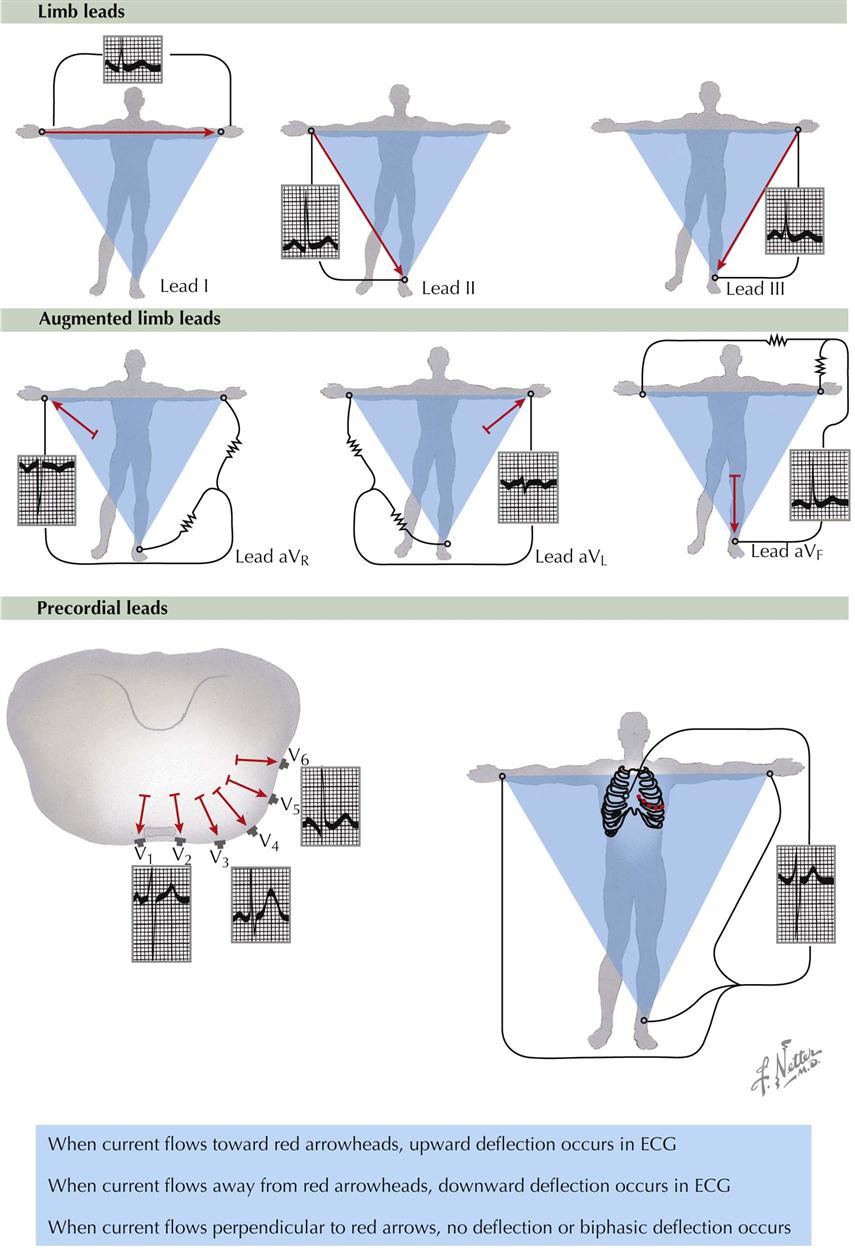
Limb Leads
The bipolar limb leads detect electrical variations at two points and display the difference. Lead I is the connection between the electrodes on the left arm and right arm; the galvanometer is between these points of contact (see Plate 2-16). When the left arm is in a positive field of force with respect to the right arm, an upward (positive) deflection is written in lead I. Lead II is the connection between the left leg and right arm electrodes. When the left leg is in a positive field of force with respect to the right arm, an upward deflection is written in lead II. Lead III is the connection between the left leg and left arm. When the left leg is in a positive field of force with respect to the left arm, a positive deflection is written in lead III.
Augmented Limb Leads
The unipolar augmented limbs leads register the electrical variations in potential at one point (right arm, left arm, or left leg) with respect to a point that does not vary significantly in electrical activity during cardiac contraction (see Plate 2-16). The lead is augmented by virtue of the type of electrical connection, which results in a trace of increased amplitude, versus the older Wilson unipolar lead connections. Lead aVR inscribes the electrical potentials of the right arm with respect to a null point, which is made by uniting the wires from the left arm and left leg. Lead aVL records the potentials at the left arm in relation to a connection made by the union of wires from the right arm and left foot. Lead aVF reveals the potentials at the left foot in reference to a junction made by the union of wires from the left and right arms.
Precordial Leads
The unipolar precordial leads are recorded in chest positions 1 through 6 (see Plate 2-16). The V designation indicates that the movable electrode registers the electric potential under the electrode with respect to a V, or central terminal, connection, which is made by connecting wires from the right arm, left arm, and left leg. The electric potential of the central terminal connection does not vary significantly throughout the cardiac cycle; therefore the recordings made with the V connection show the electrical variations occurring under the movable precordial electrode. Position V1 is at the fourth intercostal space to the right of the sternum; V2 is at the fourth intercostal space to the left of the sternum; V4 is at the left midclavicular line in the fifth intercostal space; V3 is halfway between V2 and V4; V5 is at the fifth intercostal space in the anterior axillary line; and V6 is at the fifth intercostal space in the left midaxillary line.
At times, other precordial lead placements are helpful, including those elevated 2 inches (5 cm) above the usual positions (EV1, EV2, etc.), which may help to detect MIs. Precordial leads are also placed 2 inches below the usual positions (LV1, LV2, etc.) when the heart is unusually low in the thorax, as in patients with pulmonary emphysema. Leads to the right of V1 (V3R, V4R, etc.) are used to differentiate right bundle branch block and right ventricular hypertrophy from the normal condition. Leads farther to the left (V7, V8, etc.) are used to explore the left ventricle when it is directed posteriorly.
Reference Lines
For the various leads, the reference lines of Einthoven are shown in Plate 2-16 as red arrows. For example, the line of reference for lead I connects the left and right arm electrodes. An accession wave (vector) directed toward the arrowhead of any of the red arrows results in an upward (positive) deflection in the ECG. If the electrical activity, or accession wave, is directed toward the tail of the reference arrow, a downward (negative) deflection is written, but if this wave is perpendicular to the line (90 degrees), no deflection (or a small biphasic one) will be written. The height of the ECG wave is proportional to the magnitude of the projection of the accession wave vector on a reference line.
Cardiac Depolarization and Repolarization and Mean Instantaneous Vectors
Progression of Depolarization
Atrial Depolarization and Mean Vectors
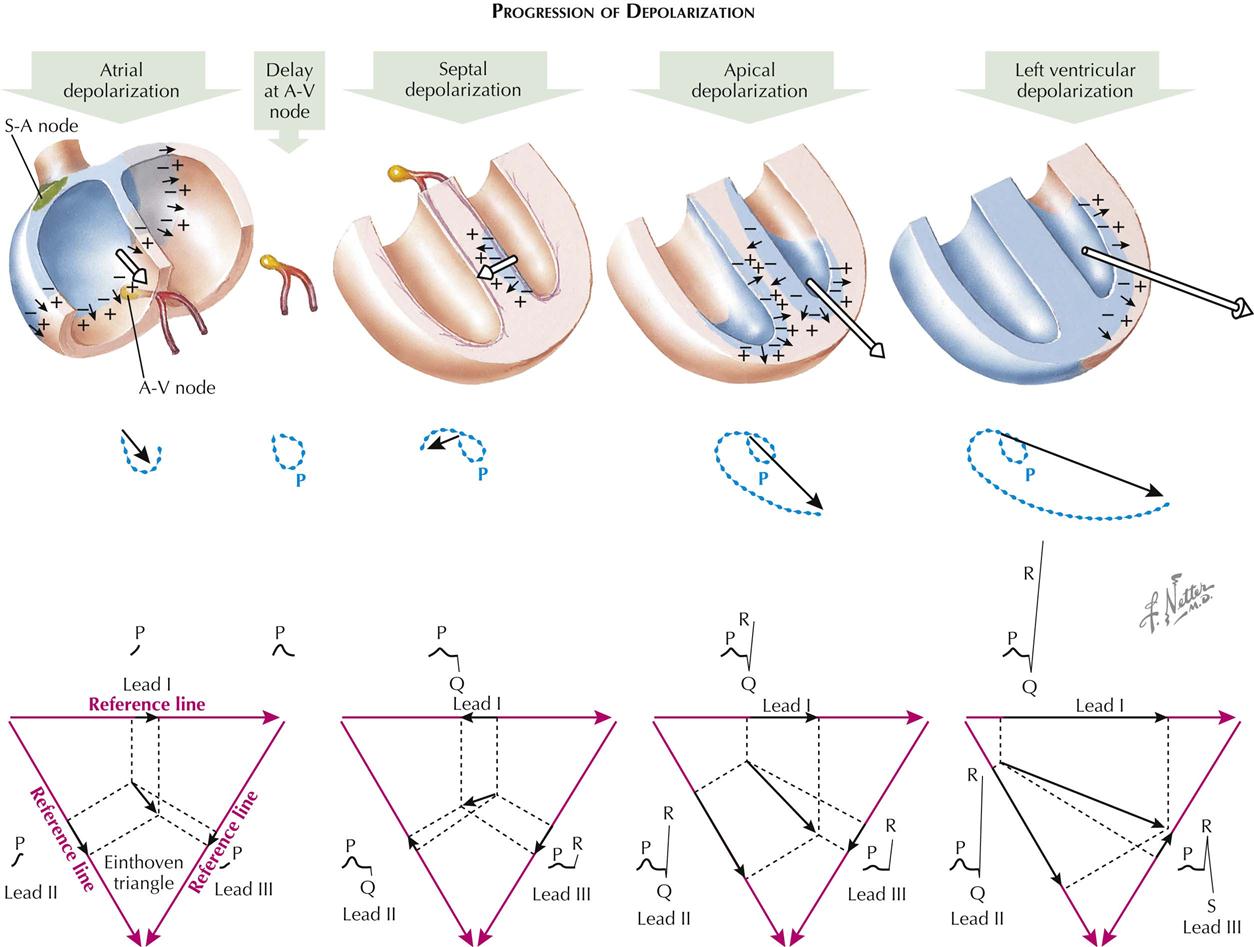
The cardiac impulse originates in the sinus node and starts the process of atrial depolarization by lowering the resistance of the cell membrane, allowing neutralization or reversal of certain dipoles. This leaves an electric-wave front, an accession wave, which is preceded by positive forces and followed by negative ones. Normally, this wave is initiated at the sinoauricular (S-A) node (see Plate 2-17). Early during atrial depolarization, however, the wave spreads toward the foot and A-V node. Toward the end of atrial depolarization, the accession wave is directed toward the left atrium and left arm. The early atrial depolarization wave may be represented as a vector, the length of which indicates the magnitude (strength) of the voltage generated by the accession wave. The late atrial depolarization voltage is represented by a second vector, the length of which is a measure of the voltage generated at this time. If the heads of these vectors are connected with their points of origin, a loop is formed; this is the P loop of the vectorcardiogram (VCG). The P loop is seen in the frontal plane.
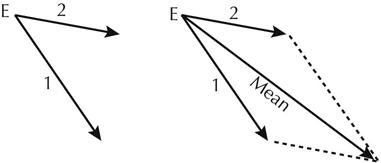
A mean P vector can be determined from the instantaneous vectors 1 and 2 by using the parallelogram law. To derive the mean vector from two instantaneous vectors, a parallelogram is drawn. The instantaneous vectors are drawn as originating from a common point of origin E. The parallelogram is completed by drawing a line from each arrowhead, parallel to the opposite vector. The mean vector is an arrow connecting E with the opposite angle of the parallelogram. The mean vector indicates the average direction taken by the atrial accession wave, and its magnitude as the wave travels over the atria.
One can analyze the mean atrial-depolarization vector against the Einthoven triangle reference frame to predict the type of P waves that will appear in leads I, II, and III. Projecting the mean vector against the reference line of lead I creates a projected vector, the length of which is proportional to the amplitude of the P wave in that lead. The direction of the wave (up or down) is determined by the direction of the projected atrial vector with respect to the polarity of the reference line. The direction of the P wave will be upward (positive) when the projected vector points in the same direction as the reference arrow for that lead and downward (negative) when the opposite relationship exists.
Just before atrial depolarization is complete, depolarization of the A-V node begins. However, the nodal depolarization process is of such low magnitude that the ECG instrument is unable to detect these changes, and it is not until the interventricular septum is invaded that a QRS complex begins. Normally, there is a time interval from the end of the P wave to the beginning of the QRS complex (P-R segment), which is usually opposite in direction to the P wave and is a result of atrial repolarization.
Septal Depolarization
The first important electric-movement in septal depolarization normally begins at the left side of the septum, moves to the right, and results from the entry of bundle of His branches into the septum at a higher level on the left than the right. The septal left-to-right movement is important because it writes the normal septal Q wave in leads I, aVL, and V6. If the first electric movement is analyzed (using Einthoven reference frame), it is evident that a Q wave will initiate the QRS complex in leads I and II and an R wave in lead III.
Apical Depolarization
The second electric movement of significance is apical depolarization, which follows the early depolarization of the right ventricle. Projection of the second instantaneous vector onto the Einthoven triangle indicates that leads I, II, and III will develop R waves at this time.
Left Ventricular Depolarization
Depolarization of the right ventricle occurs quickly and is completed early because of the thinness of this structure compared to that of the left ventricle. The third significant electric movement is toward the lateral wall of the left ventricle. At this time the amplitude of the R waves is increased in leads I and II, and S waves appear in lead III. The forces at this time are strong because there are no counterforces from the right ventricle and the LV muscle mass is thick.
End of Depolarization Followed by Repolarization
Late Left Ventricular Depolarization
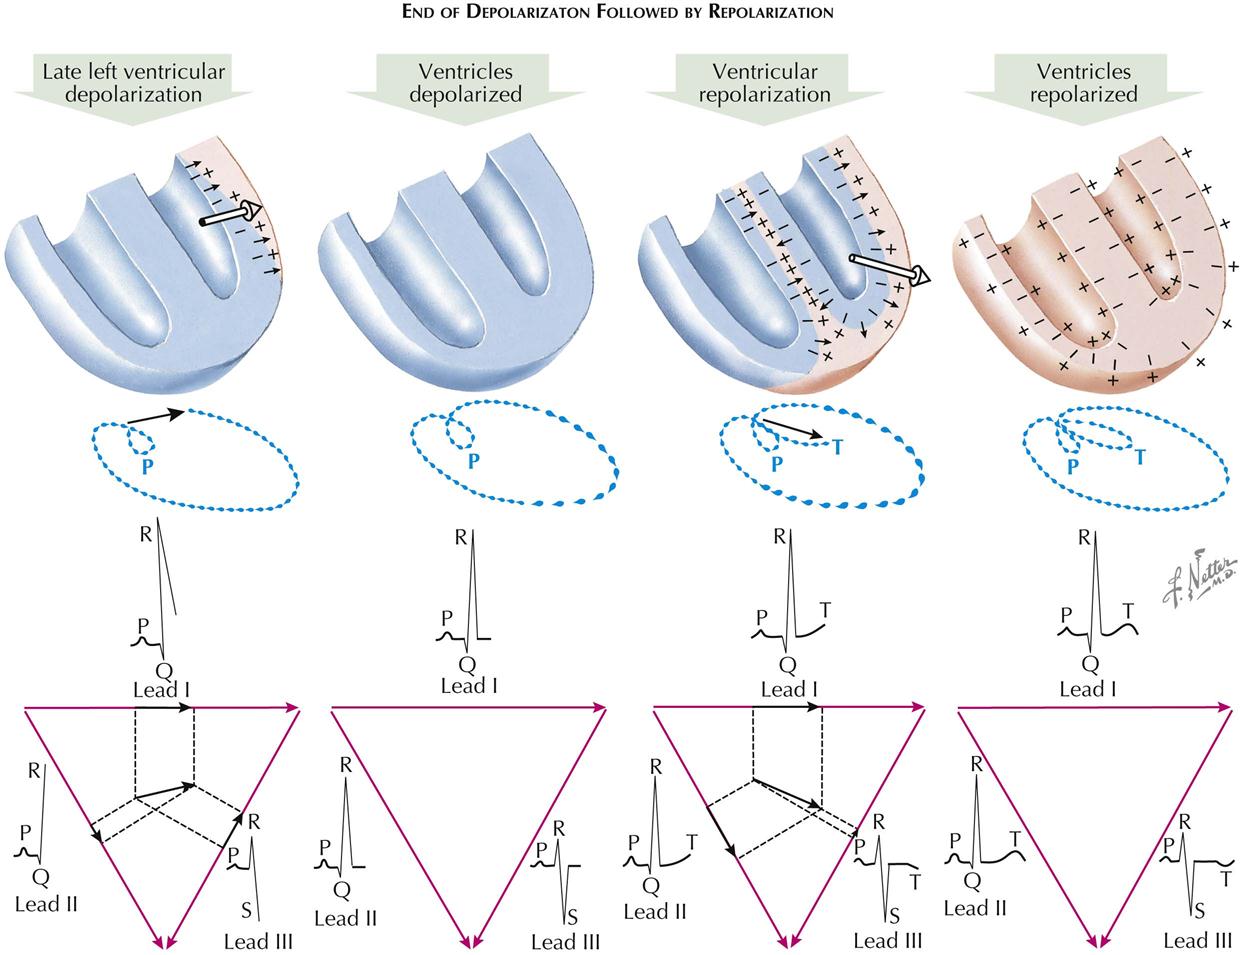
The fourth or late instantaneous vector (electric movement) exists toward the base of the left ventricle and occurs just before the end of the ventricular depolarization process. This force results in a deepening of the S waves in lead III and an accentuation of the amplitude of the R waves in leads I and II.
Ventricles Depolarized
When the dipoles are removed or reversed, with no potential differences on the body as a result of electric changes affecting the heart, the heart is in the depolarized state. The myocardium is in a refractory condition during this period, and a myocardial stimulus will fail to elicit a contraction. Since there are no voltage differences, the ECG trace returns to the baseline in all leads; it is during this time that the S-T segment is written.
Ventricular Repolarization
Repolarization of the ventricles is a complex process in which a vector appears opposite the wave of depolarization. As a result, development of positive (upward) T waves is shown in the standard leads I and II. The normal direction of T waves in lead III is variable.
Ventricles Repolarized
Finally, each cell of the myocardium becomes repolarized, with a preponderance of negative charges inside the cell and positive charges outside. The heart is now ready for its next stimulation and contraction. The heart muscle is thus in a receptive state, and a stimulus will elicit a contraction. Now the trace is isoelectric because there are no net potential differences on the body surface.
Axis Deviation in Normal Electrocardiogram
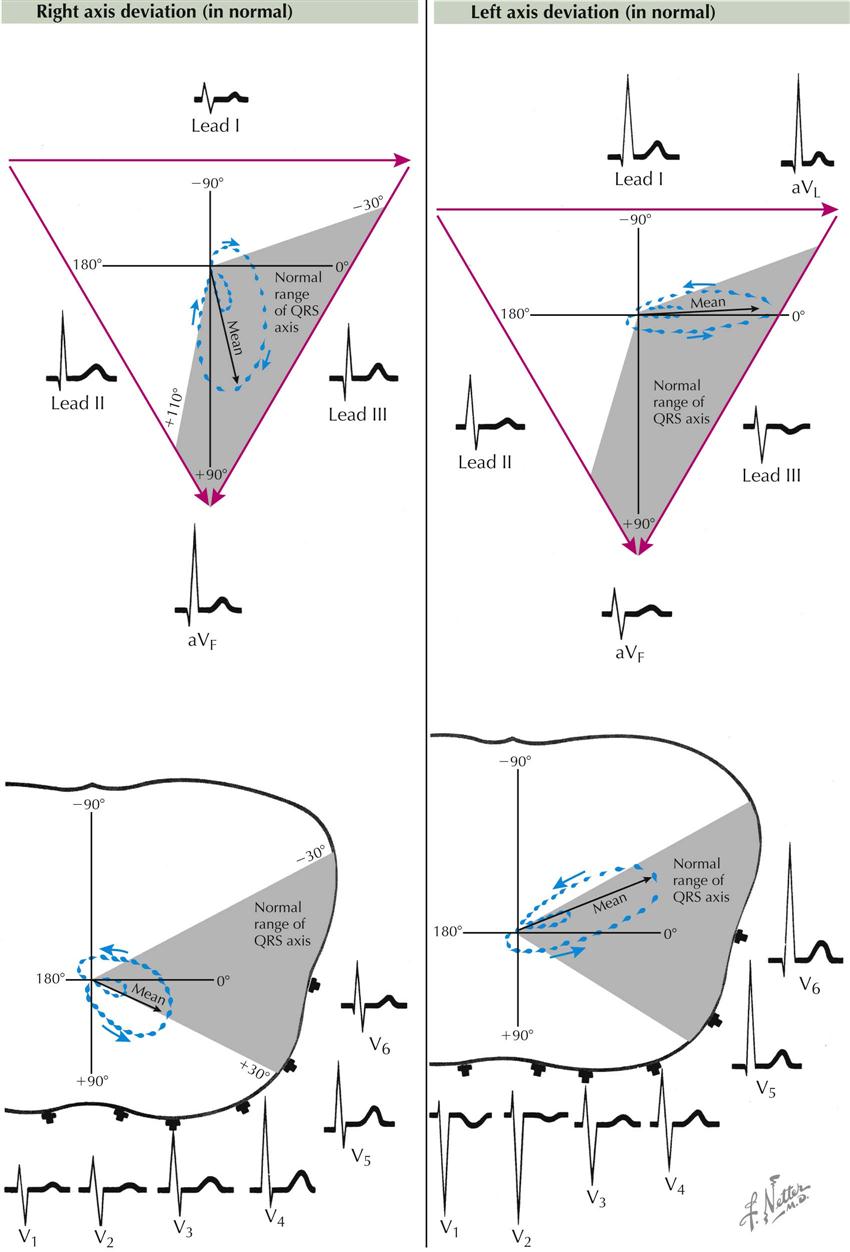
In the normal individual the mean electric axis of the P wave, QRS complex, and T wave often reflects the anatomic position of the heart in the chest; an abnormal axis can result from heart disease. Plate 2-19 illustrates normal variations in the vectorcardiographic loop. The QRS and T loops in the frontal plane vary between −30 and +110 degrees and in the horizontal plane between +30 and −30 degrees, measured from the left arm.
In right axis deviation in the frontal plane, the P and QRS loops are directed toward the right, often to +90 degrees. Electrocardiographically, there are tall R waves in leads II, III, aVF, V2, and V3.
Left axis deviation is characterized by a QRS loop that points toward the left shoulder blade (left, up, and back). The mean electric axis is often close to −30 degrees in the frontal plane and approaches −30 degrees in the horizontal plane (toward the back). The S waves are deep in leads V1 and V2, and the R waxes are tall in leads I, aVL, V5, and V6.
It is important to understand the relationship between the position of the heart in the chest and the electrocardiogram because the heart’s position has a profound influence on the tracing. The concept is complex; the heart can rotate around an anteroposterior axis, a transverse axis, and an anatomic axis that runs from the base to the apex of the heart. Actually, the heart can rotate from front to back, side to side, and around the anatomic axis, all simultaneously. The rotation around the anatomic axis is the most difficult to visualize. Rotation here consists of turning around an axis that runs from the valvular base of the heart through the septum, finally emerging from the apex. An observer at the left of a patient would see the emerging axis at the apex of the heart. Then visualizing a clock at the base of the heart, the observer could also visualize any rotational change around the axis and could designate the direction of rotation as clockwise or counterclockwise.
In a patient with an intermediately placed heart, the right ventricle is in front, to the right, and superior to the left ventricle. The left ventricle is in back, below, and to the left of the right ventricle. Now, if an electrode were placed directly on the right ventricle, a “right ventricular complex” (small R, large S, inverted T) would be recorded. If an electrode were placed directly on the left ventricle, a “left ventricular complex” (small Q, large R, upward T) would be recorded. An electrode on the body or on a limb, facing one ventricle or the other, will record in the lead the type of complex that is typical of that ventricle. In the intermediate heart position, neither the right nor the left ventricle directly faces the aVL or aVF electrode; thus these leads have small complexes that do not look exactly as do the right or left ventricular complexes. With inspiration and the descent of the diaphragm, or in a patient with an asthenic body build, the heart rotates clockwise, causing the left ventricle to face the foot and the right ventricle to face the left arm. Thus, typical complexes of a left ventricular type will be recorded from lead aVF, whereas aVL will record complexes of a right ventricular type. In an obese or pregnant subject, or during expiration with a high diaphragm, the heart rotates counterclockwise, and LV (predominantly positive) complexes are recorded in lead aVL and RV (predominantly negative) complexes in lead aVF (see Plate 2-19).
Atrial Enlargement
Enlargement of the right atrium, as compared to the left, occurs in patients with cor pulmonale, pulmonary hypertension, and tricuspid or pulmonary stenosis. As a result, the first atrial electric movement predominates, and the electric axis of the P wave generally is toward the foot and to the front. As a consequence, the P waves are small in lead I but are tall in leads II, III, and aVF, often exceeding the upper limit of normal (2.5 mm) for lead II. The vector loop is down, forward, and large. Moderately tall P waves are present in leads V1 and V2.
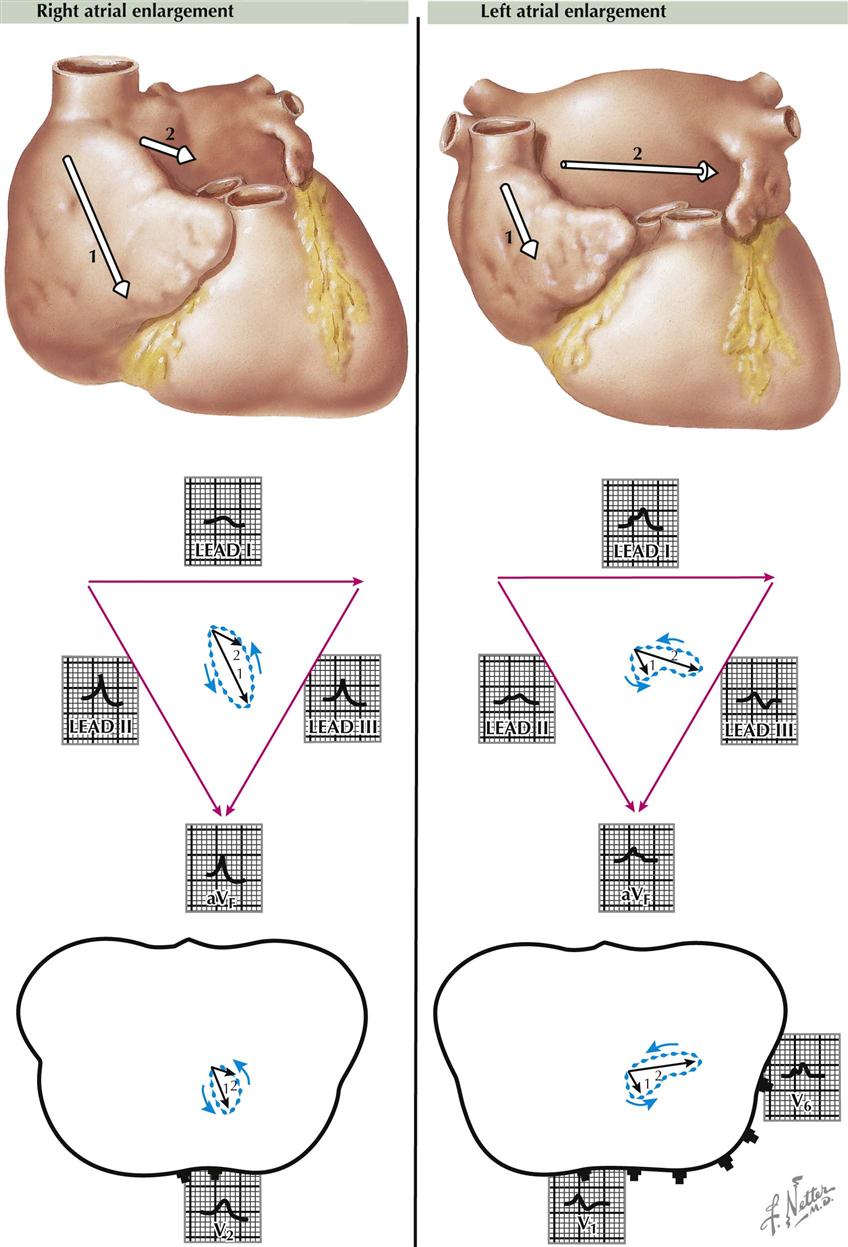
Right Atrial Enlargement
Right atrial enlargement is found when there is a pressure or flow overload in the right atrium, as compared to the left (see Plate 2-20). The pressure is increased characteristically in the right atrium in patients with tricuspid stenosis, and the “P pulmonale” picture of right atrial enlargement occurs. Here, the P waves are tall, peaked, narrow, and unnotched (easily seen in leads II, III, and aVF), with a tendency toward right axis deviation.
Left Atrial Enlargement
In contrast to the right atrium, left atrial enlargement causes the ECG picture of “P mitrale.” This usually is caused by mitral stenosis or regurgitation incident to rheumatic heart disease. The P waves are notched and wide in lead II, with a tendency to left axis deviation, but typically are normal in height. There is enlargement of the left atrium, as compared with the right; therefore the electric forces are directed toward the left axilla. Characteristically, the P waves in lead II are wide (≥0.12 second). The loop of the P wave is unusually large and shows a left axis deviation. Wide, notched P waves also are seen in lead V6. With left atrial enlargement, the late P vectors are large compared to the early vectors (see Plate 2-20).
Enlargement of Both Atria
When both right and left atria are enlarged, the P waves are tall—more than 2.5 mm in lead II—and wide (≥0.12 second). Notching is present. This condition occurs when mitral valve disease prevails in the presence of an interatrial septal defect or when multiple valvular defects are present. The atrial T waves or the repolarization waves of the atria are normally small, often being undetectable or lost in the QRS complexes. Normally, the T wave is discordant with the P wave, in that a positive P wave is usually followed by a very small, negative T wave. Generally, the area under the atrial T wave is slightly smaller than the area under the P wave.
With enlargement of the P waves, in either “P mitrale” or “P pulmonale,” the atrial T waves enlarge in proportion to the increased size of the P waves, with resultant depression of the P-R segments. Large atrial T waves often call attention to atrial abnormalities and are helpful diagnostically.
Ventricular Hypertrophy
Various terms have been used to describe the ECG picture of ventricular hypertrophy, including ventricular preponderance, strain, systolic or diastolic overload, and enlargement. Some of these describe a functional state of overwork of one ventricle versus the other, or refer to an anatomic condition with increased muscle of one ventricle compared to the other. Ventricular preponderance is an all-inclusive term that broadly includes most conditions, and enlargement covers both hypertrophy and dilatation.
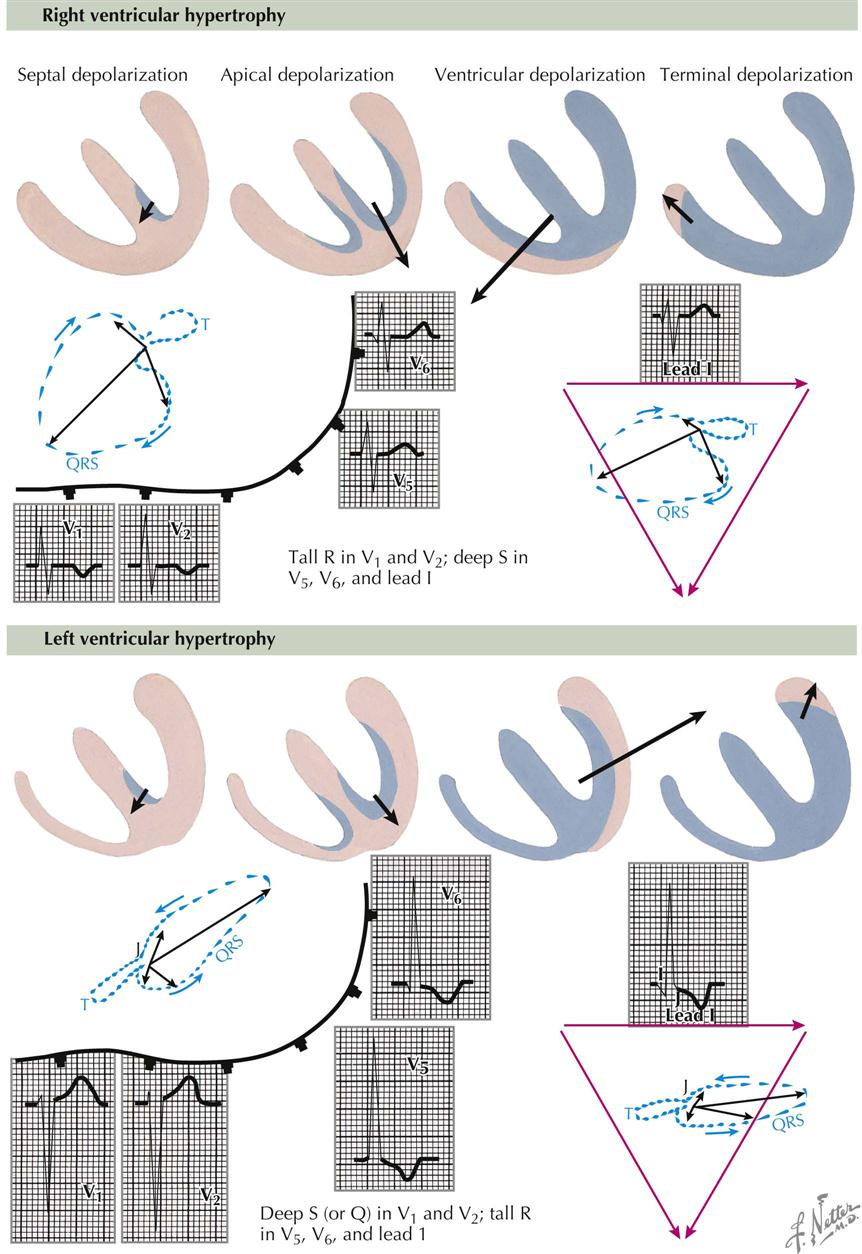
Right Ventricular Hypertrophy
The QRS forces are directed to the right because of the thick right ventricle, which distorts the horizontal loop to the right and forward, and is associated with tall R waves relative to normal in leads V1 and V2 and deep S waves in leads V4 and V5 (see Plate 2-21). The R/S amplitude ratio in lead V1 is abnormal, indicating a tall R wave with respect to the depth of the S wave. Normally, this ratio should be less than 1. Characteristically, the S-T segments and T waves are opposite in direction to that portion of the QRS complex of greatest area (usually the R wave), and also the T loop is opposite to the QRS loop. Thus the R wave is up and the T wave down in leads V1 and V2, but in leads V5 and V6 the S wave is always down and the T wave up.
Right ventricular hypertrophy may be caused by congenital or acquired heart disease, and the hypertrophy may result from a pressure or volume overload. As a result, the RV muscle thickens with respect to the LV, and a RV preponderance develops. The net electric change of the whole heart writes the ECG and VCG, and thus the QRS electric forces are directed in general from the left to the right of the heart and of the body. Usually the direction of the electric forces will be from the smaller muscle mass toward the larger mass, that is, from the normal toward the hypertrophied ventricle.
Left Ventricular Enlargement
The large muscle mass of the left hypertrophied ventricle, compared to the right, distorts the QRS loop toward the left scapula. This results in small R waves and deep S waves in leads V1 and V2, with high R waves and small or no S waves in leads V5, and V6 (see Plate 2-21). Again, the S-T segments and T waves are opposite in direction to the major deflection of the QRS complex, which means that in lead V1 the deep S wave is associated with a positive S-T segment and T wave, whereas in lead V6 the tall R wave is associated with a negative S-T segment and T wave. In the horizontal loop the early forces in the patient are from left to right and to the front, later toward the left scapula, and finally returning to the zero point. When the shifts of the S-T segments are characteristic of LV enlargement, there is an open QRS-T loop in the VCG (i.e., beginning and end of a QRS complex are at different levels), and usually a T wave follows that is 180 degrees discordant with the major portion of the QRS loop. The frontal loop is displaced toward the left shoulder, with discordant QRS and T-wave relationships. An open loop may be seen here as well.
The J point is the junction between the end of the QRS complex and the beginning of the T wave in the ECG. A point just in front of the J point, which is the end of the P-R interval and the beginning of the QRS complex, is called the I point. The open loop in the VCG is found when the I and J points in the ECG are at different horizontal levels. Usually, in a normal person, the I and J points are on the same level, often on the isoelectric line. With severe LV hypertrophy, the J point shifts below the I point in lead V5, and in severe RV hypertrophy, J is below I in lead V1. The I-J relationships are also changed by digitalis, hypokalemia, MI, myocardial ischemia, pericarditis, and bundle branch block.
Right and Left Ventricular Hypertrophy
When both RV and LV hypertrophy exist, the muscle with the greater degree of enlargement will dominate the electrical picture.
Bundle Branch Block
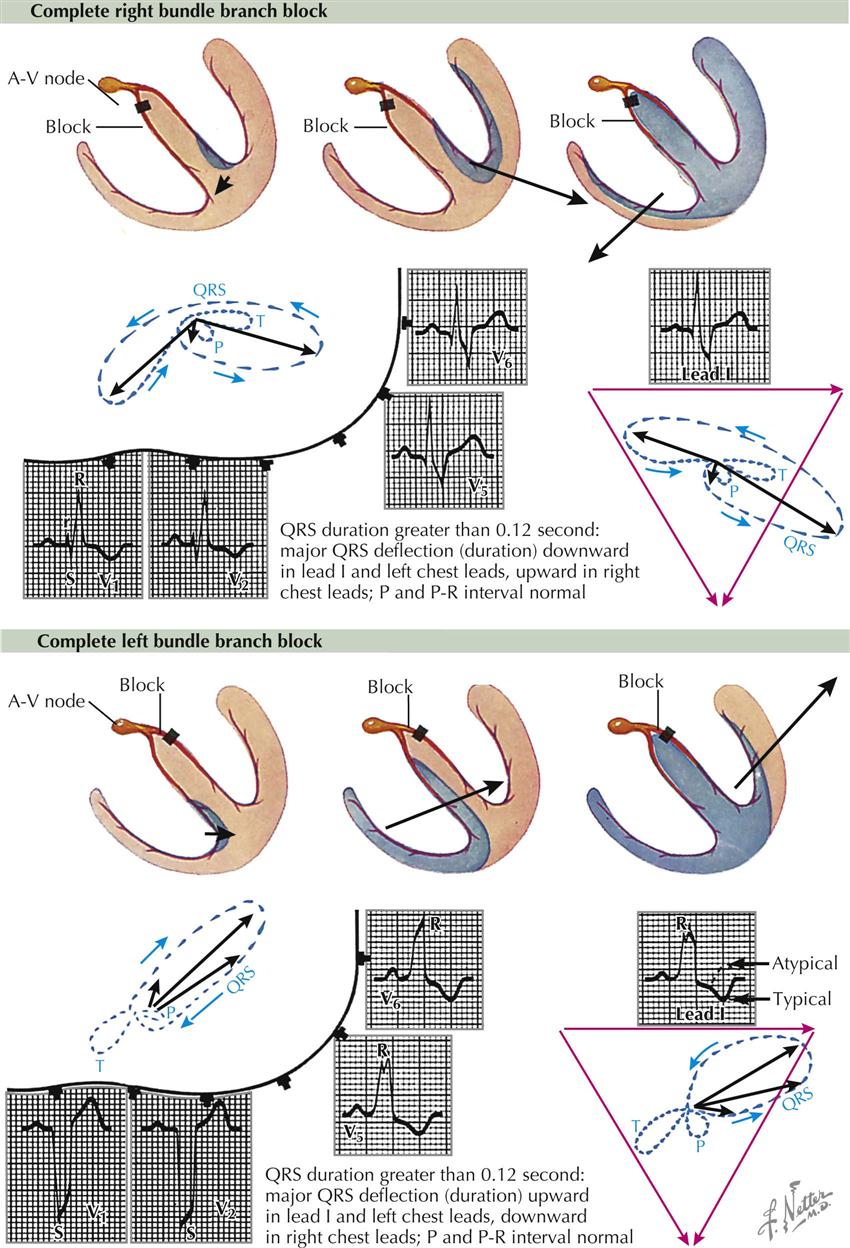
The term bundle branch block (BBB) indicates disease in, or altered transmission through, certain branches of the conduction system of the heart. Blocks may occur in the left or right ventricle or in both. A characteristic change is widening of the QRS complex greater than 0.1 second. When the duration of this complex ranges from 0.1 to 0.12 second, the block is incomplete; if greater than 0.12 second, a complete BBB exists. With a complete right BBB the first 0.04 second of the QRS complex is normal in configuration, but the last portion is abnormal (see Plate 2-22). With a left BBB the total duration of the wave is written by an abnormal depolarization wave, and the tracing is abnormal.
Bundle branch blocks may be typical or atypical. A typical BBB has a lesion only in the bundle of His or one of its branches, and there is no associated lesion. An atypical BBB, in addition to the block, has some other lesion (e.g., MI). A typical block has T waves in the opposite direction as the wave of greatest duration in the QRS complex (i.e., T is opposite S in right BBB in V6, but T is opposite R in lead V1). An atypical block does not necessarily follow this rule.
Right Bundle Branch Block
Only a small defect in the right bundle of His is necessary to block the right bundle. The first electric movement is normal from the left side of the septum to the right; this writes the usual septal Q wave in leads V5 and V6. The next movement is through the left ventricle from the endocardium to the epicardium, and this writes a normal R wave in leads V5 and V6. Finally, there is a slow progression of the activation wave through the septum and the Purkinje system on the right and through the right ventricle, which requires more time. As a result, there is a wide S wave in leads V5 and V6, and the duration of the S wave is usually greater than that of the R wave in the QRS complex. This order of depolarization—right, then left, then right—registers, in lead V1, an R, an S, and an R′ wave, and here the duration of the R′ wave is greater than that of the R wave. The VCG shows the electromotive forces going first to the right, then to the left, and then back to the right again. Writing of the VCG slows down (dots closer together) during late ventricular depolarization because the activation of the right ventricle is slow. The horizontal-plane VCG is to the right, then to the left, and then to the right front, whereas the frontal-plane ACG is right, then left, then right, and often up. Recall that in a right BBB the first part of the QRS loop is normal, but the last part is abnormal.
Right BBB often is caused by arteriosclerosis or prolonged strain on the right ventricle, as in pulmonary hypertension or pulmonary stenosis.
Left Bundle Branch Block
A block in the left bundle of His alters the entire ventricular-depolarization pathway. Ventricular depolarization starts from the right side of the septum and progresses toward the left front, writing small R waves in leads V1 and V2. The voltage next swings toward the left near the cardiac apex, then toward the left base, writing tall R waves in leads I, V5, and V6 and S waves in leads V1 and V2. The electric movement is generally toward the left scapula, and characteristically the S-T segments and T waves are opposite in direction to the major deflection of the QRS complex. When this QRS complex–T wave relationship occurs, the tracing is characteristic of typical left BBB. When the QRS complex and the T wave are not opposite or are concordant, the tracing is referred to as atypical, and another lesion (e.g., MI) probably is present as well as the block.
Left BBB is caused by arteriosclerosis, MI, cardiac failure, or severe strain on the left ventricle, as in hypertension.
Wolff-Parkinson-White Syndrome
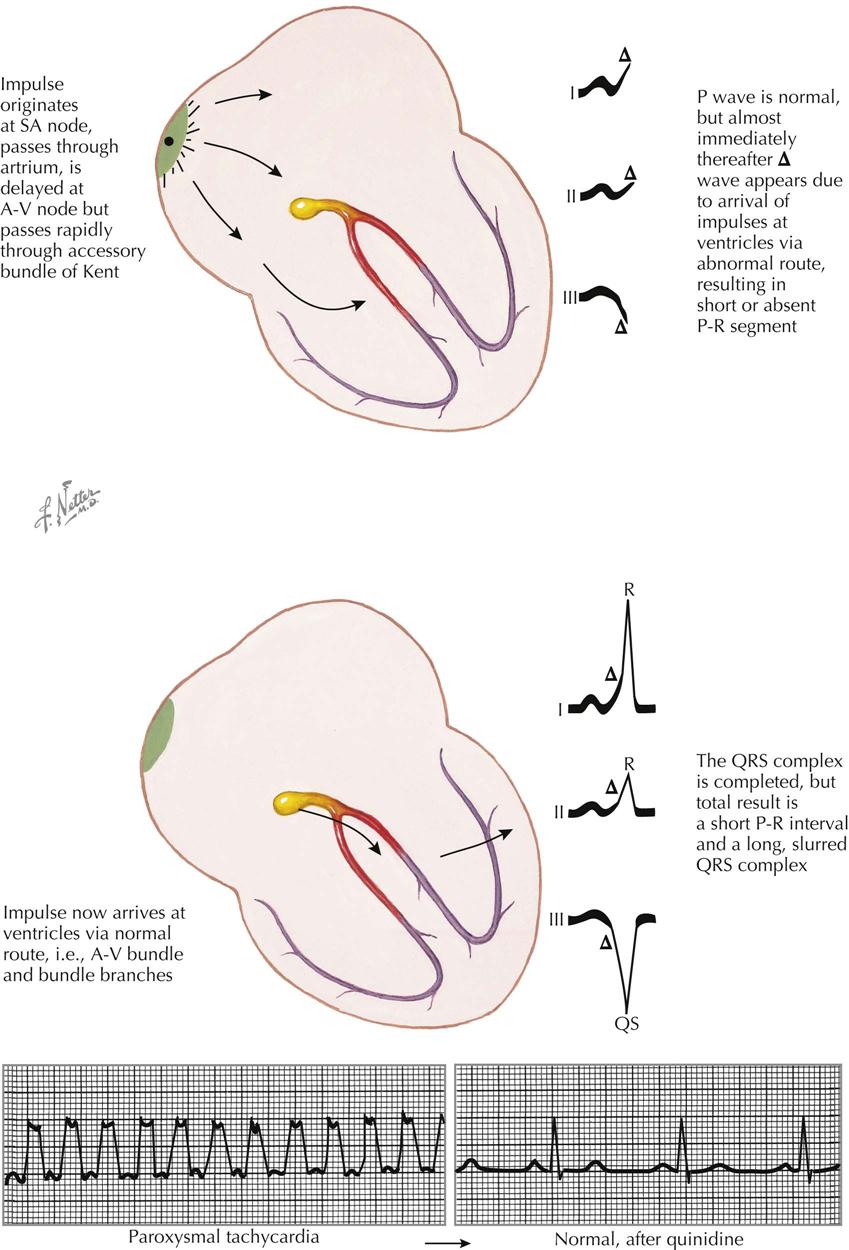
The Wolff-Parkinson-White (WPW) complex is caused by the presence of an accessory pathway. About 20% of patients with an accessory pathway have organic heart disease, and 80% have the ECG abnormality only. The accessory pathway connects the atria to the ventricles, over which depolarization occurs rapidly from atria to ventricles, resulting in ventricular preexcitation. The syndrome related to preexcitation is most often seen in young subjects who have frequent attacks of supraventricular or even ventricular tachycardia. Between attacks of rapid heartbeat, the QRS complexes consist of a short P-R interval (usually <0.11 second), a QRS complex widened by a Δ wave, and, usually, a QRS complex whose duration is from 0.11 to 0.14 second. Actually, the P-R interval is decreased by the amount the QRS complex is increased, so that the P-J interval remains quite normal (see Plate 2-23). (The P-J interval is from the beginning of the P wave to the end of the QRS. “J” stands for the junction between the QRS and ST segment on the ECG.)
The upstroke of the R wave in lead I in a patient with a right-sided accessory pathway is usually “slurred” because of the Δ wave at the beginning of the QRS complex. If the accessory pathway connects left atrium to left ventricle, depolarization will be from left to right, which will produce QRS complexes in lead I that are primarily negative. Most often, however, the accessory pathway is on the right, with the accession wave going from right to left and a Δ wave appearing at the beginning of the QRS complex in lead I. The accessory pathway could be posterior or anterior, and different ECG configurations result. The precise location of the accessory pathway is determined at electrophysiologic study before an ablation procedure.
Impulses from the sinus node travel more rapidly through the accessory pathway than through the A-V node and bundle of His. The widening of the QRS complex and the slurring of the upstroke of the R wave in lead I are explained by the depolarization wave entering the right ventricle early and without delay, through the abnormal connection between the atria and the ventricles. Since the depolarization process through the ventricles is longer than normal, because of its abnormal direction, the QRS complex is exceptionally wide. After the early depolarization of the ventricle from the accessory pathway has begun, the normal atrial impulses, which were delayed at the A-V node, enter the ventricle by the normal pathway, and the depolarization of the ventricles is completed in a normal fashion. Thus, the terminal portions of the QRS complexes are normal.
The accessory pathway predisposes to attacks of paroxysmal tachycardia by facilitating retrograde conduction into the atria with the initiation of circus movements or antegrade conduction in the pathway with retrograde conduction in the His-Purkinje system. Therefore, all young patients complaining of attacks of tachycardia should have an ECG during a period of normal heart rate to determine if a WPW pattern exists.
Procainamide or flecainide is often used successfully to block preexcitation. Digitalis is usually ineffective and may be dangerous if given alone because of 1 : 1 conduction to the ventricle in certain atrial arrhythmias (e.g., atrial fibrillation or flutter), which may result in ventricular fibrillation. Other drugs that block conduction through the A-V node can enhance conduction through the accessory pathway as well (e.g., calcium blocker adenosine).
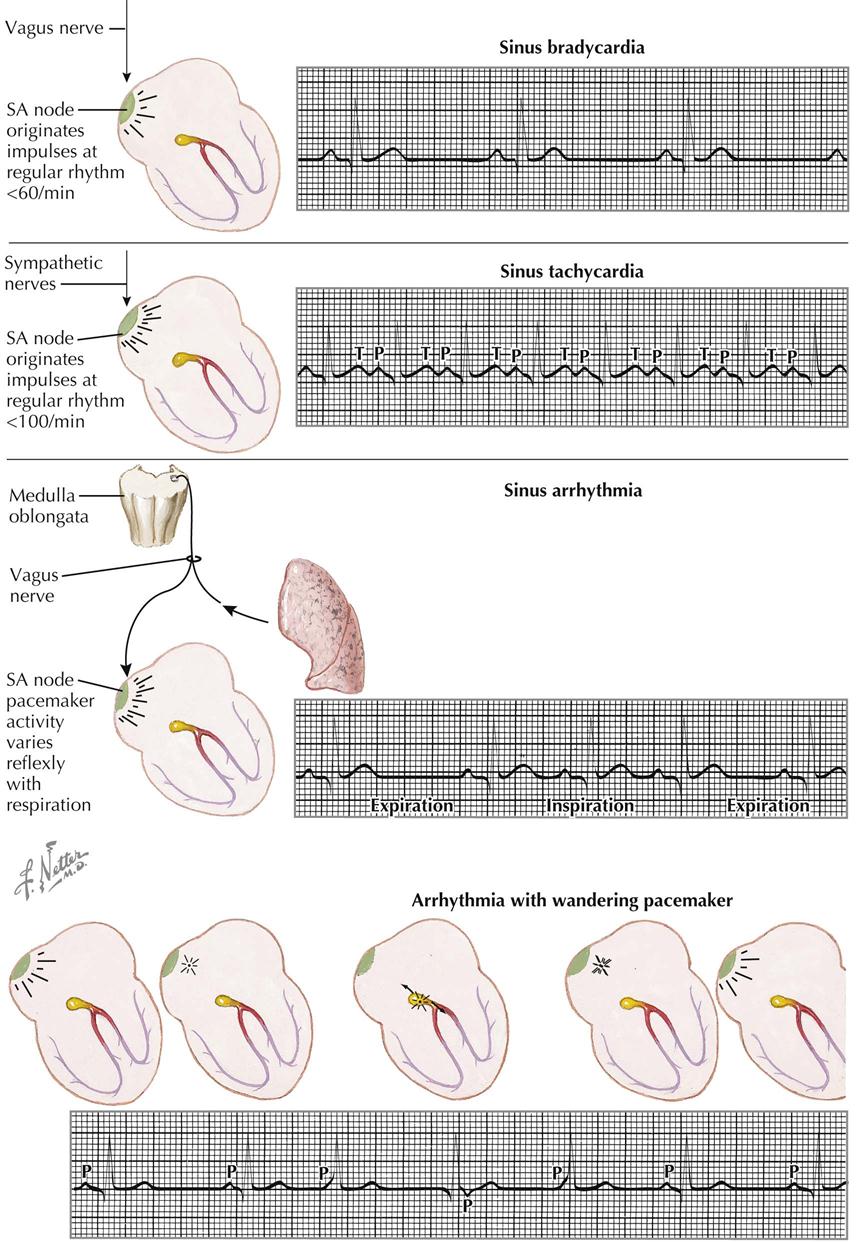
Sinus and Atrial Arrhythmias
Certain arrhythmias are caused by a disturbance at the sinus node, including sinus bradycardia, sinus tachycardia, sinus arrhythmia, and wandering pacemaker. The sinus node is under the control of the parasympathetic and sympathetic nerves, and altered function of these nerves may influence cardiac activity. The SA node is depressed by parasympathetic (vagus) functions or stimulated by sympathetic activity.
Sinus Bradycardia
In sinus bradycardia the sinus node originates impulses at a slow rate, less than 60 beats/min (see Plate 2-24). Sinus bradycardia is common in patients with high vagal tone, hypothyroidism, and increased intracranial tension; during athletic training; and during treatment with digitalis and/or reserpine. Usually the slow rate is caused, at least in part, by vagal inhibition of the sinus node.
Sinus Tachycardia
Sympathetic-nerve stimulation or the blocking of vagus nerves can produce sinus tachycardia. The sinus node originates impulses at a rate greater than 100 beats/min, and close inspection of these curves shows some variation in the R-R interval (see Plate 2-24). It is important to observe this variation to differentiate sinus tachycardia from atrial tachycardia, in which there is no significant variation between the R-R intervals. Sinus tachycardia is found in patients after exercise or smoking; in hyperthyroidism, anxiety, toxic states, fever, anemia, and diseases involving the heart or lungs; and from other causes. Sinus tachycardia is characterized by a slowing of the pulse rate during carotid sinus pressure, then by the gradual return of the rate to its basic level on release of pressure. This is in contrast to the reaction to carotid pressure in atrial tachycardia, which may cause the rhythm to change abruptly to a sinus rhythm.
Sinus Arrhythmia
Sinus arrhythmia is a variation in cardiac rate during breathing or sometimes with other organ function, such as contraction of the spleen. The arrhythmia is typically found in children or in patients with Cheyne-Stokes respiration. Usually, afferent impulses from the lungs travel to the cardiac center, with efferent impulses traveling over the vagus nerve to the sinus node. The pacemaker activity at the node varies reflexively with respiration. Generally, there are about five cardiac beats to each respiratory cycle. With expiration, the cardiac rate is slow; with inspiration, it is more rapid (see Plate 2-24).
Wandering Pacemaker
A wandering pacemaker is present when, with each beat, the pacemaker changes its position in the atrium, often traveling down to and into the A-V node and back to the sinus node again. This occurs when there is a variation in the vagal tone at the sinus node or there are changes in sympathetic stimulation. In the ECG the P-R interval becomes progressively shorter, and the P waves often disappear within the QRS complexes or may even appear after the QRS complexes. In lead II, at times the P waves may be inverted because the atria are depolarized from the A-V node to the sinus node, instead of in the usual direction. A wandering pacemaker is not a serious irregularity; it is often transient and may be stopped by anticholinergic agents such as atropine (see Plate 2-24).
Premature Contraction
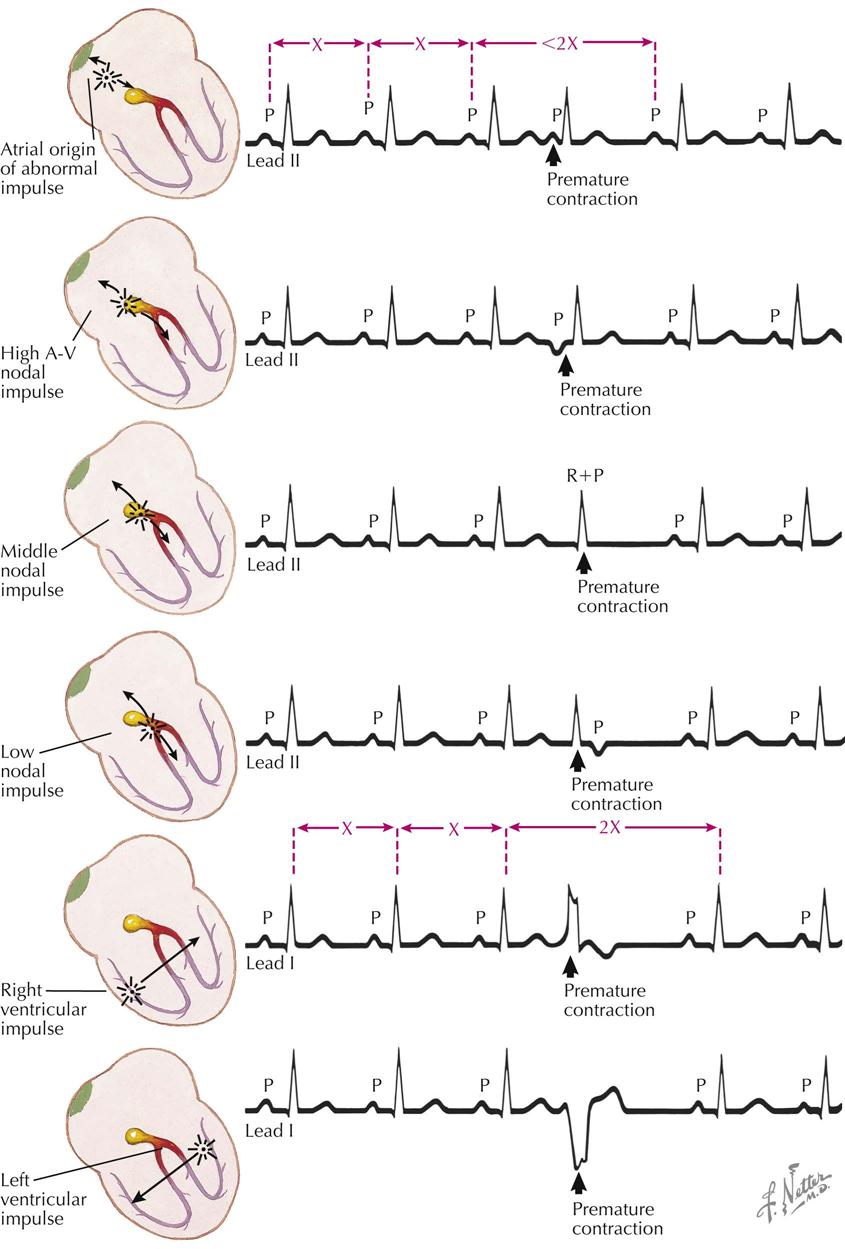
Three common terms used to describe certain abnormal cardiac contractions are premature contractions (beats occurring early in time), ectopic beats (beats with sites of origin outside the sinus node), and extrasystoles (added beats). Only extrasystoles are truly added or additional beats, often interpolated or added between two normal beats without interfering with the basic rhythm.
Atrial Premature Contractions
Premature atrial contractions are caused by an irritability of the atria, with early contractions emanating from an impulse in the atria outside the SA node. Atrial is differentiated from ventricular premature contractions by measurement of the compensatory pause. With atrial contractions the compensatory pause is incomplete, whereas with ventricular premature contractions the pause is complete (see Plate 2-25). Measurement of the compensatory pause for atrial premature beats follows:
This total duration is shorter than the time between two normal P-P intervals that do not include a premature contraction (2×).
Nodal Premature Contractions
Nodal premature contractions result from stimulation of the A-V node. Usually there is retrograde conduction starting at the A-V node, with an accession wave moving over the atria from the A-V node to the SA node, and P waves of an abnormal form are written. At times there is no retrograde conduction, and P waves and atrial contraction do not occur. The stimulus at the A-V node often is vagal or is caused by disease (see Plate 2-25).
High Atrioventricular Nodal Rhythm
High A-V nodal rhythm prevails when the head of the A-V node becomes the pacemaker, and atrial depolarization occurs in a retrograde fashion from the A-V node to the SA node. With nodal premature contractions, inverted P waves are written in leads II, III, and aVF because of retrograde auricular depolarization. The P-R interval is short, P waves precede the QRS complexes, and the QRS and T waves are of normal configuration.
Middle Nodal Rhythm
When the junctional tissue is stimulated below the A-V node near its center, atrial and ventricular depolarizations occur simultaneously. Here the P waves fall within the QRS complexes, and the summation complexes (QRS + P) are slightly different in appearance from the normal QRS complexes of the basic mechanism.
Low Nodal Impulse
If the pacemaker is low in the junctional tissues, the ventricles are depolarized before the atria, the QRS complexes are written first, and inverted P waves in leads II, III, and aVF are written later.
Right Ventricular Impulse
The P wave rhythm is not disturbed. The ventricles contract early from a stimulus in the region of the right ventricle. The accession wave travels from right to left and, moving in this direction, produces upright QRS deflections in lead I. The duration of this complex is long because of the abnormally long pathway and is longer than 0.10 second, followed by S-T segments and T waves in the opposite direction as the major deflections of the QRS complexes. The compensatory pause is complete; that is, the interval between two normal QRS complexes that do not contain an ectopic beat is the same as the time from a QRS complex before the ectopic QRS beat to the QRS complex that follows this beat (see Plate 2-25).
Left Ventricular Impulse
A pacemaker in the LV wall produces an accession wave that travels from left to right, in lead I resulting in negative (inverted) wide QRS complexes with positive (upward) S-T segments and T waves and complete compensatory pauses.
Sinus Arrest, Sinus Block, and Atrioventricular Block
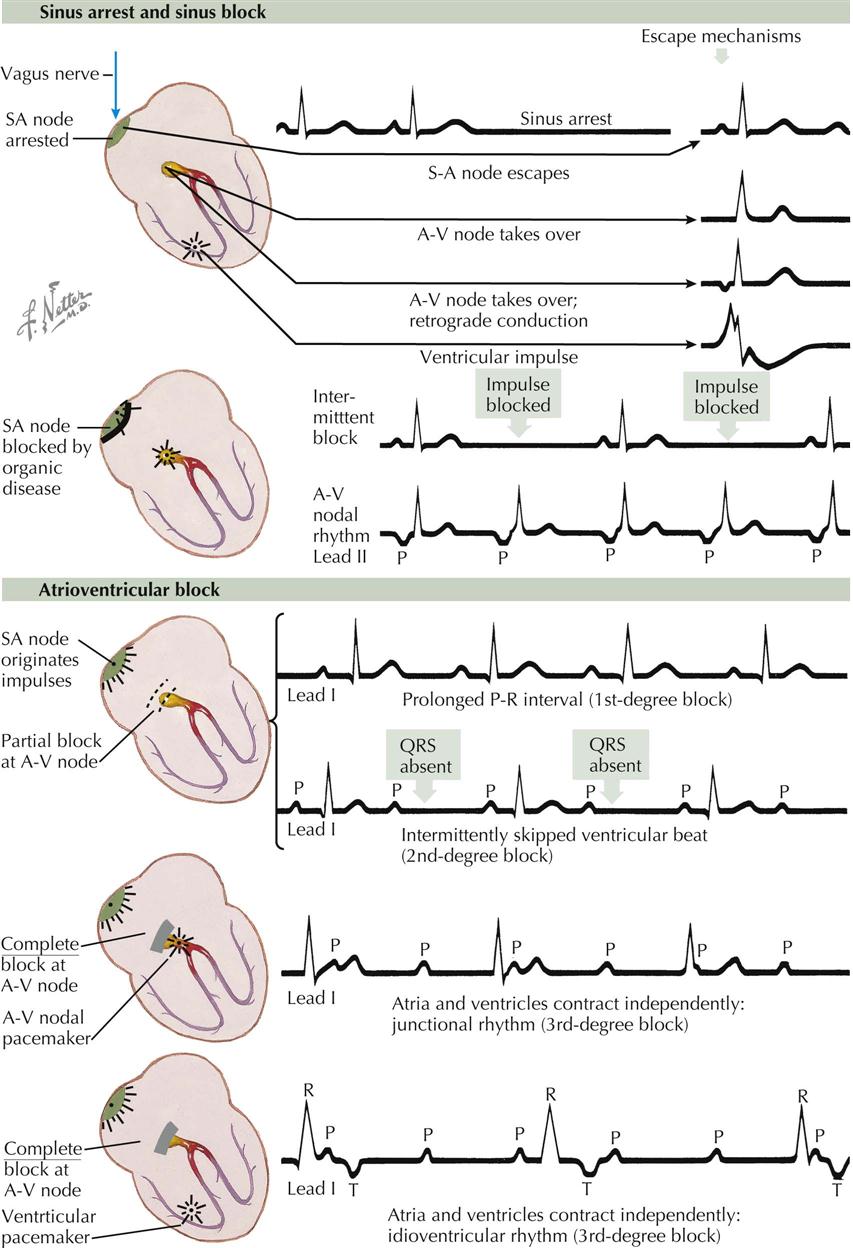
Sinus Arrest
Sinus arrest is usually a functional condition in which the sinus node fails to send impulses to the atria, resulting in a period of cardiac asystole. Eventually, recovery occurs. The first beat after the asystole may be a normal sinus beat (known as a sinus escape beat), or the A-V node may take over for the first beat, originating from a pacemaker in the A-V node, called a nodal escape beat (see Plate 2-26). Here, the P wave may be detectable when there is retrograde atrial conduction. In this case, inverted P waves either precede or follow the QRS complexes in leads II, III, and aVF, or there may be no retrograde conduction and hence no P waves. A ventricular escape beat has all the characteristics of a ventricular ectopic beat. Escape beats of these various types may precede sinus rhythm, sinus bradycardia, sinus tachycardia, nodal rhythm, ventricular tachycardia, or other cardiac rhythms or arrhythmias.
Sinoatrial Block
In SA block the sinus node is blocked organically or chemically (see Plate 2-26). The block may occur intermittently, in which case every other beat may fail to appear. The sinus node recovers slowly after depolarization, and the refractory period is such that only every other beat is written. Periodically, in some cases, more than one beat is skipped. In other cases the SA node is more severely diseased, and repolarization of the P wave occurs slowly. An A-V nodal rhythm develops and takes over the role of pacemaker, and the P waves are inverted in leads II, III, and aVF.
Atrioventricular Block
Atrioventricular block often is classified as a first-, second-, or third-degree A-V block (see Plate 2-26). A first-degree A-V block has a prolonged P-R interval. A second-degree A-V block is characterized by the occasional dropping of a QRS complex. A third-degree A-V block shows a complete dissociation between atrial and ventricular contractions. With a first-degree A-V block, the P-R interval is long, exceeding 0.2 second for rates above 60 beats/min. With a second-degree A-V block, an occasional P wave is not followed by a QRS complex. Normally there is one P wave for every QRS complex, but with a second-degree block, there may be seven P waves for every six QRS complexes (or some other ratio of P to QRS). This degree of block would be designated 7 : 6. A complete A-V block may be of two types: (1) the pacemaker may be in the A-V nodal tissue, with QRS complexes essentially normal in appearance and not wide, or (2) the pacemaker may be in His Purkinje system, and the QRS complexes will be wide and abnormal in shape. In either case, there will be a complete dissociation between the beating of the atria and the ventricles. There also will be two different frequencies: one frequency of about 76 beats/min, which represents the atrial depolarization rate, and the other 30 beats/min, which is the ventricular-depolarization rate.
These arrhythmias are important clinically because a slow rate from any cause greatly decreases cerebral, coronary, and other organ circulation, which results in tissue damage and often death. Every medical or surgical effort should be made to maintain a normal rate. Stopping drugs such as beta blockers and calcium antagonists or initiating pacemaker therapy may be of great benefit.
Tachycardia, Fibrillation, and Atrial Flutter
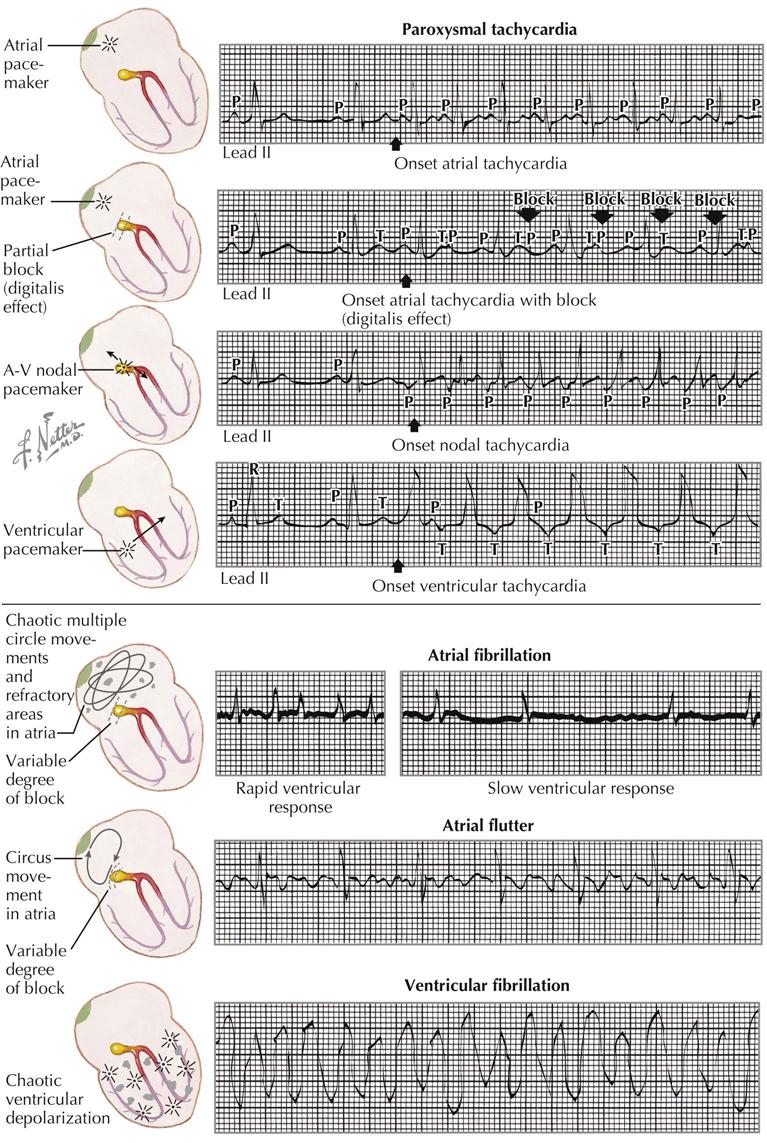
Paroxysmal Tachycardia
Paroxysmal Atrial Tachycardia
Paroxysmal atrial tachycardia (PAT) is caused by a pacemaker in the atria that gives rise to rapid regular impulses at a rate above 100 beats/min, often as much as 180 beats/min (see Plate 2-27). P waves can usually be identified, although in some cases the P and T waves fall on each other. The R-R intervals are regular. PAT is characterized by an abrupt beginning and ending. The onset and end often occur within the course of a single beat. Carotid sinus pressure may cause a sudden reversion to sinus rhythm, which is diagnostic of PAT.
Paroxysmal Atrial Tachycardia with Block
It is important to recognize PAT with block because it may be caused by digitalis intoxication, in which case the digitalis should be withdrawn. The condition is the same as the PAT just described.
Paroxysmal Nodal Tachycardia
This disturbance is characterized by inverted P waves in leads II, III, and aVF because of retrograde atrial conduction. The P waves fall before, within, or after the QRS complexes. Retrograde conduction may occur. Paroxysmal nodal tachycardia often is caused by disease of the A-V node.
Ventricular Tachycardia
Ventricular tachycardia is caused by rapid impulse formation in a ventricle. The arrhythmia is serious and often associated with the toxic effects of digitalis and many antiarrhythmics (e.g., sotalol), or it may be caused by serious organic cardiac disease. The ventricular rate is more rapid than the atrial rate, and close inspection of the tracing allows identification of occasional P waves occurring at the basic atrial rate. The ventricular contractions are generally more than 150 beats/min and may be greater than 200 beats/min. The QRS complexes are wide, with T waves that are discordant with the QRS complexes, and the P-R intervals are not identical.
Atrial Fibrillation
Atrial fibrillation (AF) is the most common arrhythmia on hospital admission in older patients AF is caused by the presence of multiple islands of abnormal myocardium in various states of refractoriness, so that the atrial depolarization wave must wind its way in and out of these islands of tissue, resulting in electric potentials of low voltage with variable directions. Only some of these impulses are transmitted through the A-V node; thus all the R-R intervals are different because of the irregularity of conduction (see Plate 2-27).
Rheumatic heart disease, hyperthyroidism, and arteriosclerotic heart disease are common causes of AF. There are no consistently identifiable P waves in the tracing with AF. The ventricular rate may be rapid or slow, depending on the degree of conduction through the A-V node and the presence of heart failure or digitalis and other drugs that slow or accelerate conduction. If the ventricular rate is rapid and heart failure is present, the rate can be slowed greatly by beta blockers, calcium antagonists, and digitalis. Sinus rhythm can be achieved by electrical or chemical cardioversion and antiarrhythmics as well as by catheter-based ablation of atrial tissue in the pulmonary vein or other sites of origin of the arrhythmia.
Atrial Flutter
Atrial flutter is caused by a circus movement or a low atrial pacemaker that fires regularly at a rapid rate, usually about 220 beats/min (see Plate 2-27). Often there is a variable block at the A-V node, and only every other beat, or every third or fourth beat, is transmitted to the ventricles. A clinical clue to the diagnosis of atrial flutter is a ventricular rate of 150 beats/min. This usually means atrial flutter with 2 : 1 block. In leads II, III, and aVF, usually inverted P waves are followed by atrial T waves, or continuous atrial activity results from the circus movement. These waves have a sawtooth appearance.
Arteriosclerotic heart disease, hyperthyroidism, and rheumatic heart disease are common causes of atrial flutter. This is a macro–reentrant arrhythmia and can be ablated with radiofrequency energy applied in the right atrium.
Ventricular Fibrillation
Multiple periodic ventricular pacemakers result in erratic depolarization of the ventricles, producing an ECG that resembles distorted sine waves irregular in amplitude and duration. The waves may be of high or low voltage. With ventricular fibrillation there is no effective pumping of the heart. Severe organic cardiac disease or the toxic effects of digitalis or antiarrhythmics that prolong the Q-T interval can produce a similar condition. The treatment of choice is immediate electrical defibrillation (see Plate 2-27).
Effect of Digitalis and Calcium/Potassium Levels on Electrocardiogram
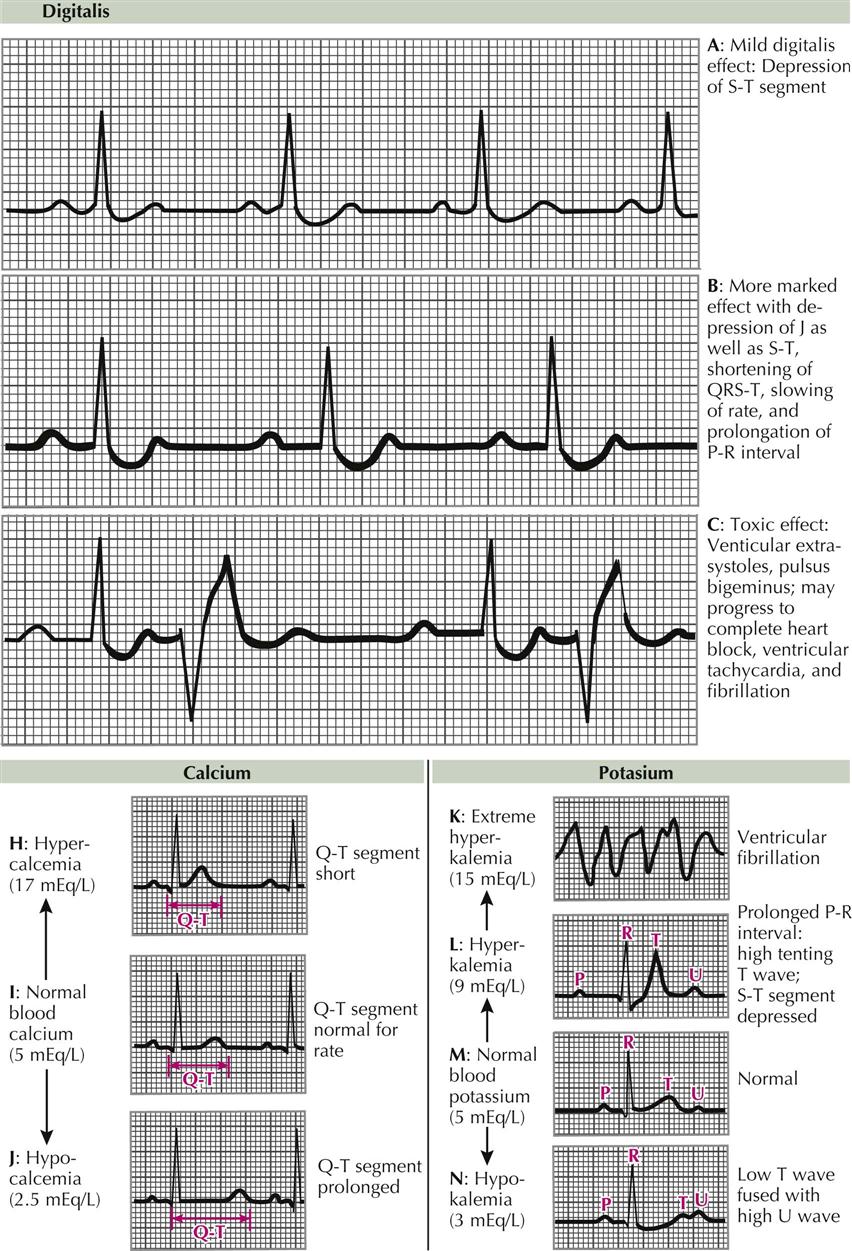
Drug Effects: Digitalis
The effect of common drugs such as digitalis and other antiarrhythmic agents on the ECG depends on the dose, the rate of excretion, responsiveness of the patient, and previous ECG abnormalities. Small doses of digitalis produce a mild digitalis effect with sagging depression of the ST segment, negative J shifts, and lowering of the T waves (Plate 2-28, A). The QT interval may be shortened slightly because of increases in the rate of ventricular repolarization. Digitalis usually slows the cardiac rate and A-V conduction because of vagal depression of the SA and AV nodes. With large doses a further depression of J occurs, with sagging of the S-T segments and a distinct decrease in the Q-T intervals, which fall outside of normal limits (Plate 2-28, B). With toxic doses there is a depression of the A-V conduction tissue, with prolonged P-R intervals, and a state of ventricular irritability, with ventricular ectopic beats, which may be single or multiple and multifocal (Plate 2-28, C). Coupling is common, and atrial fibrillation or flutter, with paroxysmal atrial tachycardia, and block or variable degrees of A-V block may occur.
Drugs such as procainamide (Pronestyl) and lidocaine (Xylocaine), tend to depress the electric activity of the atria and ventricles. Characteristically, the P waves increase in duration, with a slight increase in amplitude. Drugs such as ibutilide often cardiovert the AF to sinus rhythm, but the patient should receive intravenous magnesium sulfate before treatment, to prevent torsades de pointes. Intravenous amiodarone also prolongs the Q-T interval and frequently will cardiovert the patient to sinus rhythm.
Calcium and Potassium Levels
Hypercalcemia may be encountered in patients with hyperparathyroidism. The ECG is characterized by shortening of the Q-T intervals, often with increased amplitudes of the T waves (Plate 2-28, H). The T waves begin immediately after the ending of the QRS complexes, so the QRS complexes and T waves appear compressed.
Hypocalcemia increases the duration of the S-T and Q-T intervals (Plate 2-28, J). The QRS complexes and T waves merely appear to be widely separated from each other by long S-T segments, which often are isoelectric.
Hyperkalemia depresses the atria, the A-V node, and the ventricles but has less effect on the sinus node. Consequently, increases in potassium concentration produce prolonged P-R intervals (Plate 2-28, L), high T waves, SA block with small or absent mechanical contractions of the atria, tenting of the T waves (tall and narrow at base), intraventricular block with widening of QRS complexes, abnormal shifts of the S-T segment, and ventricular standstill or ventricular fibrillation (Plate 2-28, K).
Hypokalemia frequently results from administration of diuretics or cortisone or from vomiting, diarrhea, surgical suction, or low intake of potassium. Hypokalemia causes an amplitude loss in the T waves (Plate 2-28, N) and a prominence of the U waves, with easily measured Q-U intervals. T and U waves are clearly separated in some leads but may fuse in others, causing a T-U complex. Deviations of the S-T segment (depression or elevation) may occur. It is difficult to recognize hypokalemia associated with other abnormal states, such as myocardial ischemia or infarction, or with cardiac drugs.
Cardiac Pacing
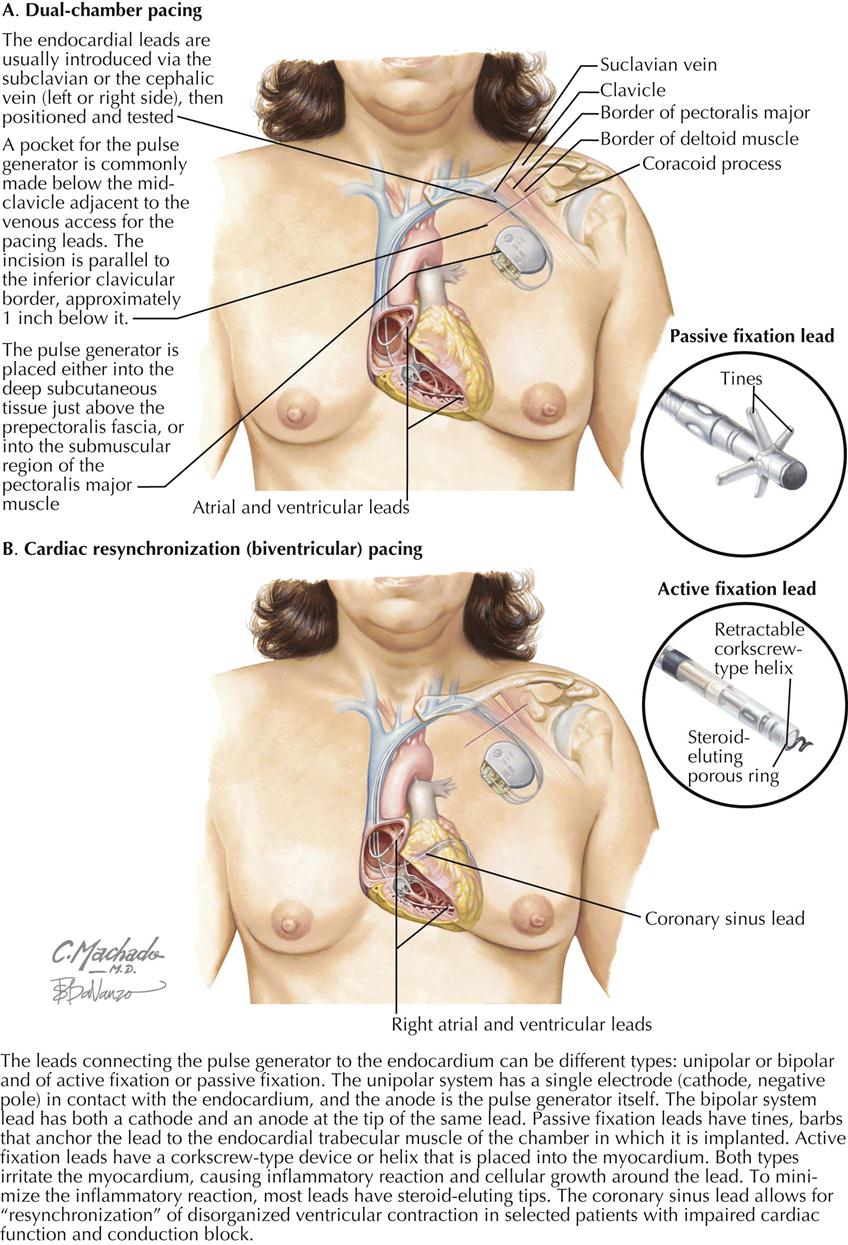
When patients are symptomatic because of symptomatic bradycardia (e.g., syncope, dizziness, lethargy), a cardiac pacemaker can effectively decrease or eliminate symptoms because it treats the pathophysiologic problem: slow heart rate, which can result from sinus node dysfunction or A-V block. Some devices pace only the atrium, some only the right ventricle, and some pace both the atrium and the ventricle sequentially. Some pacemakers also are combined with an implantable cardioverter-defibrillator (ICD), and others can improve cardiac synchronization (e.g., BiV pacemakers).
Current Transvenous Pacemakers
A modern pacemaker generator (usually a lithium battery) is placed subcutaneously under the clavicle. This generator is sealed so as not to imbibe body fluids and can deliver electrical impulses to the electrode leads within the right atrial appendage and right ventricle and to the left ventricle by way of a coronary sinus electrode lead (BiV pacing). The pacemaker generator is immunologically inert.
Permanent Pacing
The pacemaker implant procedure is performed under fluoroscopy, usually by a trained cardiologist or cardiac surgeon. Most often, percutaneous access to the left subclavian lead is used to pass the electrode leads into the heart, but the right subclavian vein can be used when the left is not available. Fluoroscopy confirms the positioning of the pacing leads in the right atrial or right ventricular chambers and of the left ventricular epicardial lead when BiV pacing is employed.
Pacemaker Types
Pacemakers can be of three types and are used to pace a single or multiple chambers of the heart. A single-chamber pacemaker involves the placement of a single lead into an atrium or ventricle, which then can sense and pace either the atrium or the ventricle. The most common reason for pacing only the atrium is dysfunction of the sinus node, such as sick sinus syndrome. The most frequent reason for pacing only the right ventricle is atrial fibrillation.
In contrast, a dual-chamber pacemaker consists of two leads inserted into the heart (see Plate 2-29). One lead can be inserted into the right atrial appendage and fixated in that position, pacing the atrium. Another pacing lead can be inserted into the right ventricle and fixated in that position. When activated and functioning, these two pacing leads pace the atrium and ventricle sequentially, closely simulating the natural conduction system of the heart. This type of pacing is the most common type currently used.
A rate-responsive pacemaker is usually a dual-chamber pacemaker (can be single chamber) that responds to increased demand for an increased heart rate. The patient’s increased physical activity (exercise) increases pectoral muscle activity, which is sensed by the pacemaker generator. Once this physical activity is detected, the pacemaker increases the rate of electrical impulses and increases heart rate to meet the patient’s physiologic demands for increased cardiac output. Rate-responsive pacemakers are often used for patients with symptomatic bradycardia.
Biventricular Pacing
In contrast to standard two-lead A-V sequential pacing, biventricular (BiV) pacing consists of three leads: RA appendage lead, RV lead, and a lead introduced into the coronary sinus and advanced to a lateral vein on the epicardial surface of the LV free wall. The position of the epicardial lead corresponds to the position of an obtuse marginal artery. This lead system, in addition to A-V pacing, enables pacing of the LV free wall (see Plate 2-29).
Cardiac resynchronization therapy (CRT) uses BiV pacing because the lead system paces both the septal LV wall and the lateral LV wall. When viable tissue is present in these areas, the left ventricle resynchronizes the contraction of a heart whose opposing walls do not contract in synchrony. Dyssynchrony frequently occurs in patients with systolic heart failure, many with QRS duration longer than 120 msec, which qualifies a patient for CRT. These patients are at high risk for sudden cardiac death because many have an LV ejection fraction of 35% or less. The BiV lead system can be combined with an ICD to prevent sudden cardiac death from ventricular tachycardia or ventricular fibrillation, a common companion to severe heart failure.