Section 1 Diagnosis, classification, epidemiology and biochemistry
The syndrome of diabetes mellitus
Diagnostic criteria for diabetes mellitus
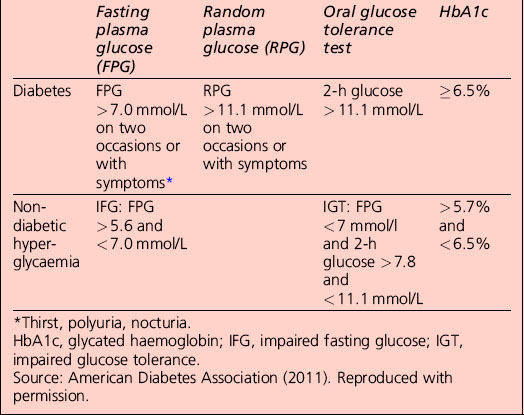
• A1C ≥ 6.5%. The test should be performed in a laboratory using a method that is certified by the National Glycohemoglobin Standardization Program (NGSP) and standardized to the Diabetes Control and Complications Trial (DCCT) assay, or
• fasting plasma glucose (FPG) ≥ 126 mg/dL (7.0 mmol/L). Fasting is defined as no caloric intake for at least 8 h, or
• 2-h plasma glucose ≥ 200 mg/dL (11.1 mmol/L) during an oral glucose tolerance test (OGTT). The test should be performed as described by the World Health Organization (WHO), using a glucose load containing the equivalent of 75 g anhydrous glucose dissolved in water
• in a patient with classic symptoms of hyperglycaemia or hyperglycaemic crisis, a random plasma glucose ≥ 200 mg/dL (11.1 mmol/L)
• in the absence of unequivocal hyperglycaemia, the result should be confirmed by repeat testing.
Categories of increased risk for diabetes (pre-diabetes): impaired fasting glucose (IFG)/impaired glucose tolerance (IGT)
Categories of increased risk for diabetes (pre-diabetes) (ADA, 2011)
FPG 100–125 mg/dL (5.6–6.9 mmol/L): IFG
2 h plasma glucose in the 75-g OGTT 140–199 mg/dl (7.8–11.0 mmol/l): IGT
Oral glucose tolerance test
The patient is prepared as detailed in Table 1.1:
• Anhydrous glucose is dissolved in 300 mL water; flavouring with sugar-free lemon and chilling increases palatability and may reduce nausea. The patient should sit quietly throughout the test.
• Blood glucose is sampled before (time zero) and 120 min after ingestion of the drink, which should be completed within 5 min.
• Urinalysis may also be performed every 30 min, although this is really of interest only if a significant alteration in renal threshold for glucose is suspected.
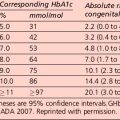
Interpretation of the results of a 75-g glucose tolerance test is presented in Table 1.2. Note that results apply to venous plasma: whole blood values are 15% lower than corresponding plasma values if the haematocrit is normal. For capillary whole blood, the diagnostic cut-offs for diabetes are ≥ 6.1 mmol/L (fasting) and 11.1 mmol/L (i.e. the same as for venous plasma). The range for impaired fasting glucose based on capillary whole blood is ≥ 5.6 and < 6.9 mmol/L. Note that marked carbohydrate deprivation can impair glucose tolerance; the subject should have received adequate nutrition in the days preceding the test.
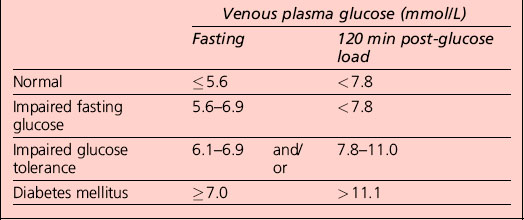
Non-diabetic hyperglycaemia
The term ‘pre-diabetes’, which is sometimes used to refer to IGT and/or IFG, is no longer the preferred term because not all patients go on to develop diabetes. A significant proportion of individuals who have impaired glucose tolerance diagnosed by an OGTT revert to normal glucose tolerance on retesting. Non-diabetic hyperglycaemia (NDH) is increasingly being used as a wider term that encompasses hyperglycaemia where the HbA1c level is raised but is below the diabetic range (Table 1.3).
Classification of diabetes mellitus
Type 1 diabetes (β-cell destruction, usually leading to absolute insulin deficiency)
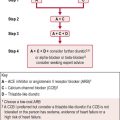
Diabetic ketoacidosis
DKA is a life-threatening medical emergency requiring hospitalization for treatment with intravenous fluids and insulin. Patients with the features listed in Table 1.4 along with the following features should be admitted promptly to hospital for further assessment and treatment:
Table 1.4 Cardinal clinical features of diabetic ketoacidosis
The diagnosis and management of DKA are considered in more detail in Section 4.
Type 2 diabetes (ranging from predominantly insulin resistant with relative insulin deficiency to predominantly an insulin secretory defect with insulin resistance)
Measures of insulin resistance (Table 1.5)
| HOMA (R) = [Insulin (mU/L) × glucose (mmol/L)]/22.5 |
| HOMA β-cell function = [20 × insulin mU/L]/[glucose (mmol/L) − 3.5] |
| QUICKI employs the log of both blood insulin and glucose concentrations to quantify insulin resistance |
| HOMA and QUICKI measures of insulin resistance are usually in very close agreement |
HOMA, homeostasis model assessment; QUICKI, quantitative proliferator-activated receptor.
Other specific types of diabetes
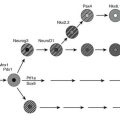
Genetic defects of the β-cell
Several forms of diabetes are associated with monogenetic defects in β-cell function. These forms of diabetes are frequently characterized by onset of hyperglycaemia at an early age (generally before age 25 years). They are referred to as maturity-onset diabetes of the young (MODY) and are characterized by impaired insulin secretion with minimal or no defects in insulin action. They are inherited in an autosomal dominant pattern. Abnormalities at over six genetic loci on different chromosomes have been identified to date. The most common form is associated with mutations on chromosome 12 in a hepatic transcription factor referred to as hepatocyte nuclear factor (HNF)-1α; MODY3 accounts for 70% of the MODY population A second form is associated with mutations in the glucokinase gene on chromosome 7p and results in a defective glucokinase molecule. Glucokinase converts glucose to glucose 6-phosphate, the metabolism of which, in turn, stimulates insulin secretion by the β-cell. Thus, glucokinase serves as the ’glucose sensor’ for the β-cell. Because of defects in the glucokinase gene, increased plasma levels of glucose are necessary to elicit normal levels of insulin secretion. Patients with MODY2 present with a less severe form of hyperglycaemia that can be managed with medical nutrition therapy alone. The less common forms result from mutations in other transcription factors, including HNF-4α, HNF-1β, insulin promoter factor (IPF)-1 and NeuroD1 (Table 1.6). Up to 15% of patients with MODY present with clinical characteristics of MODY, but do not have any known mutation and are classified as MODY-X until further genetic loci have been explored.
Patients with any form of diabetes may require insulin treatment at some stage of their disease. Such use of insulin does not, of itself, classify the patient.
HNF, hepatocyte nuclear factor; IPF, insulin promoter factor; MODY, maturity-onset diabetes of the young.
Source: American Diabetes Association (2011). Reproduced with permission.
Drug- or chemical-induced diabetes
Many drugs can impair insulin secretion. These drugs may not cause diabetes by themselves, but they may precipitate diabetes in individuals with insulin resistance. Certain toxins such as that in Vacor (a rat poison) and intravenous pentamidine can permanently destroy pancreatic β-cells. Such drug reactions fortunately are rare. In such cases, the classification is unclear because the sequence or relative importance of β-cell dysfunction and insulin resistance is unknown. There are also many drugs and hormones that can impair insulin action. Examples include glucocorticoids and nicotinic acid. Patients receiving interferon-α have been reported to develop diabetes associated with islet cell antibodies and, in certain instances, severe insulin deficiency. Such drug reactions fortunately are rare. The list shown in Table 1.6 is not all-inclusive, but reflects the more commonly recognized drug-, hormone- and toxin-induced forms of diabetes.
Other genetic syndromes sometimes associated with diabetes
Many genetic syndromes are accompanied by an increased incidence of diabetes mellitus. These include the chromosomal abnormalities of Down, Klinefelter and Turner syndromes. Wolfram syndrome is an autosomal recessive disorder characterized by insulin-deficient diabetes and the absence of β-cells at autopsy. Additional manifestations include diabetes insipidus, hypogonadism, optic atrophy and neural deafness. Other syndromes are listed in Table 1.6.
Gestational diabetes mellitus (GDM)
Testing for gestational diabetes
Following publication of the Hyperglycemia and Adverse Pregnancy Outcomes (HAPO) trial, the International Association of Diabetes and Pregnancy Study Groups (IADPSG), an international consensus group with representatives from multiple obstetrical and diabetes organizations, including ADA, developed revised recommendations for diagnosing GDM (Table 1.7):
• Perform a 75-g OGTT, with plasma glucose measurement fasting and at 1 and 2 h, at 24–28 weeks of gestation in women not previously diagnosed with overt diabetes. The OGTT should be undertaken in the morning after an overnight fast of between 8 and 14 h, after at least 3 days of unrestricted diet (≥ 150 g carbohydrate per day) and unlimited physical activity. The subject should remain seated and should not smoke throughout the test.
• The diagnosis of GDM is made when any of the plasma glucose values in Table 1.7 are exceeded.
Table 1.7 Screening for and diagnosis of gestational diabetes mellitus (GDM)
| 75-g OGTT, with plasma glucose measurement fasting, 1 h and 2 hrs, at 24–28 weeks of gestation in women not previously diagnosed with overt diabetes |
| The OGTT should be performed in the morning after an overnight fast of at least 8 h |
| The diagnosis of GDM is made when any of the following plasma glucose values are exceeded: |
OGTT, oral glucose tolerance test.
Epidemiology
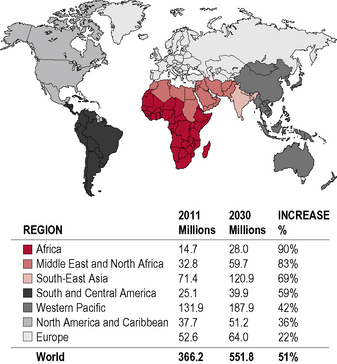
Diabetes is one of the most common forms of chronic diseases globally, affecting almost all ethnic groups. In 2011 it was estimated that in 366 million people worldwide suffered from diabetes, most of them living in developing nations (see appendix 1.1, figure 1.5). Globally, almost 6.6% of those aged 20–80 years were estimated to suffer from diabetes. Some 80% of people with diabetes live in low- and middle-income countries. This figure is estimated to increase to 552 million by 2030 (see appendix 1.1, figure 1.6), with the greatest increase in developing countries such as India and China; (see appendix 1.1, figure 1.7) 183 million people (50%) with diabetes are undiagnosed. Traditionally diabetes was thought to be a disease affecting people aged over 55 years. It is now increasingly appreciated that the age of onset of diabetes, especially in developing countries, is decreasing. In India it is estimated that 70% of all new-onset diabetes is in those aged less than 45 years of age.
This rapid rise is occurring in parallel with the obesity epidemic. There is also a sharp rise in the number of patients with impaired glucose tolerance and impaired fasting glucose (Table 1.9). These patients, with so-called pre-diabetes, are at increased risk of developing diabetes in the future and should be the target of preventive strategies.
Table 1.9 Diabetes and impaired glucose tolerance (IGT) for 2011 and 2030
| 2010 | 2030 | |
|---|---|---|
| Total world population (billions) | 7.0 | 8.3 |
| Adult population (20–79 years, billions) | 4.4 | 5.6 |
| Diabetes and IGT (20–79 years) | ||
| Global prevalence (%) | 8.3 | 9.9 |
| Comparative prevalence (%) | 8.5 | 8.9 |
| No. of people with diabetes (millions) | 366 | 552 |
| IGT | ||
| Global prevalence (%) | 6.4 | 7.1 |
| Comparative prevalence (%) | 6.5 | 6.7 |
| No. of people with IGT (millions) | 280 | 398 |
Source: International Diabetes Federation. IDF Diabetes Atlas, 5th edn. IDF, Brussels; 2011. Reproduced with permission.
Global maps illustrating the projected increase from 2010 to 2030 in the prevalence of diabetes, by region, can be found in Appendix 1.1.
The increasing prevalence of type 2 diabetes depends on a number of factors:
• an increase in the levels of obesity. (Data from the Framingham study show that almost all of the increase in diabetes prevalence in the USA is due to obesity)
• demographic change – half of all people with diabetes are over 65 years old, so as the population ages the prevalence increases
• a fall in the age of onset of type 2 diabetes – people developing diabetes at an earlier age probably reflects weight gain compared with previous generations
• better survival with diabetes because of better control of blood glucose, blood pressure and hyperlipidaemia
• changes in the definition of diabetes, with the diagnosis made at a lower level of fasting
• better detection of diabetes due to opportunistic case-finding, practice-based screening and greater public awareness
• in developing countries, prevalence differs significantly owing to differences in diet, physical exercise and socioeconomic factors – the urban rate is generally assumed to be twice the rural estimate
• for the world as a whole there are more women than men with diabetes. The female excess is pronounced in the developed countries, but in developing countries the numbers are equal
• from 1995 to 2025 the adult population is predicted to increase by 64% and the prevalence of diabetes will increase by 35% (a real increase in the number of diabetic patients of 122%)
• in developed countries there will be an increase in the adult population of 11% with a 27% increase in the prevalence of diabetes
• in developing countries there will be an increase in the adult population of 82% with a 48% increase in the prevalence of diabetes (an increase in the number of diabetic patients of 170%).
Prediction and prevention
• affected first-degree relative – parent or sibling
• ethnicity – high-risk populations
• middle age to elderly (earlier in high-risk ethnic groups)
• glucose intolerance (‘pre-diabetes’, non-diabetic hyperglycaemia)
• obesity (especially visceral adiposity)
• treatment with diabetogenic drugs
• history of gestational diabetes
Metabolic syndrome
There are multiple definitions of the metabolic syndrome. It consists of a clustering of cardiovascular risk factors that include central obesity, hypertension and dyslipidaemia, which are all associated with insulin resistance. The presence of the metabolic syndrome is considered an important risk factor for cardiovascular disease and mortality in non-diabetic subjects and patients with type 2 diabetes. The most recent definition of the metabolic syndrome is the consensus document from the International Diabetes Federation (IDF) (Table 1.10). The IDF metabolic syndrome criteria take into account ethnic differences in body fat distribution. The WHO, National Cholesterol Education Program (NCEP) and the Expert Panel on Detection, Evaluation, and Treatment of High Blood Cholesterol in Adults (Adult Treatment Panel (ATP) III) have each proposed different criteria for the diagnosis.
BP, blood pressure; FPG, fasting plasma glucose; HDL, high-density lipoprotein; TG, triglycerides; OGTT, oral glucose tolerance test.
Source: International Diabetes Federation (2006). Reproduced with permission.
The international diabetes federation (IDF) definition
For a person to be defined as having the metabolic syndrome they must meet the criteria defined in Table 1.10.
Central obesity is most easily measured by waist circumference using the guidelines in Table 1.11, which are sex and ethnic group (not country of residence) specific.
| Country/ethnic group | Waist circumference (cm) | |
|---|---|---|
| Male | Female | |
| Europids | > 94 | > 80 |
| In the USA, the ATP III values (102 cm male; 88 cm female) are likely to continue to be used for clinical purposes | ||
| South Asians | > 90 | > 80 |
| Based on a Chinese, Malay and Asian–Indian population | ||
| Chinese | > 90 | > 80 |
| Japanese | > 90 | > 80 |
| Ethnic South and Central Americans | Use South Asian recommendations until more specific data are available | |
| Sub-Saharan Africans | Use European data until more specific data are available | |
| Eastern Mediterranean and Middle East (Arab) populations | Use European data until more specific data are available | |
ATP, Adult Treatment Panel.
Source: International Diabetes Federation (2006). Reproduced with permission.
• worsen continuously across the spectrum of glucose intolerance
• may be present many years before the diagnosis of type 2 diabetes.
Haemochromatosis (’bronze diabetes’)
Haemochromatosis is characterized by the four main features:
• Increased pigmentation (slate-grey or brownish bronze) is seen in more than 90% of patients; it is often one of the first signs of the disease and may precede other signs by many years. Hyperpigmentation is most evident on sun-exposed skin, particularly the face. There may also be skin thinning and/or ichthyosis-like changes (scaling) with partial loss of body hair (pubic region most affected)
• Enlarged liver occurs in more than 95% of patients and is often accompanied by cirrhosis and liver failure
• Diabetes mellitus, often requiring insulin therapy, is seen in 30–60% of patients
Investigations
• Measurement of serum iron levels has no value in making the diagnosis.
• Transferrin saturation corresponds to the ratio of serum iron and total iron-binding capacity. Similar to iron, it is influenced by liver disease (other than haemochromatosis) and inflammation; therefore, it has limitations in the diagnostic workup.
• Serum ferritin levels raised above 200 μg/L in premenopausal women and 300 μg/L in men and postmenopausal women indicate primary iron overload due to haemochromatosis, especially when associated with high transferrin saturation and evidence of liver disease.
• Genetic testing for the HFE mutation is indicated in patients with evidence of iron overload (e.g. raised transferrin saturation, high serum ferritin levels, excess iron staining or iron concentration on liver biopsy samples) and also in all first-degree relatives of patients with haemochromatosis. This is indicated particularly in patients with known liver disease and evidence of iron overload, even if other causes of liver disease are present.
Management
• Minimize alcohol intake, particularly with meals – alcohol may lead to increased iron absorption and increase the risk of liver disease
• Reduce intake of liver, kidney and red meat – iron absorption from red meat is 20–30% compared with 1–20% for vegetables and grains
• Avoid vitamin supplements or tonics containing iron or vitamin C – vitamin C enhances the absorption of iron from the diet.
• Alcoholic liver disease – patients include those who are heavy drinkers, perhaps of iron-containing fortified wines, and who have cirrhosis. Liver biopsy in these patients may show a modest increase in iron; however, contrary to patients with haemochromatosis, the hepatic iron levels are relatively normal.
• Ineffective erythropoiesis with marrow hyperplasia – patients with hyperplastic erythroid marrow absorb an increased amount of iron to the point where they may have clinical iron overload. Examples include the hereditary sideroblastic anaemias, severe α- and β-thalassaemia, and the myelodysplastic syndrome variants, such as refractory anaemia with ringed sideroblasts (RARS).
• Iron overload associated with chronic anaemia – examples include hereditary spherocytosis and acquired sideroblastic anaemia, where patients have increased effective erythropoiesis and increased iron absorption.
• Multiple transfusions – hypertransfusion is performed in patients with β-thalassaemia major, sickle cell anaemia, refractory aplastic anaemia and myelodysplastic syndrome. Such patients may receive as much as 100 units of red cells.
• Porphyria cutanea tarda (PCT) – this is primarily a skin and liver disease that occurs in familial and sporadic forms. The cause of liver siderosis in sporadic PCT has not been established, but may be related to a mutation in the HFE gene.
Polycystic ovary syndrome (PCOS)
• anovulation – oligomenorrhoea, amenorrhoea (irregular, few, or absent menstrual periods)
• hirsutism – excessive mild symptoms of hyperandrogenism, such as acne or hyperseborrhoea, are frequently seen in adolescent girls and are often associated with irregular menstrual cycles. In most instances, these symptoms are transient and reflect only the immaturity of the hypothalamic–pituitary–ovarian axis during the first years following menarche.
The diagnosis is straightforward using the Rotterdam criteria (Table 1.12), even when the syndrome is associated with a wide range of symptoms.
| In 2003 a consensus workshop sponsored by ESHRE and ASRM in Rotterdam indicated PCOS to be present when 2 of the following 3 criteria are met: |
ESHRE, European Society of Human Reproduction and Embryology; ASRM, American Society for Reproductive Medicine.
History-taking should enquire specifically about:
Investigations should include:
• Gynaecological ultrasonography – in PCOS there is ’follicular arrest’, whereby several follicles develop to a size of 5–7 mm (pre-ovulatory size is 16 mm or more). According to the Rotterdam criteria, 12 or more small follicles (2–9 mm) should be seen in an ovary on ultrasound examination and/or the ovarian volume should be > 10 cm3 on either side.
• Serum (blood) levels of androgens including androstenedione, testosterone and dehydroepiandrosterone sulphate may be raised. The free testosterone level is considered to be the best measure.
• Other blood tests are suggestive but not diagnostic. The ratio of LH : FSH is greater than 1 : 1, as tested on day 3 of the menstrual cycle. This pattern is not specific and is present in less than 50%.
Common assessments for associated conditions or risks include:
• fasting biochemical screen and lipid profile
• frank diabetes can be seen in 65–68% of women with this condition.
For exclusion of other disorders that may cause similar symptoms:
• prolactin to rule out hyperprolactinaemia
• thyroid-stimulating hormone (TSH) to rule out hypothyroidism
• 17-hydroxyprogesterone to rule out 21-hydroxylase deficiency (congenital adrenal hyperplasia).
Women with PCOS are at risk of the following:
• cardiovascular and cerebrovascular disease
• endometrial hyperplasia and increased risk of endometrial cancer. This appears to be due to over-accumulation of the uterine lining and also lack of progesterone, resulting in prolonged stimulation of uterine cells by oestrogen. It is, however, unclear whether this increased risk is directly due to PCOS or to the associated obesity, hyperinsulinaemia and hyperandrogenism
Differential diagnosis
PCOS has been reported in other insulin-resistant situations, such as acromegaly.
Biochemistry of diabetes
Insulin
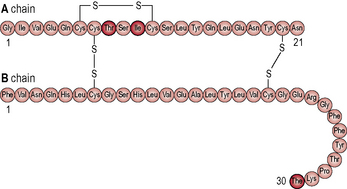
The hormone insulin is a primary regulatory signal in animals, suggesting that the basic mechanism is old and central to animal life (Figs 1.1 & 1.2). β-cells in the islets of Langerhans release insulin in two phases. In the first phase insulin release is triggered rapidly in response to increased blood glucose levels. The second phase is a sustained, slow release of newly formed vesicles that are triggered independently of glucose.
When the glucose level comes down to the usual physiological value, insulin release from the β-cells slows or stops. If blood glucose levels drop lower, release of hyperglycaemic hormones (most prominently glucagon from islet of Langerhans’ α-cells) forces release of glucose into the blood from cellular stores, primarily liver cell stores of glycogen. By increasing blood glucose levels, the hyperglycaemic hormones prevent or correct life-threatening hypoglycaemia. Release of insulin is strongly inhibited by the stress hormone noradrenaline (norepinephrine), leading to increased blood glucose levels during stress. The many roles of insulin are summarized in Table 1.13.
Glucagon
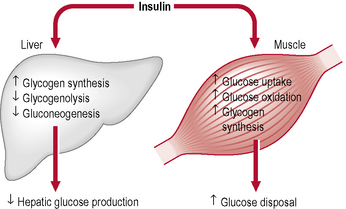
Glucagon is an important hormone involved in carbohydrate metabolism. Glucagon is synthesized and secreted from the α-cells of the islets of Langerhans. It is released when blood glucose levels start to fall too low, causing the liver to convert stored glycogen into glucose and release it into the bloodstream, raising blood glucose levels and ultimately preventing the development of hypoglycaemia. The action of glucagon is thus opposite to that of insulin. However, glucagon also stimulates the release of insulin, so that newly available glucose in the bloodstream can be taken up and used by insulin-dependent tissues (Tables 1.14 & 1.15).
Table 1.14 Causes of increased and decreased secretion/inhibition of glucagon
| Increased secretion of glucagon is caused by: | Decreased secretion/inhibition of glucagon is caused by: |
|---|---|
Table 1.15 Metabolic actions of insulin and glucagon
| Insulin | Glucagon | |
|---|---|---|
| Fatty acid uptake and release in fat | Stimulates synthesis TG from FFA; inhibits release of FFA from TG | Stimulates release of FFA from TG |
| Liver glycogen | Increases synthesis and thereby glucose uptake and storage | Stimulates glycogenolysis and glucose release |
| Liver gluconeogenesis | Inhibits; saves amino acids | Stimulates; glucose synthesized and released |
| Glucose uptake, skeletal muscle | Stimulates uptake, storage as glycogen and use in energy metabolism | No receptors, no effect |
| Glycogen, skeletal muscle | Stimulates synthesis | No receptors, no effect |
| Amino acid uptake | Stimulates and is necessary for protein synthesis | No receptors, no effect |
| Brain (hypothalamus) | Reduces hunger through hypothalamic regulation | No effect |
FFA, free fatty acids; TG, triglycerides.
The insulin receptor
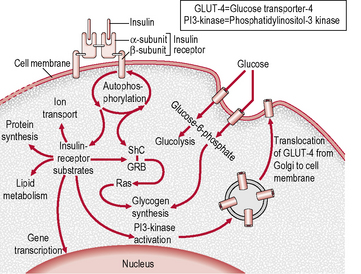
The insulin receptor is a transmembrane receptor belonging to the large class of tyrosine kinase receptors (Fig. 1.3). Two α-subunits and two β-subunits make up the receptor. The β-subunits pass through the cellular membrane and are linked by disulphide bonds. Receptor activity is mediated by tyrosines phosphorylation within the cell. The ‘substrate’ protein for insulin receptor substrate (IRS)-1 is phosphorylated, leading to an increase in the high-affinity glucose transporter (GLUT-4) molecules on the outer membrane of insulin-responsive tissues. These tissues include muscle cells, adipose tissue and hepatocytes. This process leads to an increase in the uptake of glucose from blood into these tissues and a cascade of post-receptor signalling events still not fully elucidated. GLUT-4 is transported from cellular vesicles to the cell surface, where it mediates the transport of glucose into the cell. Other isoforms of glucose transporters (e.g. GLUT-1 at the blood–brain and blood–retinal barriers, GLUT-2 in islet β-cells) do not require insulin to transfer glucose into cells.
• Receptor defects – there may be a reduced number of insulin receptors or a reduction in their affinity for insulin. This may occur in response to chronic hyperinsulinaemia (so-called downregulation). Lesser degrees of obesity and glucose intolerance are associated with receptor defects that are largely reversible with treatment. Inherited severe receptor defects are rare.
• Post-receptor defects – defects in intracellular events distal to the binding of insulin account for insulin resistance in most patients with type 2 diabetes; the maximal response to insulin is impaired and is usually only partially reversible, even with insulin-sensitizing drugs. The precise nature of these defects has not yet been identified.
Lipolysis
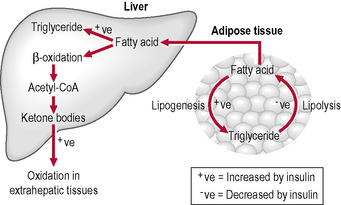
Lipolysis is the hydrolysis of lipids (Fig. 1.4). Metabolically it is the breakdown of triglycerides into free fatty acids within cells. When fats are broken down for energy, the process is known asβ-oxidation: ketones are produced and are found in large quantities in ketosis (a state in metabolism occurring when the liver converts fat into fatty acids and ketone bodies, which can be used by the body for energy). Lipolysis testing strips such as Ketostix are used to recognize urinary ketones.
Lipotoxicity
Appendix 1.1: Prevalence estimates of diabetes, 2011–2030
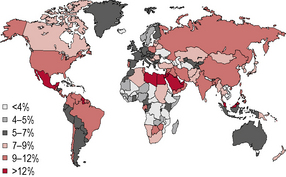
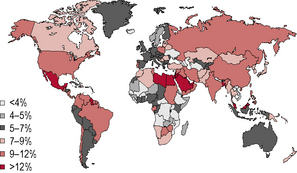
Figure 1.5 Prevalence (%) estimates of diabetes (20–79 years), 2010.
(Source: International Diabetes Federation/IDF Diabetes Atlas, 5th edn. IDF, Brussels. © International Diabetes Federation 2011. Reproduced with permission.)