Cancer genomics and evolution
William P. D. Hendricks, PhD  Aleksandar Sekulic, MD, PhD
  Alan H. Bryce, MD
  Muhammed Murtaza, MBBS, PhD
  Pilar Ramos, PhD
  Jeffrey M. Trent, PhD
Overview
Over 100 years ago, the Nobel Prize in Physiology or Medicine was given to Paul Ehrlich for postulating that “magic bullets” could specifically target and kill cells such as cancer cells based on their unique molecular features. The completed Human Genome Project and the cancer genomics revolution have now mapped the specific genetic changes underlying unique features of many common malignancies. However, although cancer has long been recognized to be heterogeneous in its clinical presentation, course, and pathology, we now recognize that it is far more molecularly heterogeneous than anticipated and that such variability will require an individualized approach to patient care. Rather than a single magic bullet, we will need an arsenal and this arsenal will require precise delivery. While inter- and intratumoral genomic heterogeneity present significant challenges to cancer management and drug discovery, a number of developments foster hope for accelerated progress in the war on cancer. First, our catalog of genomic targets underlying diverse cancers is rapidly growing. Second, we are beginning to understand how diverse mutations converge on a small number of druggable pathways. Third, we continue to develop drugs and biologic agents (e.g., immune checkpoint inhibitors) that target an increasingly wide array of genomic subtypes of cancer. Finally, advances in next-generation sequencing technologies now enable far earlier detection of disease recurrence than ever before. This chapter will focus on these developments and how their integration is aiding in the precise delivery of “magic bullets.”
Precis
Cancer is a genetic disease in which the stepwise accumulation of oncogene and tumor suppressor gene (TSG) mutations in clonally expanding cell populations drives malignant transformation. Throughout the twentieth century, overwhelming evidence steadily accumulated in support of this model while a growing understanding of the mutations underlying cancer subtypes helped to guide innovation in clinical cancer management. The genomics revolution begun in the twenty-first century has now transformed our understanding of cancer by generating exhaustive catalogs of cancer-driving mutations and identifying the great genomic diversity existing between and within individual tumors. These data are enabling targeted drug development, genomics-guided clinical management, and new approaches to early disease detection. Yet, gaps nonetheless remain in our knowledge of the causative mutations underlying some cancers, in our understanding of the biology of the mutations we have identified, in developing drugs capable of targeting many of these diverse mutations, and in fending off the inevitable emergence of drug resistance. In this chapter, we review the history and methods of cancer genetics and genomics, summarize current knowledge of the spectrum of mutations in cancers, discuss emerging concepts in cancer evolution and genomic heterogeneity, and present a case study on the clinical impact of melanoma genomics.
Introduction
As detailed in the previous chapters, cancer is a genetic disease resulting from the stepwise accumulation of mutations that confer upon cells a selective growth advantage.1 Such mutations alter the birth and death rate as well as the genomic stability of cells as they undergo waves of clonal expansion. With the accumulation of mutations in cancer genes, cell populations acquire increasingly malignant phenotypes in successive generations. These hallmark cancer phenotypes include sustained proliferation, evasion of growth suppression, evasion of the immune system, promotion of inflammation, activation of invasion and metastasis, induction of genomic instability, immortal replication, induction of angiogenesis, deregulation of cellular energetics, and resistance to cell death.2 Cancer genes in which mutation confers a growth advantage are classified as oncogenes or TSGs. Oncogenes, when activated through mutation in recurrent hotspots, drive constitutive activation of cell signaling pathways accelerating the cell birth rate. TSGs, when mutationally inactivated, are no longer able to promote cell death and thereby decrease the cell death rate. This model has been well characterized in colorectal cancer in which mutations in the APC tumor suppressor have been shown in most cases to drive adenoma formation. Additional mutations in cancer genes comprising proliferative, cell cycle, and apoptosis pathways then result in the formation of malignant tumors capable of invasion and metastasis.3, 4 Multiple other cancers have also been shown to follow this model, although we now know that there are many disparate evolutionary paths to malignancy even within the same cancer type (Figure 1).
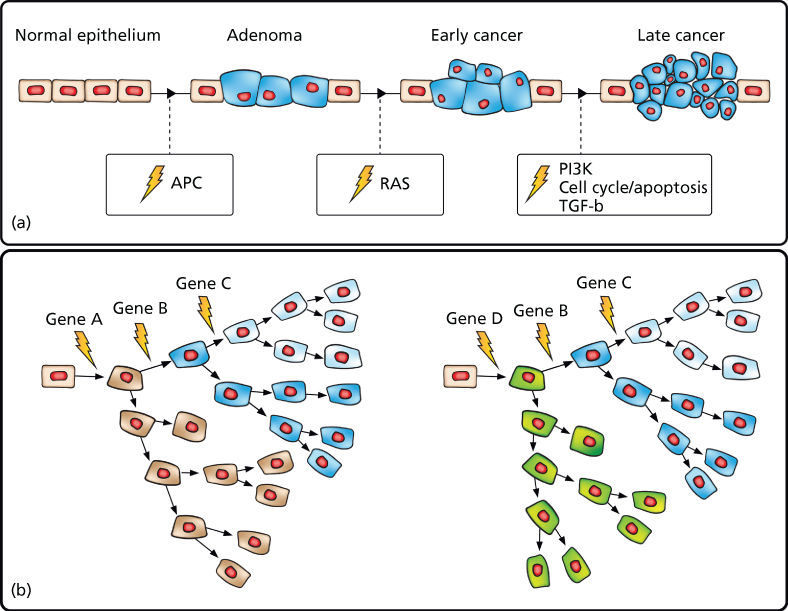
Figure 1 Cancer results from the stepwise accumulation of diverse, branching mutations. (a) “Vogelgram” model of progressive development of colorectal cancer.3 Inactivation of the tumor suppressor APC is commonly observed in colorectal cancer precursor lesions. Subsequent mutational activation of the RAS oncogene is associated with transition from early adenoma to early cancer. Progressive accumulation of molecular alterations eventually leads to a malignant tumor that can invade the basement membrane and metastasize to lymph nodes and distant organs. (b) Expanded model depicting disparate cancer-initiating mutations as well as stepwise branching evolution in which cells accumulate secondary mutations followed by clonal expansion leading to both inter- and intratumoral heterogeneity.
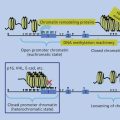
While some mutations in cancer genes occur in the germ line and are heritable, the majority (90%) arise sporadically in somatic tissues over an individual’s lifetime (i.e., they are tumor specific) owing to replication error, genotoxic stress, and/or environmental damage.5 These mutations may result from subtle sequence alterations (single-base substitutions and insertions or deletions of one or a few bases), changes in chromosome copy number (amplification, deletion, chromosome loss, or duplication), or changes in chromosome structure (inter- and intrachromosomal translocation, inversion, or other types of rearrangement). For the remainder of this chapter, we will refer to these alterations as somatic single nucleotide variants (SNVs), copy number variants (CNVs), or structural variants (SVs). Classic examples of SNVs, CNVs, and SVs are shown in Figure 2 and include an activating missense SNV in NRAS (one of the most commonly mutated oncogenes), an inactivating homozygous deletion CNV in one of the most commonly inactivated tumor suppressors TP53, and an activating translocation SV involving BCR and ABL. Epigenomic modifications of cancer genes can also significantly alter gene function. These modifications of DNA, while not altering the DNA sequence itself, can include DNA methylation changes, chromatin modifications, or noncoding RNA-dependent gene regulation that may be heritable and play a role in tumorigenesis. This increasingly important area of study will be discussed in other chapters. We will focus here on DNA sequence-altering mutations.6–9 In this chapter, we use specific examples to highlight the state of cancer genomics knowledge by describing current methods in genomic analysis, compiling results from landmark cancer genomic studies, and assessing the role of cancer evolution in determining its clinical management. We then conclude with a detailed case study of melanoma genomics, evolution, and genomics-guided medicine.
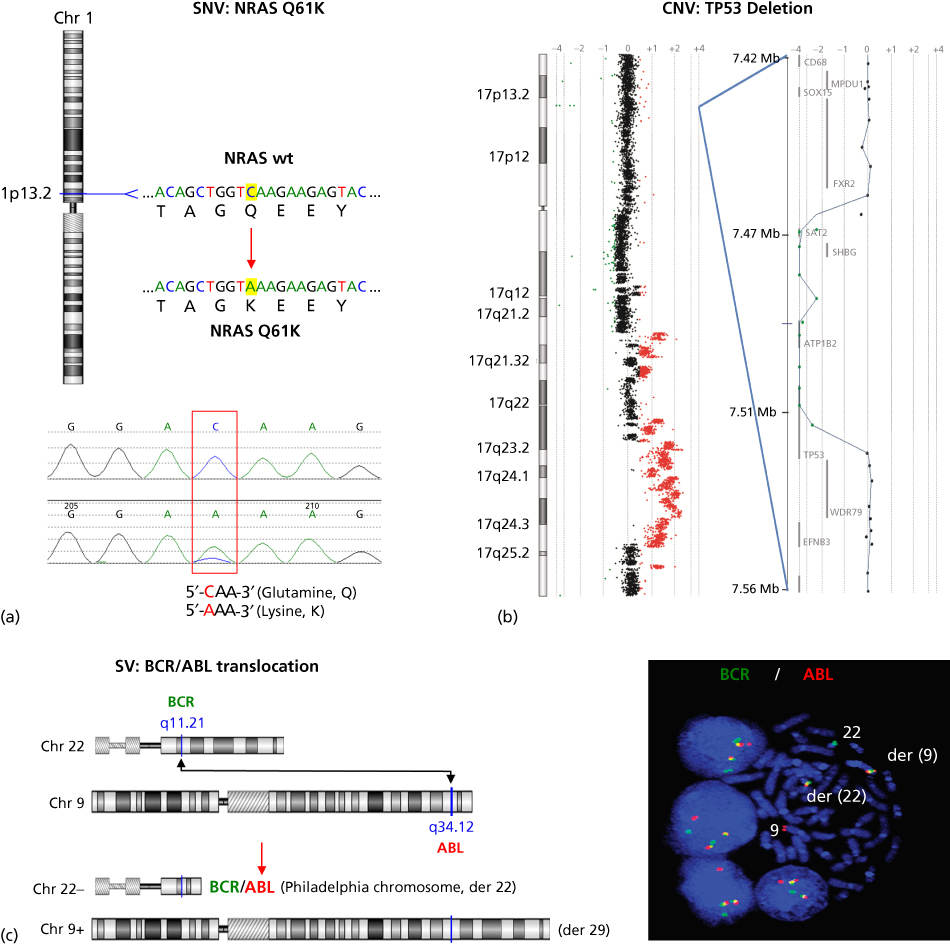
Figure 2 Examples of cancer mutation types. (a) The NRAS oncogene, located on chromosome 1, is commonly mutationally activated in diverse cancers. A single nucleotide variant (SNV) results in a codon alteration and substitution of lysine (K) for glutamine (Q) at amino acid 61—Q61K (top figure). Shown below is the chromatogram from Sanger sequencing analysis of a tumor sample harboring the NRAS Q61K mutation. (b) CGH log2 ratio data are plotted for chromosome 17 (left), as well as a focal region of homozygous deletion with a breakpoint within the TP53 tumor suppressor (right). Regions of DNA copy loss are plotted to the left of the axis and regions of gain are plotted to the right. Individual log2 ratio data (dots) and log2 ratio moving average (line) are shown. (c) Schematic of the DNA translocation that occurs between the genes BCR and ABL, leading to the formation of the BCR-ABL gene fusion known as the Philadelphia chromosome (left). Shown on the right is interphase and metaphase FISH detection of the t(9;22) BCR-ABL gene fusion using fluorescently labeled genomic probes for BCR (green) and ABL (red). Note that the fusion of BCR and ABL probes results in a yellow signal indicating colocalization of the red and green probes as a result of the t(9;22).
Source: The BCR-ABL micrograph is courtesy of Dr. Susana Raimondi of St. Jude Children’s Research Hospital.
The history and methods of cancer genomics
The early history of cancer genetics
The elucidation of cancer’s genetic etiology and breadth of its diversity has paralleled seminal advances in genetics and genetic technology (Figure 3a). Many landmark studies in the late nineteenth and early twentieth century laid the groundwork for cancer genomics—development of the theory of evolution by natural selection,10 discovery of heritable biological units,11 identification of chromosomes,12 chromosomal heredity13, 14 and chromosomal genes,15 and modern evolutionary synthesis linking biology, genetics, and evolutionary theory.16 The subsequent discovery of DNA’s structure then provided a framework for understanding the genetic code and the mechanism for molecular transmission of genetic information.17 Meanwhile, reports of heritable breast and colorectal cancers had arisen18 and cancer was increasingly understood to be able to be caused by chemical agents such as coal tar19 and cigarette smoke,20 physical agents such as radiation,21 and biological agents such as viruses.22 Discovery that these carcinogenic agents were also mutagenic drove speculation that cancer was a disease of mutation. Ultimately, although cancer had been suggested by some to be a chromosomal disease or a disease of mutation, the concept of cancer as a genetic disease did not gain traction until later in the twentieth century when cytogenetic and sequencing technology alongside experimental transformation of normal cell lines with oncogenes enabled assessment of cancer gene mutations at the molecular level and establishment of their causal role in tumorigenesis. Some of these landmark studies are shown in Figure 3a.
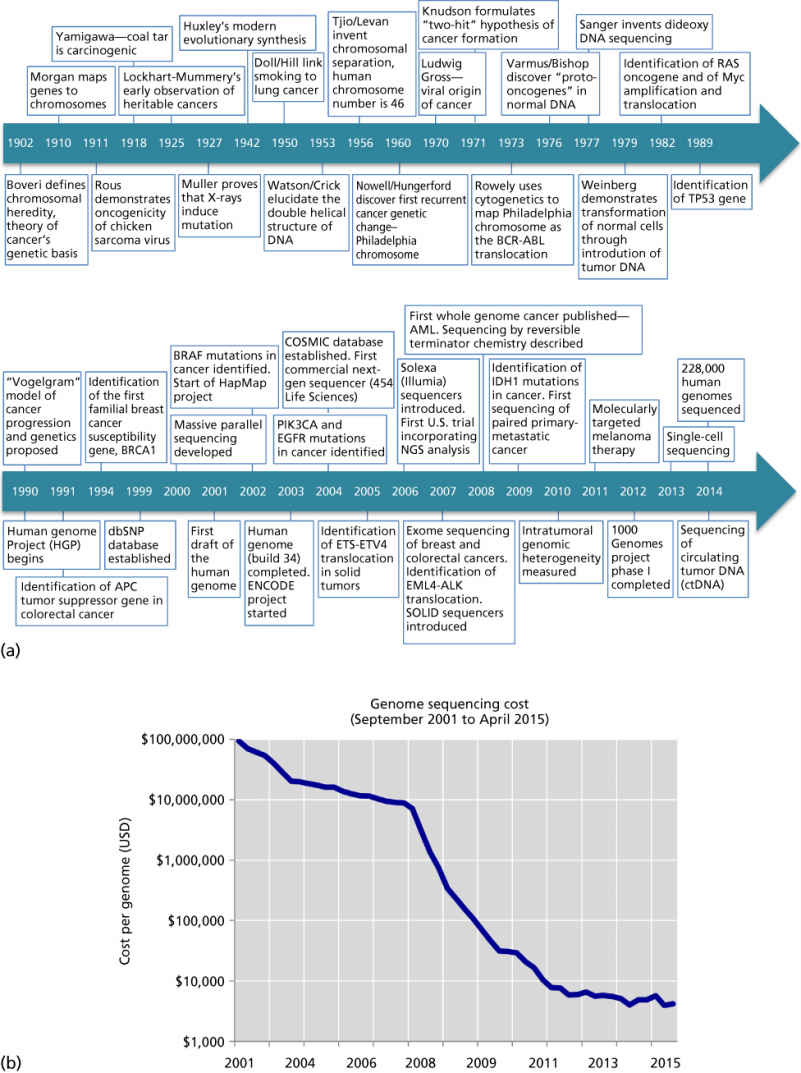
Figure 3 The history of cancer genomics. (a) Timeline of landmark studies in cancer genetics and genomics from Boveri’s formulation of the chromosomally aberrant nature of cancer in 1902 to the advent of 228,000 human genomes sequenced in 2014. (b) Cost of sequencing a 3000 Mb genome (i.e., the size of the human genome) over time.
Source: Data from the NHGRI Genome Sequencing Program (Wetterstrand KA; see http://www.genome.gov/sequencingcosts/).
Molecular cytogenetics: Identification of recurrent chromosomal alterations in cancer
Mid-twentieth century developments in the field of cytogenetics such as chromosome staining in fixed leukocytes from peripheral blood finally enabled empirical observation of the chromosomal complement of a cell.23, 24 Using this approach, Nowell was the first to discover a specific recurrent genetic change associated with a cancer type—the “Philadelphia chromosome” fragment occurring in nearly all evaluated cases of chronic myelogenous leukemia (CML).25 Over a decade later, Rowley then used chromosome banding to map the components of this fragment, determining the Philadelphia chromosome to be a balanced reciprocal translocation between chromosomes 9 and 22.26, 27 These discoveries drove a search for recurrent structural aberrations both within and across cancer types. They led to identification of characteristic translocations in sarcomas, leukemias, and lymphomas. However, most carcinomas were found to possess few recurrent alterations, instead displaying great variety in the number and type of chromosome aberrations.28
After Nowell and Rowley’s discoveries, rapid innovation in chromosomal banding and spectral karyotyping (SKY) allowed progressively detailed views of chromosome aberrations in cancer cells using techniques based on fluorescence in situ hybridization (FISH), which relies on fluorescent DNA probes that hybridize to specific chromosomal regions.29–38 Approaches for genome-wide cytogenetic analysis have also been developed including SKY,29 multiplex-fluorescence in situ hybridization (M-FISH),39 chromosome microdissection,38 and comparative genomic hybridization (CGH).40 CGH is a particularly powerful fluorescent molecular cytogenetic technique for screening genome-wide chromosomal copy number changes in tumor genomes.
Novel approaches to printing nucleic acids on slides (microarrays) soon revolutionized molecular cytogenetics by reducing cost and increasing throughput. Array comparative genomic hybridization (aCGH) originally involved spotting large probes (large-insert clones or artificial chromosomes)41, 42 onto slides in intervals (1–3 Mb resolution) across chromosomal regions. Now, high-resolution genome-wide platforms consisting of small, customizable oligonucleotide probes43, 44 have demonstrated increased throughput and sensitivity in characterizing cancers such as breast,45–47 melanoma,48–50 B-cell lymphoma,51, 52 and many others. Similarly, oligonucleotide arrays designed to genotype thousands of single nucleotide polymorphisms (SNPs) are useful for characterizing tumor genome complexity with rapid genotyping of over millions of SNPs now possible (Affymetrix, Illumina). Similar to CGH arrays, SNP arrays quantitate locus-specific hybridization signal and can be used to estimate copy number or loss of heterozygosity (LOH).53–55 Notable cancer studies incorporating SNP arrays include genotyping of the NCI-60 cell line panel56 as well as lung cancer,57 AML,55, 58 neuroblastoma,59 melanoma,56, 60, 61 basal cell carcinoma,54 breast cancer,62 colorectal cancer,62–64 glioblastoma,65, 66 and pancreatic cancer.67
Both SVs and CNVs can be characterized using the tools of molecular cytogenetics and cytogenomics. Translocations are some of the most common SVs observed in cancer and, as in the case of the Philadelphia Chromosome in CML, are signature aberrations for many liquid cancers and sarcomas. They involve the movement of a chromosomal segment from one position to another, either within the same chromosome (intrachromosomal) or a different chromosome (interchromosomal). Other types of SV include chromosomal deletions, duplications, inversions, insertions, rings, and isochromosomes. These SVs may result from errors in double-stranded break (DSB) repair or other means of intra- or interchromosomal recombination.68 Translocations and other SVs can either activate oncogenes (such as when the ABL tyrosine kinase is constitutively activated by fusion with the BCR gene) or inactivate TSGs (such as when translocations involving the TP53 tumor suppressor interrupt the gene and lead to loss of function). CNVs involving a gain or loss of an entire chromosome are some of the simplest and most common chromosomal aberrations. They result from defective chromosomal segregation. The functional consequence of CNVs can be difficult to establish because the aberrations may extend over tens of thousands of megabases and may affect hundreds to thousands of genes. It has been easier to establish the cancer relevance of more limited regions of chromosomal gain and loss, created by amplification or deletion, as these smaller aberrations have been shown to alter the dosage of known oncogenes or TSGs. Classic examples of oncogene amplification in solid tumors discovered through molecular cytogenetics include ERBB2 in breast cancers and MYC in a variety of tumor types, while loss of specific regions of the genome is often associated with loss of TSGs such as TP53, RB1, PTEN, and CDKN2A. Such deletions of TSGs are critical for promotion of tumorigenesis both in cases of heritable cancers in which germline mutation of a single TSG allele must be coupled with loss of the wild-type allele as well as in sporadic cancers in which both alleles must be inactivated.
Molecular genetics: Identification of recurrent sequence alterations in cancer
While some molecular cytogenetic techniques are capable of detecting chromosomal breakpoints at base pair resolution, advances in molecular genetics were required to allow detection of subtle sequence changes in DNA itself. These advances were enabled by developments in molecular cloning and invention of the polymerase chain reaction (PCR) capable of generating the millions of DNA copies necessary for detection of these mutations.69 Coupled with the Sanger sequencing method based on dideoxynucleotide chain termination and agarose gel electrophoresis,70 progressive advances in this methodology, including fluorescently labeled nucleotides, capillary electrophoresis, paired-end sequencing, shotgun sequencing, and improved laboratory automation have allowed scaling to sequence entire genomes. This technology enabled the Human Genome Project (HGP), launched in 1990 as a $3 billion dollar publicly funded international collaboration. The rough draft of the human genome, covering 94% of the genome, was published in 200171, 72 with the complete draft finished ahead of schedule in 2003.73 In addition to establishing genome-wide ground truth for the locations, organization, and sequences of all human genes, the technical and informatic lessons learned in the course of this project made possible the first ambitious cancer mutation screens on the level of entire gene families74–77 and the majority of the protein-coding genome.62, 65–67 Nonetheless, genome sequencing projects using Sanger-based sequencing continued to be expensive and logistically challenging and thereby limited the application of this approach toward large-scale characterization of cancer genomes until the advent of massively parallel sequencing.
Gene expression microarrays: Cancer signatures and pathways
Microarrays such as those employed in aCGH studies were originally developed for high-throughput gene expression studies. Complementary DNA (cDNA formed from reverse transcription of RNA) and later oligonucleotide microarrays were implemented in high-throughput quantitation of mRNA transcripts. Advances in this technology paralleled improvements in automated Sanger sequencing in the 1990s and the turn of the millennium. They provided some of the first insights into gene signatures and pathways correlating to specific cancer subtypes. A parallel method, serial analysis of gene expression (SAGE) was developed to enable high-throughput digital quantitation of transcripts.78 While originally designed to assay the expression of individual genes, gene expression profiling methods were later adapted to profile and map global transcription on the exon and genome levels,79 as well as to profile the expression of mature human micro-RNAs (miRNAs).80 Gene expression patterns have been widely used to subclassify cancers into homogeneous entities not easily discernible using traditional histopathologic or cytogenetic techniques, for instance, in diffuse large B-cell lymphoma (DLBCL),81, 82 lung cancer,83 melanoma,84 and breast cancer.85, 86 In some instances, subgroups have been shown to represent distinct disease states responding differently to standard therapies. Gene expression profiles have also been widely mined to specifically identify sets of genes predictive of disease progression, response to therapy, or metastasis,87–89 as well as the presence of specific recurrent cytogenetic abnormalities,90–92 or gene mutations.93–96 Although advances in massively parallel sequencing have largely supplanted microarrays in sensitivity and robustness, if not cost and clinical readiness, gene expression profiling continues to play a significant role in cancer biology and medicine. In fact, commercially available clinical tests based on microarray signatures (OncoType DX and MammaPrint) are available for breast cancer profiling.
Massively parallel sequencing: Charting cancer genome landscapes
Explosive growth in our understanding of cancer genomics has been built on the backbone of the advances that emerged from the completion of the human genome at the turn of the twenty-first century. However, although these advances had driven the cost of one genome down from an estimated $1 billion to the $1 million mark at the time of the HGP’s completion, this extraordinary cost nonetheless held back large-scale genomic studies.97 Thus, the National Human Genome Research Institute initiated a $70 million sequencing technology program intended to drive the price down to the $1000 mark. The cost of a human genome sequence now lies slightly below $2000 and is steadily approaching $1000 (Figure 3b).
The quest for the $1000 genome required fundamental rethinking of the approach to DNA sequencing. Sanger sequencing, even in its most expert execution, faced insurmountable bottlenecks including (1) the need for molecular cloning steps and/or individual PCR reactions to generate sequencing templates and (2) every sequencing reaction can only accommodate a relatively small genomic region. Therefore, cloning/amplifying and sequencing many regions, even when run in parallel in multiwell plates, requires large amounts of materials, equipment, and analysis time. The paradigm shift in sequencing cost and throughput was brought about by the invention of approaches that allowed generation of sequencing templates without cloning or individual PCR reactions, immobilization of entire sequencing libraries in a single reaction chamber, and massively parallel sequencing of millions of templates in that chamber. The ability of this approach to collect data on clonal populations derived from single DNA molecules additionally provides great power for detection of rare variants from heterogeneous tumor samples. These rapid, accurate, and inexpensive approaches are also referred to as next-generation sequencing (NGS).
Key inventions in the 1990s and early 2000s such as sequencing-by-synthesis, pyrosequencing, colony sequencing, and emulsion PCR enabled development of the first NGS platforms.98–101 The first such platform was developed by Lynx Therapeutics (later acquired by Solexa) in 2000, although it did not achieve widespread adoption.102 454 Life Sciences offered the first commercially available system—the 454 FLX Pyrosequencer—in 2004,103 followed by the Solexa (now Illumina) Genome Analyzer in 2006, and the Supported Oligonucleotide Ligation and Detection (SOLiD) System from Applied Biosystems in 2007 that also incorporated polony sequencing.104, 105 The Solexa system was used in 2008 to sequence James Watson’s genome within a single laboratory in only 2 months.106 These platforms at last made the possibility of sequencing and assembling multiple cancer genomes a reality as evidenced by the characterization of genome-wide SVs in two lung cancer genomes.107 This study utilized a paired-end approach, demonstrating strikingly complex genomic rearrangements including those resulting in previously unreported fusion transcripts. Importantly, this study also demonstrated that DNA copy number can be estimated by the relative local abundance of genomic fragments sequenced, providing sensitivity comparable to aCGH platforms while at the same time providing DNA sequence information. Massively parallel sequencing methods have now dramatically decreased the cost of sequencing while greatly increasing throughput. Presently, sequencing of 500 billion bases (e.g., sequencing the equivalent of 156 human genomes or 156X average genome coverage) within a single 6-day commercial instrument run is standard, with throughput still steadily increasing.
Many massively parallel sequencing platforms exist today and are reviewed in more detail elsewhere.108 Table 1 provides an overview of some of the most common platforms in use today. They have been adapted to a variety of purposes ranging from diverse DNA sequence, copy number, and structural analyses to transcriptomics and epigenomics. DNA sequencing applications include de novo sequencing, such as the first such application in determining the previously unknown genomic sequence of Acinetobacter baumannii.109 In addition, resequencing of human genomes is performed in order to characterize normal variation or variation in specific disease states such as cancer. Resequencing is undertaken by mapping NGS sequencing reads to the reference genome and identifying differences between the sample and reference.65 Of course, it is not always necessary or informative to assess whole genomes, and thus, a number of target-enrichment strategies have been conceived that enable more cost-effective and focused analyses. The first of these—direct genomic selection—was based on hybridizing defined genomic regions to biotinylated BACs and capturing these sequences on streptavidin beads before sequencing.110 New enrichment methods such as hybridization-based capture (using oligonucleotides either in solution or on microarrays), highly multiplexed PCR, and microdroplet PCR are common.111–114 A relatively small fraction of the human genome has been functionally characterized, and therefore, it is often most expedient to assess the 1% of the genome containing coding regions (all exons—the exome). Thus, a number of commercially available human exome and other targeted capture kits (such as panels of common cancer genes) are available. This ability to target specific genes to enable rapid, accurate, affordable sequencing is aiding not only in biological discovery but also in clinical laboratory testing by enabling practical complex testing.
Table 1 Massively parallel sequencing platforms
| Company | System platforma | Latest release | Template preparation | Sequencing chemistry | Maximum read length | Bases per run (Gb) | Accuracy | Run time | Application |
| Illumina | Illumina HiSeq 4000 | 2015 | Emulsion PCR | Reversible terminator | 150 | 1500 | >99% | <1–3.5 days | WGS, E-S, RNA-S, T-S, C-S, MG |
| Illumina HiSeq 3000 | 2015 | Emulsion PCR | Reversible terminator | 150 | 750 | >99% | <1–3.5 days | WGS, E-S, RNA-S, T-S, C-S, MG | |
| Illumina HiSeq 2500 | 2014 | Solid-phase | Reversible terminator | 125 | 500 | > 99% | 6 days | WGS, E-S, RNA-S, T-S, C-S, MG, DN-S | |
| Illumina HiSeq X (Ten/Five) | 2014 | Solid-phase | Reversible terminator | 150 | 1800 | >99% | <3 days | WGS | |
| Illumina MiSeq | 2014 | Solid-phase | Reversible terminator | 300 | 15 | >99% | 4 h | E-S, RNA-S, T-S, C-S, DN-S | |
| Illumina NextSeq 500 | 2014 | Solid-phase | Reversible terminator | 150 | 120 | >99% | 30 h | WGS, E-S, RNA-S, T-S, C-S, MG | |
| Life Technologies | IonTorrent Personal Genome Machine | 2014 | Emulsion PCR | Proton detection | 400 | 2 | >99% | 2 h | Microbial WGS, E-S, RNA-S, T-S, C-S, MG |
| IonTorrent Proton | 2014 | Emulsion PCR | Proton detection | 200 | 10 | >99% | 2–4 h | Microbial WGS, E-S, RNA-S, T-S, C-S, MG | |
| SOLiD | 2014 | Emulsion PCR | Sequencing by ligation | 75 | 120 | 99.99% | 8 days | WGS, DN-S, E-S, RNA-S, T-S, C-S, MG | |
| Pacific Biosciences | PacBio RS II | 2014 | Single molecule | Real-time sequencing | 15,000 | 3 | 85% | 20 min | DN-S, T-S |
| Roche | 454 GS Junior | 2014 | Emulsion PCR | Pyro-sequencing | 400 | 0.07 | >99% | 10 h | Microbial DN-S, E-S |
| 454 GS FLX | 2014 | Emulsion PCR | Pyro-sequencing | 700 | 0.7 | 100% | 24 h | Microbial DN-S, E-S |
WGS, whole genome sequencing; E-S, exome sequencing; RNA-S, RNA sequencing; T-S, targeted sequencing; C-S, ChIP-sequencing; MG, MetaGenomics; and DN-S, de novo sequencing.
a Additional versions are available for some models.
Cancer genome landscapes
Landmark cancer genomic studies
Despite commonalities observed within and between individual types of cancer in historic genetic studies, the high-throughput genomic studies of the past decade have provided a much more complex view of cancer. The first large-scale cancer mutation screens implemented high-throughput Sanger sequencing of individual genes such as BRAF in large cohorts115, 116 or focused on gene families such as protein kinases in diverse cancer types.74–77, 117, 118 Notably, such screens have led to the identification of activating BRAF mutations in a large percentage of human melanomas115 and nevi,119 as well as ERBB2 mutations in human breast cancer.118 The first cancer gene panels (110 exons from 12 target genes) were completed in 140 acute myeloid leukemia (AML) samples in 2003.120 This study identified six previously described and, strikingly, seven previously unknown coding mutations in AML genomes. Soon after, results of Sanger-based exome sequencing of 13,023 genes in 11 breast and 11 colorectal cancers were published in 2006.121 This study revealed a surprising total of 189 frequently mutated genes with an average of 90 mutant genes per tumor, although only a subset was thought to be causally related to tumorigenesis or progression (an average of 11 per tumor). In a follow-up analysis of an additional 7000 genes in the same tumors, it was confirmed that a handful of commonly mutated genes (the “mountains” in the genomic landscape) existed among a large number of less frequently mutated “hills”. In 2008, four Sanger-based exome projects additionally characterized over 20,000 genes in glioblastoma multiforme62, 65, 66 and pancreatic cancer.67 Amidst an average of 63 and 47 mutations per pancreatic tumor or glioblastoma, these studies identified novel genes bearing low-frequency mutations such as IDH1 and PIK3R1 mutations in glioblastoma. Strikingly, they uncovered few unknown genes recurrently mutated at high rates. In these and future studies, it was found that the high-frequency mountains had already largely been identified using the low-throughput genetic technologies of the past decades. The growing challenge has since been interpretation and characterization of the many hills. However, these studies all show that multiple genes within core signaling pathways, rather than single genes, tend to be mutated in these cancers, suggesting an avenue for treating tumors based on aberrant pathways instead of individual aberrant genes.
Following these landmark studies, the number, breadth, and size of cancer genome projects rapidly accelerated in keeping with the advent of massively parallel sequencing. The first cancer whole genome sequences generated by massively parallel sequencing were those of two lung cancers published in 2008107 followed shortly by those of individual AML cases published in 2008 and 2009.122, 123 These studies focused on assessment of genome-wide SVs and missense mutations, respectively. The first analysis of paired primary and metastatic tumors enabling genome-wide assessment of evolution was conducted in breast cancer in 2009, identifying both shared and exclusive mutations in each sample.124 The first studies to systematically assess genome-wide mutations of all classes, published in 2010, were conducted in the melanoma cell line COLO-829125 and a small cell lung cancer cell line.126 These studies uncovered an extraordinary mutation burden (over 33,000 mutations in melanoma and 23,000 in lung) and mutational signatures supporting ultraviolet (UV) radiation etiology and tobacco smoke etiology in melanoma and lung, respectively. Discovery has since continued at a rapid pace and, as discussed later, large genomic analyses having been completed in all common cancers, many rare cancers, primary/recurrent/metastatic matched cohorts, and even cancers undergoing treatment.
Large-scale cancer genomic studies have also been powered by national and international consortia. The US National Cancer Institute (NCI) and National Human Genome Research Institute (NHGRI) launched a large collaborative project in 2005, the Cancer Genome Atlas (TCGA; see http://cancergenome.nih.gov/). Using multiple state-of-the-art genomic technologies to comprehensively identify all genomic alterations associated with multiple cancer types, the TCGA effort began with large pilot studies of glioblastoma multiforme65 ovarian cancer,127 and squamous cell lung cancer.128 TCGA studies have since included colorectal,129 breast,130 endometrial,131 AML,132 clear cell renal cell,133 expanded glioblastoma,134 urothelial bladder,135 lung adenocarcinoma,136 gastric,137 chromophobe renal cell,138 papillary thyroid,139 head and neck squamous cell,140 low-grade glioma,141 cutaneous melanoma,142 and a suite of 18 pan-cancer studies.143 Across 34 cancer types, data have been collected from more than 11,000 cases. Similarly ambitious studies have been undertaken by members of the International Cancer Genome Consortium (ICGC; see http://icgc.org)144 launched in 2010 to comprehensively catalog all genomic aberrations associated with at least 50 different cancers. This consortium currently encompasses 55 projects covering 33 cancer types with over 13,000 donors and has produced publications on bisulfite sequencing techniques,145, 146 DLBCL,147 Burkitt lymphoma,148 X chromosome hypermutation,149 signatures of mutational processes,150 and primary CNS lymphoma.151 The ultimate success of these comprehensive, large-scale projects will continue to rapidly advance our understanding of cancer genetics and genomics and will potentially revolutionize our approach to the diagnosis and treatment of cancer.
Cancer genomic data repositories and analysis tools
Data generated by the TCGA, ICGC, and other curated genomic repositories are publicly available. Systematic analysis of these data remains challenging, but improved web-based tools for both novices and experienced bioinformaticians are greatly democratizing cancer genomics research (Table 2). One of the oldest and most comprehensive resources for mining such data is the Catalogue of Somatic Mutations in Cancer (COSMIC; see http://www.sanger.ac.uk/genetics/CGP/cosmic) maintained by the Wellcome Trust Sanger Institute Cancer Genome Project.152 COSMIC is manually curated from publications and therefore entails a broad reach across targeted studies and genome projects (currently more than 20,000). The current build (August 2014) describes over 2 million mutations in more than 1 million samples encompassing 12,000 cancer genomes. In addition to SNVs, it details over 6 million noncoding mutations, 10,000 fusions, 61,000 SVs, 700,000 CNVs, and 60 million expression variants. These data are easily queried using key words or by gene or cancer type. COSMIC also includes more advanced tools that are in some cases linked to other databases. These include a detailed census of all human genes that have been causally linked to tumorigenesis (Cancer Gene Census; see http://www.sanger.ac.uk/genetics/CGP/Census)5, 153 as well as tools to assess mutation signatures and drug sensitivity. Another highly versatile data portal is the cBioPortal for Cancer Genomics maintained by Memorial Sloan-Kettering Cancer Institute.154 This portal primarily contains highly processed Cancer Cell Line Encyclopedia (CCLE) and TCGA data sets but also provides a powerful, intuitive web interface enabling queries by gene or cancer type as well as more advanced analysis through an application programming interface and also integration with R and MATLAB. A similar portal is available for ICGC data (see http://dcc.icgc.org).
Table 2 Cancer genomics databases
| Name | Detail | Link |
| canEvolve | Analysis of mRNA, miRNA, protein expression, and CNV data in 10,000 patient samples from TCGA, GEO, and Array Express | www.canevolve.org |
| canSAR | Integrated analysis of biological, chemical, and pharmacological data from COSMIC, chEMBl, UniProt, BindingDB, Array Express, and STRING | https://cansar.icr.ac.uk |
| cBioPortal | TCGA data portal; graphical visualization and analysis | http://www.cbioportal.org |
| CGAP | Graphical summary and analysis of gene expression; integration of cytogenetic data | http://cgap.nci.nih.gov |
| CGHub | Secure, comprehensive data repository; TCGA, CCLE, and TARGET projects | https://cghub.ucsc.edu |
| CPRG | Integrative analysis tools for cancer research | http://www.broadinstitute.org/software/cprg |
| COSMIC | Largest genomics data repository; manually curated publications and output from large sequencing studies | http://www.sanger.ac.uk/genetics/CGP/cosmic |
| EBI Array Express | Annotated functional genomics data; data generated via microarray and high-throughput sequencing projects | http://www.ebi.ac.uk/microarray-as/ae |
| EGA | Comprehensive data repository; restricted access; ICGC output; SNV and CNV data | https://www.ebi.ac.uk/ega |
| GDAC | Pipelines for genomic analysis; user-friendly interface | http://gdac.broadinstitute.org |
| GEO | Gene expression microarray and functional genomics data repository | http://www.ncbi.nlm.nih.gov/geo |
| ICGC | Visualization tool; genomic, transcriptomic, and epigenomic characterization of 50 tumor types | http://dcc.icgc.org |
| MethylCancer | Methylation database; interprets the correlation of methylation, gene expression, and cancer biology | http://methycancer.psych.ac.cn |
| SomamiR | Archive of experimentally validated somatic mutations in noncoding RNA | http://compbio.uthsc.edu/SomamiR |
| UCSC Cancer Genome Browser | Multipurpose data viewer incorporating multiple data types including clinical information | https://genome-cancer.soe.ucsc.edu |
While the above-mentioned portals enable advanced analysis with only modest bioinformatics training, additional repositories exist for advanced users to access various levels of raw data. The Cancer Genomics Hub (CGHub), hosted by the University of California Santa Cruz (UCSC), is a secure central repository for data generated through the NCI including TCGA, CCLE, and Therapeutically Applicable Research to Generate Effective Treatments (TARGET).155 The European Genome-phenome Archive (see http://ega.crg.eu) similarly collects and distributes sequencing and genotyping data, primarily cancer data emerging from the ICGC. Data repositories and analysis tools are also available for other data types. Cytogenetic aberrations and fusions observed in over 65,000 human tumors have been compiled and are maintained online (The Mitelman Database of Chromosome Aberrations in Cancer at the US National Cancer Institute [NCI] Cancer Genome Anatomy Project [CGAP] Web site: http://cgap.nci.nih.gov).28 Data from numerous gene expression microarray studies are warehoused by multiple entities, including the US National Center for Biotechnology Information (NCBI Gene Expression Omnibus; see http://www.ncbi.nlm.nih.gov/geo/) and the European Bioinformatics Institute (EBI Array Express; see http://www.ebi.ac.uk/microarray-as/ae/). Additional data repositories and web resources are outlined in Table 2.
The vast and varied landscapes of human cancers
Although few new mutational “mountains” have been discovered in the past 10 years, systematic study of cancer genomes has revealed many new “hills” as well as mutational processes and dysregulated pathways. The total mutation burden itself can reflect cancer etiology and have bearing on clinical course. This burden is much more variable than originally anticipated. In some pediatric cancers such as rhabdoid tumors156 and small cell carcinoma of the ovary,157 cases with only a single coding SNV have been discovered, while leukemias such as AML bear a median of nine coding SNVs (Figure 4). Conversely, cancers with mutagenic etiology such as bladder, lung, and melanoma bear high mutation rates with medians of 148, 217, and 254 coding SNVS, respectively, while tumors with mismatch repair defects can contain thousands of coding SNVs. Distinct mutational signatures can also reflect these external and internal mutagenic factors such as enrichment for C > T transition in dipyrimidines as seen in cancers from UV-damaged sites.150 Overall, coding SNVs are generally more common in cancers than coding CNVs and SVs, although broad variability in CNV and SV profiles also exists across cancer types. Thirty-seven percent of cancers experience whole-genome doublings with a quarter of most solid tumor genomes containing large-scale chromosomal variations and 10% containing focal CNVs. Over 140 genomic regions have been found to contain recurrent CNVs, only 38 of which contain known cancer genes.158–160 Most solid tumors also contain dozens of SVs although many of these occur in regions that do not contain genes and are likely passengers. Whole genome sequencing has also recently uncovered “chromothripsis” events, occurring in 2–3% of cancers when errors in chromosome segregation during mitosis lead to shattering of a single or a few chromosomes and massive rearrangement in a single cell generation.161–163
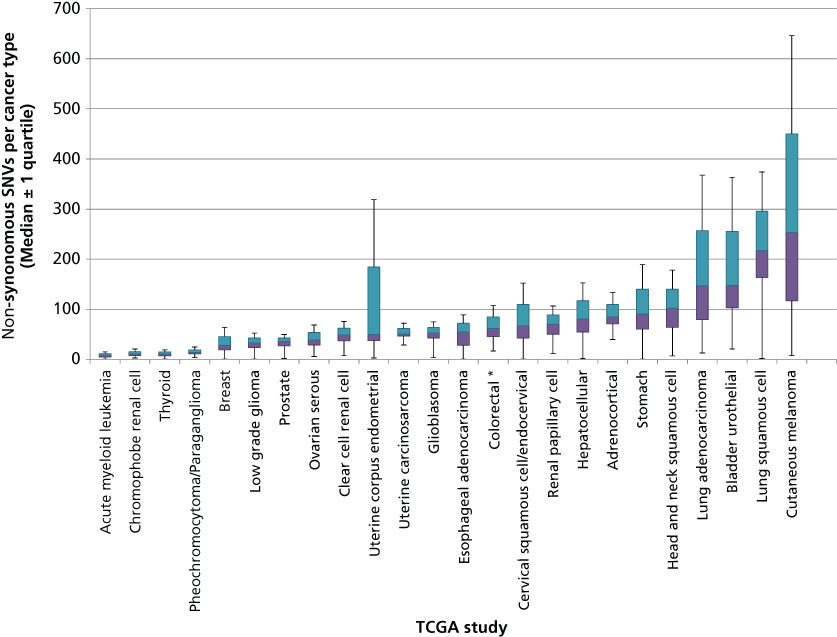
Figure 4 Number of coding single nucleotide variants (SNVs) per tumor type across a selection of human cancers. DNA sequencing data obtained from published TCGA studies were used to calculate the distribution and median number of coding SNVs mutations in each cancer type. Colored bars indicate the 25% and 75% quartiles. Outlier values (values below Q1 − 1.5 × IQR or above Q3 + 1.5 × IQR) are not shown and asterisks represent studies with more than 10% outliers.
In addition to mutagenic etiology, variability in mutation burden is the likely result of mutation timing, patient age, and the number of divisions that have occurred in precursor cells with mutations accumulating in dividing cells over time, although a “punctuated evolution” model has also been proposed.164–166 Ultimately, only a few such mutations can “drive” cancer (driver mutations) insofar as they confer a selective growth advantage on the cells that carry them. Other mutations are “passengers” with no phenotypic effect on cell growth.167 Several methods have been developed to classify mutations as drivers or passengers based on the pattern and frequency with which they arise across cancers,4, 168, 169 but experimental validation is required to confirm the role of these mutations in cancer.
It has been estimated that more than 138 cancer driver genes exist4 with 571 genes causally implicated in cancer catalogued in the Cancer Gene Census (see http://cancer.sanger.ac.uk/census).5 The top 10 most commonly mutated cancer genes are given in Table 3, while cancer genes associated with the most lethal cancers in the United States are given in Table 4. While this vast array of mutations may seem overwhelmingly complex, particularly from the therapeutic perspective, there is nonetheless some hope. For example, dramatic clinical responses are seen with agents targeting mutant proteins in highly complex cancers such as mutant BRAF and ALK in melanoma and lung cancer.194, 195 Further, multiple cancer genes often converge on an individual pathway and may be functionally equivalent. Thus, specific pathways may collectively be subject to genomic aberrations at a frequency far higher than any of their individual gene components. Indeed, most driver genes converge on the hallmark pathways and can ultimately be reduced to those impacting cell differentiation, cell proliferation, cell death, and genomic maintenance.2 Thus, the integration of multiple types of genomic data will clearly be necessary to unravel the complexity of somatic cancer genetics.
Table 3 Ten most commonly mutated oncogenes and tumor suppressor genes (TSG) in the COSMIC database
| Gene | Classificationa | SNVs in COSMIC | Homozygous deletions (TSGs) or amplifications (oncogenes) in COSMICb | Fusions in COSMIC |
| TP53 | TSG | 28,253 | 17 | 1 |
| NPM1 | TSG | 5224 | 1 | 319 |
| CDKN2A | TSG | 4836 | 1046 | 0 |
| APC | TSG | 4351 | 10 | 0 |
| PTEN | TSG | 3296 | 275 | 0 |
| VHL | TSG | 2443 | 2 | 0 |
| TET2 | TSG | 2085 | 3 | 0 |
| NOTCH1 | TSG | 2009 | 12 | 0 |
| NF2 | TSG | 1076 | 12 | 0 |
| CEBPA | TSG | 706 | 3 | 0 |
| JAK2 | Oncogene | 42,963 | 109 | 35 |
| BRAF | Oncogene | 41,637 | 105 | 625 |
| KRAS | Oncogene | 32,021 | 231 | 1 |
| EGFR | Oncogene | 24,189 | 646 | 0 |
| FLT3 | Oncogene | 15,789 | 102 | 0 |
| IDH1 | Oncogene | 8508 | 11 | 0 |
| PIK3CA | Oncogene | 7983 | 425 | 0 |
| KIT | Oncogene | 7413 | 106 | 0 |
| CTNNB1 | Oncogene | 5372 | 12 | 22 |
| NRAS | Oncogene | 4278 | 31 | 0 |
a Oncogene and TSG status were determined by the 20/20 rule4 using sample data in the COSMIC database (see http://www.sanger.ac.uk/genetics/CGP/cosmic/).
b Amplifications shown for samples in which average genome ploidy ≤ 2.7 and total gene copy number ≥ 5 or average genome ploidy > 2.7 and total gene copy number ≥ 9. Homozygous deletions shown for samples in which the average genome ploidy ≤ 2.7 and total gene copy number = 0 or average genome ploidy > 2.7 and total copy number < (average genome ploidy − 2.7).
Table 4 Commonly mutated cancer genes in the deadliest cancers
| Cancera | Familial cancer genes | Common somatically mutated genes | References |
| Breast | BRCA1, BRCA2, PTEN, TP53 | PIK3CA, TP53, MAP3K1, GATA3, MLL3, CDH1, PTEN, ERBB2, MAP2K4, CDKN2A, PTEN, RB1 | 62, 121, 130, 170–172 |
| Colorectal | APC, MSH2, MLH1, MSH6, PMS2, MUTYH, LKB1, SMAD4, BMPR1A, PTEN, KLLN | APC, TP53, KRAS, PIK3CA, FBXW7, SMAD4, TCF7L2, NRAS, ARID1A, SOX9, FAM123B, ERBB2, IGF2, NAV2, TCF7L1 | 62, 121, 129, 173, 174 |
| Liver | HFE, SLC25A13, ABCB11, FAH, HMBS, UROD | TP53, CTNNB1, AXIN1, RPS6KA3, RB1, FAM123A, CDKN2A, MYC, RSPO2, CCND1, FGF19, ARID1A, ARID1B, ARID2, MLL, MLL3 | 175–178 |
| Lung | EGFR, BRAF, KRAS, TP53 | TP53, KRAS, STK11, EGFR, ALK, BRAF, AKT1, DDR2, HER2, MEK1, NRAS, PIK3CA, PTEN, RET, ROS1, EML4, NTRK1, FHIT, FRA3B, FGFR1, HER2 | 57, 75, 116, 118, 126, 128, 136, 179 |
| Pancreatic | BRCA2, PALB2 | KRAS, TP53, CDKN2A, SMAD4, MLL3, TGFRB2, ARID1A, SF3B1, ROBO2, KDM6A, PREX2 | 67, 180–183 |
| Prostate | BRCA2, BRCA1, HOXB13 | EPHB2, ERG, TMPRSS2, PTEN, TP53, SPOP, FOXA1, MED12, NKX3-1 | 166, 184–188 |
| Ovarian | STK11, BRCA1, BRCA2 | FBXW7, AKT2, ERBB2, TGFBR1, TGFBR2, BRAF, KRAS, PIK3CA, PTEN, ARID1A, BRCA1, MMP-1, BRCA1, BRCA2, MLPA, MAPH | 127, 189–192 |
a The seven cancers estimated to cause the greatest number of deaths in the United States in 2015.193
While it seems possible that the majority of cancer genes have now been discovered, new genes are occasionally implicated in cancer, although at low frequency across many cancer types or at high frequency in a rare and previously uncharacterized cancer. However, most cancers require 5–8 driver mutations based on epidemiological studies196 and only 3–6 drivers have been found in most cancers with notable exceptions (such as pediatric cases) in which three or fewer drivers have been discovered.4 Remaining knowledge gaps are likely due to both technical limitations of sequencing technology and study design as well as limitations in our growing understanding of mutations occurring in noncoding regions of DNA or through epigenomic mechanisms. Clearly, the catalogue of cancer-driving mutations is still incomplete and although the maps of cancer genome landscapes have been broadly charted, much work remains to characterize these vast landscapes in detail in order to guide clinical cancer management.
Clinical implications of cancer genome landscapes
Exhaustive information now available from cancer genomics projects has greatly improved our comprehension of the development, progression, and clinical behavior of human neoplasms. These data and the technology used to generate them are also impacting cancer screening, diagnostics, and treatment. As sequencing costs continue to decline, exome- and genome-wide population screening becomes increasingly viable and it is likely that each patient’s personal genome sequence will comprise a key component of their medical record. Such screening may reveal de novo mutations that would otherwise go undiagnosed until disease presentation and the power of this approach will grow exponentially as we continue to connect genetic variants to disease phenotypes. The NIH has acknowledged the importance of this new healthcare approach through the establishment of the Precision Medicine Initiative.197 Targeted Sanger sequencing of small gene panels is already commonly used in familial cancer screening. In cases such as germline BRCA1/2 or MLH1/MSH2 mutations, which dramatically increase lifetime risk for breast/ovarian or colorectal cancer, genomic testing can guide clinical decisions about surveillance and prophylactic surgery. Now, NGS-based sequencing of hundreds of genes can be completed at a similar cost and thereby enable detection of lower penetrance rare variants not detectable with smaller panels. For example, in a study of 141 BRCA1/2-negative patients with a family or personal history of breast cancer, a panel of 40 additional genes identified 16 patients with pathogenic variants in nine genes other than BRCA1/2 such as TP53 and PTEN.198 These findings have shaped new guidelines from the National Comprehensive Cancer Network recommending targeted panels for patients’ breast or ovarian cancer family history who are negative for common hereditary mutations.199 Targeted NGS panels have also shown greater sensitivity and specificity than traditional diagnostic tools in genetic testing of familial cancer genes such as BRCA1/2, TP53, and APC in additional studies.170, 200–202 NGS panels may also facilitate differential diagnosis and patient stratification given that the diagnostic yield of NGS panels, exomes, or even whole genomes has been shown in multiple studies to outperform small Sanger-based panels.203, 204
Cancer genetics discoveries have driven targeted drug development since the first report of a recurrent chromosomal abnormality—the BCR-ABL translocation in CML. The selective tyrosine kinase inhibitor imatinib, designed to target the BCR-ABL chimeric fusion gene and its constitutively active tyrosine kinase protein product in CML, was the first successful targeted therapy.205–207 The paradigm of targeting cancer-specific mutations to vastly improve the therapeutic index of chemotherapy has now been repeated with dramatic success. Examples include expansion of imatinib to PDGFR– and KIT-mutated gastrointestinal stromal tumors (GIST) and hypereosinophilic syndromes208–210; dasatinib and nilotinib in primary and imatinib-resistant CML211–213; trastuzumab, a neutralizing antibody targeted to the Her2/ErbB2 tyrosine kinase receptor whose encoding gene ERBB2 is amplified and overexpressed in 25–30% of breast carcinomas214, 215; sunitinib in renal cell carcinoma, GIST, and pancreatic neuroendocrine tumors216–218; gefitinib and erlotinib with striking efficacy in the 5–10% of lung adenocarcinoma patients with European ancestry and 25–30% of Japanese patients who harbor activating mutations in EGFR219, 220; crizotinib in ALK-rearranged lung cancer221, 222; vismodegib in basal-cell carcinoma bearing hedgehog pathway mutations223; and vemurafenib in BRAF-mutant melanoma.224 Cancer gene mutations have also been associated with innate or acquired resistance to these targeted therapies. For example, amplification of the BCR-ABL gene is common in CML patients resistant to imatinib.205, 225 Preclinical studies and clinical trials are ongoing for numerous novel therapeutic agents directed against genomic targets in cancer in addition to agents capable of circumventing or treating drug-resistant disease.
The fundamental goal of oncology practice is recommendation of the most effective treatment supported by scientific evidence for an individual patient. Genomic data would be expected to provide just such data. However, although the HGP was completed in 2003, genomic medicine’s entrance into the care stream has been painstakingly slow. In 2010, results from one of the first pilot studies using personalized molecular profiling to guide treatment selection in refractory metastatic cancer were published. Despite considerable challenges including the absence of a precedent for the novel trial design, overall patient attrition, and a diverse pharmacopeia, it was found that in 27% of 68 patients, treatment selection guided by molecular profiling (gene expression microarray analysis) resulted in a longer progression-free survival than that during the most recent regimen on which the patient had progressed.226 The next major step in bringing genomic tools to the patient was a novel study combining whole genome sequencing and comprehensive RNA sequencing to individualize treatment of metastatic triple-negative breast cancer (TNBC) patients.227 TNBC is characterized by the absence of expression of estrogen receptor (ER), progesterone receptor (PR), and HER-2. This study identified somatic mutations in the RAS/RAF/MEK and PI3K/AKT/mTOR signaling pathways that have led to clinical trials combining agents targeting MEK and mTOR genes with encouraging results.
New trial designs, such as those above and including adaptive, basket, and umbrella trials, are aimed at extending individualized therapy to all cancer patients. Multiple large academic observational and interventional trials have now appeared in publication228–233 or are ongoing (see http://clinicaltrials.gov). These include adaptive trials such as I-SPY 2 (Investigation of Serial Studies to Predict your therapeutic response with imaging and molecular analysis) in which treatment arms are modified in the course of the study based on patient response.234 Basket trials such as the NCI MATCH trial assign patients with various advanced cancers to treatment baskets based on mutational profiles, then treat with agents matched to their tumor’s mutations.231 Umbrella trials are also ongoing in which multiple drugs are studied in a single disease. For example, the ongoing Stand Up To Cancer and the Melanoma Research Alliance Dream Team Clinical trial is assessing molecularly guided therapy in a single-histology patient population that lacks a universal therapeutic target—non-V600 BRAF metastatic melanoma. In a nontreatment pilot study (now a randomized treatment study), a combination of whole genome and whole transcriptome sequencing was used to identify molecular aberrations matched to an appropriate clinical treatment from a pharmacopeia comprised standard of care, FDA-approved and investigational agents.230 The challenge of returning actionable information during a clinically relevant time period is considerable. This includes patient consent, tumor biopsy, quality DNA/RNA extraction, DNA- and RNA sequencing, data integration, report generation, and tumor board review to formulate a treatment plan (Figure 5). Streamlining this process will be critical to expansion of these tools beyond major academic research centers.
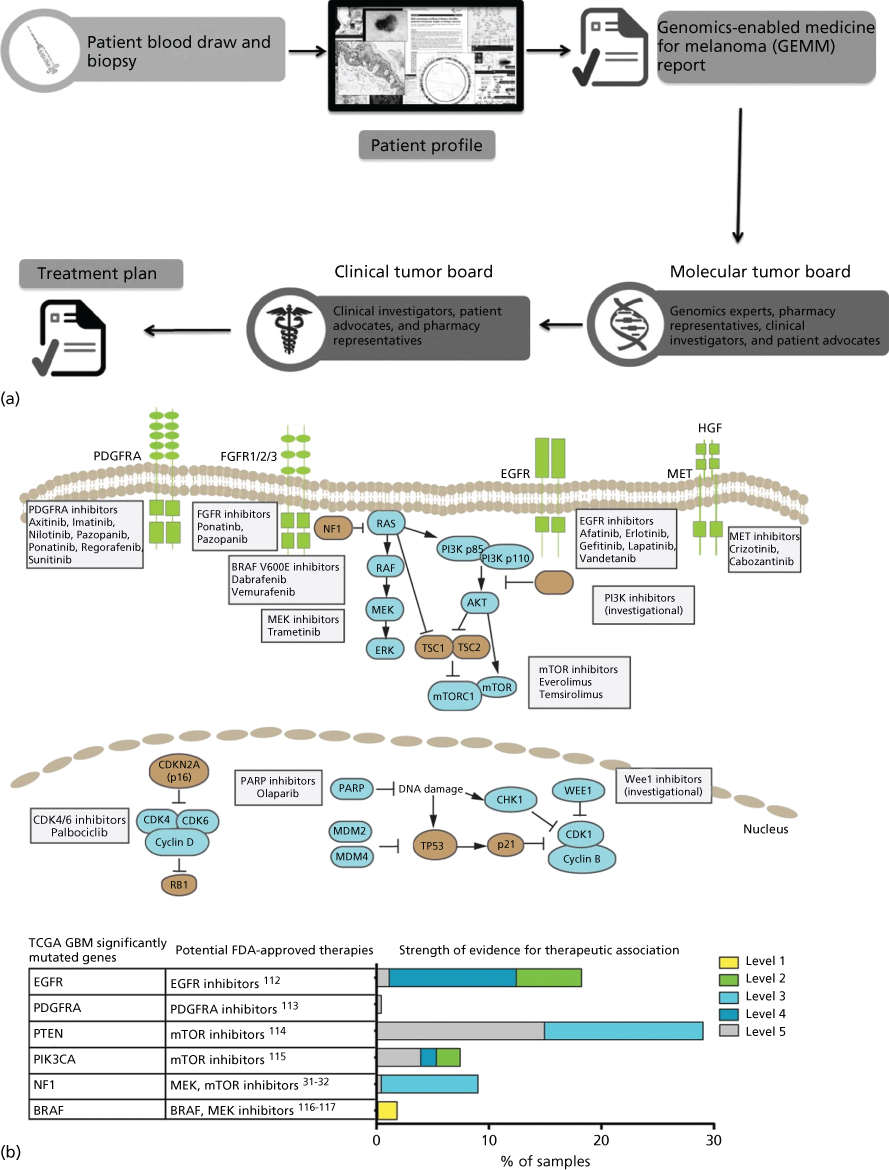
Figure 5 Precision Medicine clinical trials. (a) Process diagram depicting key steps from patient consent through molecular profiling and treatment plan generation. The entire process from biopsy to treatment plan is designed to be performed in less than 5 weeks. Source: From LoRusso, P et al. Pilot Trial of Selecting Molecularly Guided Therapy for Patients with Non-V600 BRAF-Mutant Metastatic Melanoma: Experience of the SU2C/MRA Melanoma Dream Team. Molecular Cancer Therapeutics. 2015 Aug 14(8): 1962–1971. Reprinted with permission. (b) Potential therapeutic implications of significantly mutated genes identified in the primary glioblastoma TCGA data set. (Top) Pathway representation of frequently altered pathways and selected potential therapeutic agents. (Bottom) Table of frequently mutated genes from TCGA mapped to potential FDA-approved therapeutic agents. (Right) Bar chart of level of evidence for the association between an alteration and therapeutic implication.
Source: Prados 2015.228 Reproduced with permission of Oxford University Press.
Large-scale genomic characterization of tumors in the context of clinical trials has allowed identification of predictive biomarkers—recurrent genomic alterations that identify patients most likely to benefit from a particular drug. These provide tremendous clinical value by allowing patient stratification to the most relevant treatment option and have been rapidly commercialized. A broadening array of sequencing tests that may aid in diagnosis and treatment decisions is available to oncologists and their patients. Over 100 academic centers and 50 commercial laboratories have made such tests available. Examples of such commercial tests are provided in Table 5. Although cost is still prohibitive for widespread use, expanded panel-, exome-, or whole genome-based sequencing will continue to transform screening and diagnostics in coming years. However, routine clinical use will not only require further cost reduction but also more comprehensive data supporting genomics-correlated clinical outcomes to illustrate the benefit of such testing and off-label drug use. Accordingly, commercial sequencing laboratories will need to acquire FDA and Medicare approval. These data will ensure that insurance companies will cover these tests. Promising signs already include the addition of procedural terminology codes and a preliminary list of 21 sequencing tests included in the fee schedule of the Centers for Medicare and Medicaid Services. Finally, germline genomic analysis (whether part of hereditary cancer testing or conducted in tumor-matched normal tissue) entails the high likelihood of incidental secondary findings of putatively pathogenic genomic variants with unclear disease association and therefore presents a challenge. Widespread controversy exists over the balance between patient autonomy and the perception that patients knowledge of this information would result in physical or mental harm.235
Table 5 Commercial cancer genome tests
| Provider | Product | Descriptiona |
| Ambry Genetics | Exome Next | Full exome + mitochondrial genome, SNVs, CNVs |
| Ambry Genetics | BRCA1 and BRCA2 gene sequencing | SNVs, CNVs, BRCA1/2 SVs |
| Arup Laboratories | Gastrointestinal hereditary cancer panel | 15 genes + intron/exon junctions, SNVs, CNVs |
| Ashion Analytics | GEM Cancer Panel | 562 genes, tumor/germline, SNVs, CNVs |
| GEM GW | Whole exome, tumor/germline, SNVs, CNVs, SVs | |
| RNA sequencing | RNA, tumor/germline. Gene expression, fusions, alternative splicing, SNVs | |
| Cancer Genetics Incorporated (CGI) | FOCUS:CLL | Seven actionable CLL targets |
| FOCUS:Myeloid | 54 genes, prognostic and therapeutic assessment | |
| Caris | MI Profile | 47 genes, SNVs |
| Foundation Medicine | Foundation One | 236 genes, 47 introns from 19 genes associated with SV. SNVs, CNVs, SVs |
| Foundation One Heme | 405 genes, 31 introns associated with SV, and RNA-seq of 265 genes. SNVs, CNVs, SVs, fusions, and gene expression in hematologic tumors | |
| GeneDx | XomeDx | Full exome, SNVs |
| XomeDx Plus | Full exome + mitochondrial genome, SNVs | |
| XomeDx Slice | Targeted exome, SNVs | |
| Comprehensive cancer panel | 29 genes, SNVs, CNVs | |
| GPS@WUSTL | Comprehensive Cancer Gene Set Analysis | Sequencing of 42 genes. Mutation analysis |
| Agendia | Mammaprint | Microarray gene expression analysis of 70 genes. Predicts chemotherapy benefit and risk of recurrence of breast cancer |
| Myriad Genetics | BRACAnalysis | Sanger, BRCA1/2, breast and ovarian cancer risk |
| COLARIS | Sanger, six genes, hereditary colorectal cancer | |
| COLARIS AP | Sanger, APC and MYH genes, adenomatous polyposis colon cancer risk | |
| MELARIS | Sanger, CDKN2A, hereditary melanoma | |
| PANEXIA | Sanger, PALB2 + BRCA2 genes, pancreatic cancer risk | |
| Myriad myRisk Hereditary Cancer | Sanger, 25 genes, breast, ovarian, gastric, colorectal, pancreatic, melanoma, prostate, and endometrial cancer risk | |
| NeoGenomics Laboratories | NeoTYPE Cancer Exome Profile | 4813 genes, identify SNVs |
| NeoTYPE Profiles | Custom gene panels, SNVs | |
| OncotypeDX | OncotypeDX Breast Cancer Assay | RT-PCR, 21 genes, gene expression, chemotherapy benefit, and likelihood of recurrence for invasive breast cancer |
| OncotypeDX Colon Cancer Assay | RT-PCR, 18 genes, gene expression, recurrence risk in stage II and stage III colon cancer | |
| OncotypeDX Prostate Cancer Assay | RT-PCR <17 genes, gene expression, treatment selection for prostate cancer | |
| Paradigm | PCDx | Number of genes not specified, DNA and RNA analysis, SNVs, CNVs, SVs, gene expression, fusions, alternative splicing |
| Personal Genome Diagnostics (PGDX) | Whole Genome Analysis | Whole genome, tumor or ctDNA and germline, SNVs, CNVs, SVs |
| CancerXome | Full exome, SNVs, CNVs, SVs | |
| Cancer Select (R88, R203) | 88 or 203 genes, SNVs, CNVs, SVs | |
| ImmunoSelect-R | Exome, ineoantigen prediction to asses utility of immunotherapy | |
| PlasmaSelect-R | 58 genes in ctDNA, SNVs | |
| Quest Diagnostics | OncoVantage | 34 genes, SNVs |
a These descriptions are derived from company web sites and may not be complete. They also do not constitute endorsement of any particular product.
Unlike relative differences in mRNA or protein expression between tumor and normal tissue, somatic mutations in cancer genes are exclusive and specific markers of cancer cells. This fact has been recently leveraged to use cell-free tumor-specific DNA in plasma (ctDNA) as an accurate circulating biomarker of tumor burden. The value of ctDNA for monitoring tumor burden, treatment response, and recurrence was first recognized in colorectal cancer.236 This study identified somatic mutations in patient tumors in recurrently mutated colorectal cancer genes (TP53, PIK3CA, APC, and KRAS) and retrospectively analyzed plasma samples using highly sensitive assays specifically design for each patient. The results showed ctDNA levels reflect changes in tumor burden during treatment when compared with imaging and carcinoembryonic antigen. The challenges in implementation of ctDNA as a routine biomarker for tumor monitoring include the need to identify somatic alterations in each patient, design of patient-specific molecular assays, and low abundance of mutations in circulation, particularly in early stages of disease. Another recent study used NGS of tumors and digital PCR and found ctDNA levels during treatment reflected disease progression in metastatic breast cancer.237 In these results, ctDNA was found to be more responsive and applicable to the largest fraction of patients when compared with enumeration of circulating tumor cells or CA-125, a glycoprotein biomarker of breast cancer. Similar results supporting the role of serial analysis of ctDNA for monitoring tumor burden have been published for lung cancer,238, 239 melanoma,240 and osteosarcoma.241
Advances in molecular methods including the use of high-depth noise-corrected targeted NGS assays are enabling the study of patients with localized, potentially resectable cancers.242, 243 Recent work in localized breast cancer shows ctDNA can predict postoperative recurrence of cancer a median of 8 months before tumors become detectable on imaging.244 This study and additional papers describing ctDNA in localized cancers demonstrate novel opportunities for optimizing treatment of cancer with curative intent by individualizing therapeutic strategies.245
Prospective trials are needed to establish benefit of guiding clinical cancer management using ctDNA as a biomarker. Nevertheless, observational studies reported so far show superior performance of ctDNA to monitor tumor burden compared to a number of circulating tumor cell or glycoprotein biomarkers.246 With some variations between cancer types, ctDNA has wide applicability across patients as shown in a recent comprehensive survey of 640 patients.246 The same study found ctDNA was detectable in 55% of patients with potentially curable disease. These results suggest that improved molecular assays may enable detection of ctDNA in presymptomatic individuals with cancer, potentially leading to a screening test with higher specificity than traditional methods.247–250
Cancer evolution
The ability to sequence cancer genomes has shed light on the process of molecular evolution and its importance for understanding cancer biology and treatment. Although not new, historical consideration of this concept has largely been confined to a process of linear clonal evolution driving the development of an increasingly malignant cancer phenotype.1 However, it is increasingly clear that cancer evolution generates tremendous heterogeneity by continuously generating clonal diversity. As a result, multiple related, but distinct clonal lineages may coexist within a single patient.251 These lineages differ in their ability to progress and metastasize252 as well as to respond to or resist therapy.253 The implications of this complex, branched evolution model will be critically important for understanding cancer biology and developing better treatment approaches.
The cornerstone of cancer evolution lies in the accumulation of genomic mutations, ultimately impacting cellular phenotype. Although the majority of acquired cancer mutations are likely to be passengers, a small proportion will impact critical cellular pathways and processes, thereby acting as disease drivers. However, the exact molecular mechanisms leading to increased mutagenesis in cancer are incompletely understood. Recent analysis, carried out on thousands of cancer genomes, identified at least 20 distinct mutational signatures pointing to diverse processes driving mutagenesis in various cancers, with most cancers showing evidence of more than one such process at play.150 Although the factors leading to several identified mutational signatures such as UV, smoking, or exposure to chemotherapy agents are well known, many are not associated with a known causative processes. Elucidating such novel mechanisms of mutagenesis will be important for facilitating development of better prevention and treatment strategies.
The accumulation of mutations clearly provides the raw material (population diversity) for cancer evolution. However, this accumulation often contributes to the process of clonal evolution within temporal and spatial constrains. The order in which mutations are acquired can dramatically impact cell fate. For example, a loss of BRCA1 or BRCA2 leads to cell cycle arrest in the context of normal TP53 but not in the setting of TP53 loss.254 Consistent with this observation, a loss of the second copy of BRCA1 in breast cancer typically occurs after the loss of TP53. The order of mutational events may also depend on the cell type and state of differentiation. This is seen with KRAS or NRAS mutations, which occur early in colon cancer development, whereas similar NRAS mutations are seen mainly at a late stage in myelodysplastic syndrome.255, 256 Spatial constraints of clonal diversification, on the other hand, have been noted in clear cell renal cell carcinoma and non-small-cell lung cancer,257, 258 where divergent clones develop in specific geographic locations of the tumor. In fact, such spatial separation could lead to “parallel evolution” characterized by distinct mutations arising independently in individual clones, but targeting the same gene or the same pathway, as observed in a variety of cancers.259 An important practical implication of such parallel evolution is that an effective targeted therapy would have to be capable of simultaneously inhibiting independent and molecularly distinct clones within a single patient.
Although clonal diversification is crucial, recent data indicates that simple outgrowth of the most aggressive clones does not fully account for the extent of clonal evolution in cancer. Indeed, similar to the principles of evolutionary biology in general, where no species evolves in isolation, cancers seem to evolve within an ecosystem of interactions not only with the host but also with other coexisting tumor clones. For example, in an experimental model of glioblastoma, a minor clone harboring an EGFR mutation appears to support the major EGFR-wt clone through paracrine mechanisms.260 Similarly, within heterogeneous tumors in zebrafish melanoma xenograft models, a phenomenon of “cooperative invasion” is seen. Here, the presence of an invasive clone enables invasion by another, otherwise poorly invasive clone.261 Such clonal cooperation does not only apply to tumor survival and progression but also extends into the realm of therapeutic resistance. In a model of colon cancer, for instance, the presence of an EGFR inhibitor-resistant, KRAS-mutated minor clone appears to support the survival of a drug-sensitive, KRAS-wt clone through paracrine mechanisms involving transforming growth factor α and amphiregulin.253
On the basis of the above-mentioned temporal and spatial constraints as well as clonal interactions, several models of clonal evolution have been proposed.259 These range from (1) a simple model of linear evolution, where successive accumulation of mutations leads to increasingly aggressive clones that outcompete their predecessors, to (2) models of allopatric speciation, where subpopulations evolve in geographically distinct areas of the tumor, to the models incorporating clonal interactions including (3) a model of clonal competition with distinct clones competing for growth advantages in the form of antagonistic evolution and (4) a model of clonal cooperation with a symbiotic relationship between individual clones (Figure 6).
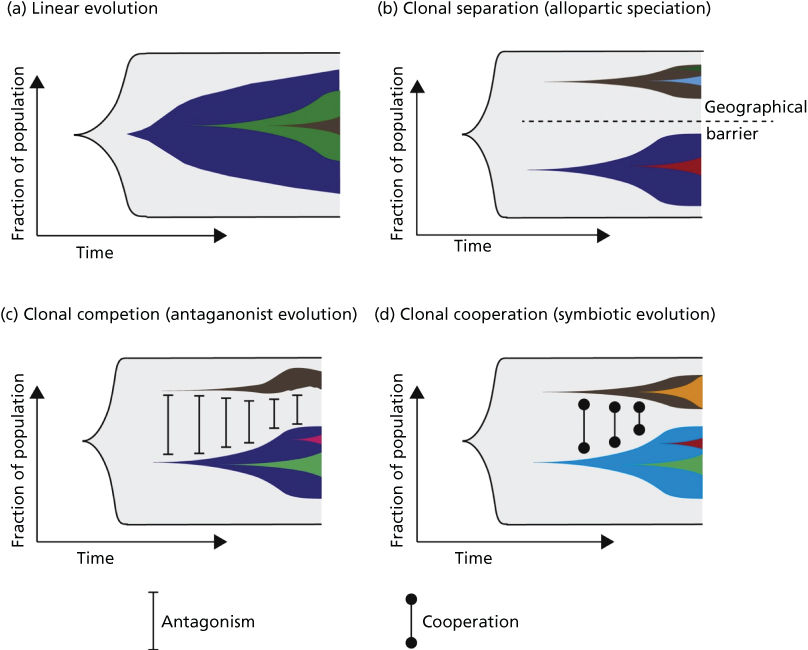
Figure 6 (a) Linear evolution involves sequential accumulation of mutations over time. As can be seen, linear evolution can result in heterogeneity if a subclone has failed to outcompete its predecessors. (b) Tumor subclones may evolve through a process equivalent to allopatric speciation when subclonal populations are geographically distinct within a tumor. (c) Clonal competition can occur between subclonal populations, where distinct subclones compete for growth advantages (equivalent to an antagonistic relationship). (d) Subclonal populations may cooperate, resulting in a symbiotic relationship.
Source: McGranahan 2015.259 Reproduced with permission of Elsevier.
Understanding of the molecular spectrum and mechanisms of cancer evolution impacts our ability to treat cancer. Molecular heterogeneity and clonal evolution limit the benefits derived from targeted treatments. The repertoire of clones with distinct molecular signatures within each patient’s tumor(s) allows for treatment-driven selection, manifesting as acquired therapeutic resistance even in patients who initially respond to treatment. Pre-existing somatic mutations (even passenger events) or new mutations acquired during therapy can drive therapeutic resistance. While improvements in experimental models have enhanced our ability to understand and perturb complex patterns of clonal evolution in the laboratory, development of methods such as ctDNA analysis in plasma can allow monitoring of clonal evolution in the clinic.262 In patients who progress on targeted therapies, multiple studies have shown that somatic mutations driving resistance are detectable in plasma. For instance, lung cancer patients treated with erlotinib or gefitinib (an EGFR inhibitor) most often develop acquired treatment resistance owing to a second mutation in EGFR p.T790M that affects drug binding. This resistance-driving mutation is detectable in ctDNA up to 16 weeks before disease progression is evident on routine imaging.239 Similar data has been reported for patients with colorectal cancer who progress on cetuximab (an anti-EGFR antibody) where KRAS mutations are evident weeks before disease progression.263 A recent study of colorectal cancer patients confirmed that if targeted therapy is discontinued upon disease progression (a drug holiday) and replaced with chemotherapy, circulating levels of the KRAS mutation in ctDNA recede (suggesting recession of KRAS-mutation bearing tumor subclone).264 While these studies used deep targeted sequencing strategies to investigate hypothetical genes driving treatment resistance, hypothesis-free genome-wide analysis to discover novel drivers of treatment resistance has also been described.265 These proof of principle results describing ctDNA analyses to track clonal evolution warrant investigation of ctDNA-based, personalized adaptive, sequential, or combination treatment strategies.
Cancer genomics and evolution in clinical practice: A case study in melanoma
Background
Malignant melanoma is the sixth most common cancer in the United States and is one of few that is increasing in incidence.266 Although detection and surgical resection of early-stage disease can be curative, a tumor thickness of merely 4 mm portends metastatic disease and an abysmal prognosis. Dramatic recent progress in melanoma precision medicine powerfully illustrates the potential for genomics to impact clinical cancer management. In this section, we will focus on this progress and its impact on melanoma treatment while clinical features will be discussed in detail in Chapter 111. Melanoma is a disease of transformed melanocytes and is clinically subdivided by anatomic location, histopathology, sun exposure, and progression (using tumor-node-metastasis staging).267 By site, cutaneous melanoma most commonly originates on sun-exposed skin and is further categorized based on type of sun exposure of the primary site including areas with chronic sun exposure (e.g., face and forearms) and those with intermittent sun exposure (e.g., back). Less common subtypes include acral melanoma, occurring on non-hair-bearing areas of skin on hands and feet; ocular melanoma, which is predominantly uveal with a smaller proportion of conjunctival melanomas; mucosal (nasopharyngeal, bowel, anorectal, or vulvovaginal) and primary CNS melanoma. This categorization has implications for prognosis and treatment, although it is sometimes unable to predict outcome or treatment response. Further, until the discoveries of the past decade, metastatic melanoma was uniformly treated with cytotoxic chemotherapy to limited effect.268
The genetic basis of melanoma
Where variation in clinical course by melanoma histopathologic subtype is confounding, genomic characterization is now helping to clarify etiology, biology, and optimal treatment. Just as breast cancer can best be characterized according to ER, PR, and Her2 status, genotype should now take a prominent role in the clinical approach to melanoma owing to its implications for treatment. Although melanomagenesis is still poorly understood, melanoma is known to occur through the stepwise accumulation in melanocytes of mutations in cancer genes (Figure 7).269 Most melanomas are sporadic with 5–10% of cases due to familial predisposition predominantly driven by germline variants in the first familial melanoma gene identified—the tumor suppressor CDKN2A (40% of familial cases).270–272 Additional rare variants in other cancer genes have since been found in familial cases (CDK4, BRCA2, BAP1, TERT promoter, MITF, and POT1).273–278 Beyond heredity, UV radiation is recognized as the greatest risk factor for cutaneous melanomas, although not for sun-shielded mucosal, acral, or ocular disease.279 In keeping with UV etiology, additional melanoma risk factors include fair skin, increased freckling and benign nevi, MC1R germline variants, and tanning.280–283
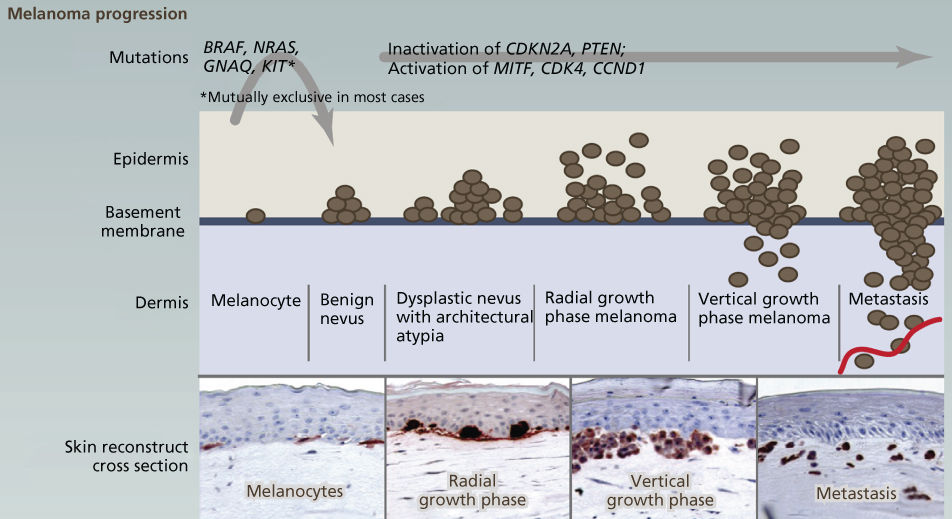
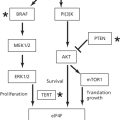
Figure 7 The genetic basis of cutaneous melanoma. Melanoma, the deadliest of skin cancers, is caused by the transformation of melanocytes (pigment-producing cells) that accumulate genetic alterations, leading to abnormal proliferation and dissemination. Clinically, melanoma lesions can be classified based on location and progression, ranging from benign nevi to metastatic melanoma. Important driver genes in melanomas are shown in the figure. MAPK signaling is often constitutively activated through alterations in membrane receptors or through mutations of RAS or BRAF.
Source: Vultur 2013.269 Reproduced with permission of Elsevier.
Early genetic and functional characterization of melanoma determined that it is driven both by mutations that inactivate cell cycle gatekeepers and by those that activate cell proliferation pathways. Building on discovery of familial mutations in CDKN2A, a locus that regulates the p53 and RB proteins, these tumor suppressors were found to be frequently disrupted by disparate mutations that enable unconstrained cell growth such as CDKN2A, CDK4, RB1, TP53, and MDM2 mutations.284–288 Meanwhile frequent mutations in the proliferation pathway genes BRAF, KIT, NRAS, and PTEN were identified and found to cooperate with inactivation of cell cycle tumor suppressors to promote malignancy.115, 119, 289–302 Cytogenetic and molecular studies further pointed to as-yet unidentified genes in recurrently altered regions of chromosomes 1p, 6q, 7p, and 11q.288, 303–311 As with many early genetic analyses of human cancers, these studies were typically performed in disparate small cohorts or model systems, focused on only one or several genes in a single clinical subtype, and often produced inconclusive results.
Melanoma genomic landscapes
The striking genetic complexity between subtypes and within individual tumor genomes revealed by the above analyses was soon confirmed at high resolution through a succession of genomic studies. Genome-wide aCGH profiling and targeted sequencing of BRAF and NRAS in 126 tumors first revealed distinct patterns of somatic mutation based on subtype. BRAF and NRAS mutations were found to be enriched in intermittently sun-exposed and cutaneous melanoma but rare in chronically sun-exposed, mucosal, and acral melanoma. Patterns of mutation also varied by subtype with CNVs enriched in mucosal melanoma. Subsequent analyses identified patterns of CNV correlating with poor prognosis49, 289 as well as subtype-specific KIT mutations occurring in 10–20% of mucosal and acral as well as at low frequency in cutaneous melanoma in sun-damaged sites.48, 312 The existence of molecular subsets of disease was also borne out by gene expression microarray studies84, 313, 314 and such molecular subsetting of clinical melanoma categories seeded hope that these types could be tied to clinical outcome or exploited for therapeutic targeting.315
A spate of massively parallel sequencing studies beginning in 2011 spurred explosive growth in the genomic understanding of cutaneous melanoma, recently culminating in two large multiplatform studies that jointly span over 500 cases.142, 275, 315–325 These studies not only corroborate prior identification of important melanoma drivers (BRAF, NRAS, NF1, TP53, CDKN2A, and RB1) but also point to new genes not previously linked to the disease including RAC1, PREX2, PPP6C, ARID2, TACC1, GRM3, MAP3K4, MAP3K9, IDH1, MRPS31, RPS27, and the TERT promoter. Melanoma is now predominantly categorized according to BRAF, RAS, and NF1 status, all of which, when mutated, constitutively activate the mitogen-activated protein kinase (MAPK) pathway, a central regulator of cell proliferation (Figure 8).142 These mutations tend to be mutually exclusive and account for all but 10% of cases, suggesting four genomic subtypes: BRAF, NRAS, NF1, and triple wild type (TWT). Genome-wide sequencing has also enabled characterization of mutation signatures in melanoma, shedding further light on the role of UV radiation in various subtypes. Melanomas on sun-exposed skin are characterized by UV signature mutations—cytosine to thymine (C > T) substitutions occurring in dipyrimidines as more than 60% of the total mutation burden.142, 318, 326 Curiously, most common mutations in BRAF and NRAS are not C > T substitutions despite their driver roles in the majority of sun-exposed melanomas.317 While it is often noted that melanoma has the highest average mutational burden of any cancer type, the mutation frequency can range from 0.1–100 mutations per megabase.169 This marked heterogeneity tracks with the clinical heterogeneity of the disease, with the highest mutational rate in melanoma on sun-exposed skin at >100/Mb, intermediate rates in mucosal melanoma at 2–5/Mb, and the lowest rates in uveal and CNS melanoma at <0.1/Mb.316, 327, 328
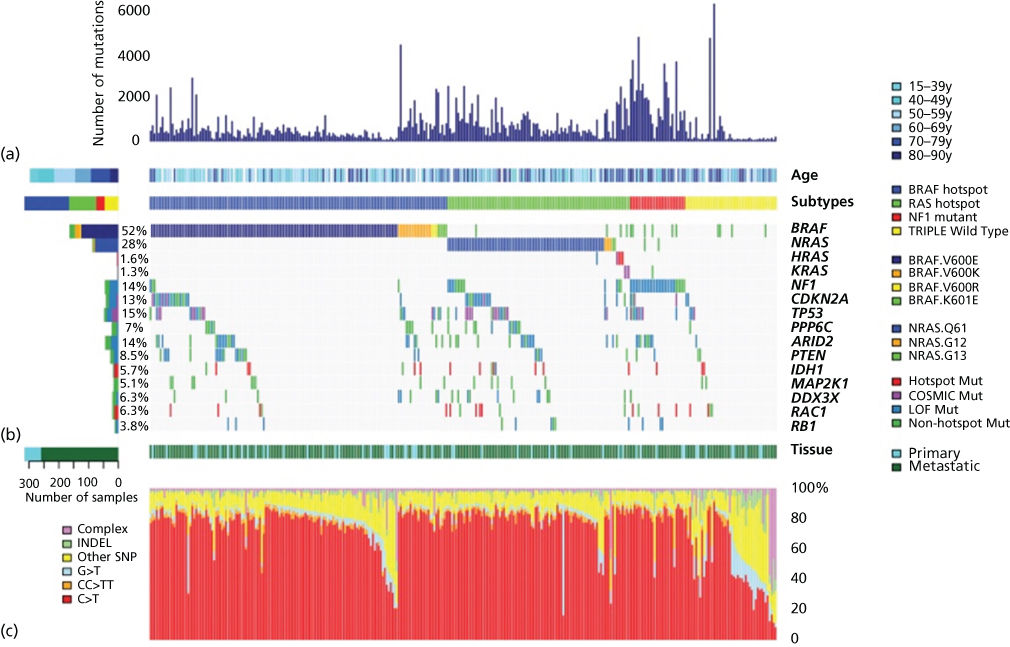
Figure 8 The genomic landscape of cutaneous melanoma. Total number of mutations, age at melanoma accession, and mutation subtype (BRAF, RAS [N/H/K], NF1, and Triple-WT) are indicated for each sample (a). (Not shown are one hypermutated and one co-occurring NRAS BRAF hot-spot mutant). Color-coded matrix of individual mutations (specific BRAF and NRAS mutations indicated) (b), type of melanoma specimen (primary or metastasis), and mutation spectra for all samples (c) are indicated. For the two samples with both a matched primary and metastatic sample, only the mutation information from the metastasis was included.
Source: The Cancer Genome Atlas Network. 2015.142 Reproduced with permission of Elsevier.
Cutaneous BRAF melanomas account for over 50% of tumors and predominantly bear the hotspot missense mutation V600E, although other activating BRAF mutations, amplifications, and even fusions do occur. They are characterized by incidence in younger patients, UV signature in 91%, relatively fewer CNVs compared to TWT, amplifications of BRAF, MITF, PD-1, and PD-L1, enrichment for TP53 mutations, and more frequent PTEN deletions. RAS melanomas are the second most common (30%), typically NRAS Q61R/K/L and with occasional mutations in K– or H-RAS. These mutations are nearly always mutually exclusive with BRAF mutations although molecular features of this category otherwise resemble the BRAF subtype. NF1 melanomas comprise 15% of cases, the majority of which contain inactivating NF1 mutation. This subtype bears the highest SNV burden, occurs in older patients, and contains a UV signature. It can co-occur with BRAF and NRAS mutations and tends to show a pattern of co-occurrence with other mutated “RASopathy” genes such as RASA2.319 Similar to BRAF and RAS mutations, most NF1 mutations drive RAS and MAPK pathway activation. Finally, TWT melanoma is a heterogeneous subtype that lacks recurrent driver mutations although KIT, CTNNB1, GNAQ, GNA11, and EZH2 mutations have been found at low frequency. Notable characteristics of this subtype include higher numbers of SVs, fusions and CNVs, only 30% containing UV signatures, amplifications containing KIT, PDGFRA, KDR, CDK4, CCND1, MDM2, and TERT, and only few (7%) with TERT promoter mutations.142 It is important to highlight that despite diversity across genomic subtypes, the vast majority of melanoma driver mutations converge on the MAPK and PI3K pathways, such that approximately 91% of cutaneous melanomas depend on aberrant activation of this single pathway.329
Despite exhaustive characterization of cutaneous melanoma, genomic landscapes of less-common clinical subtypes remain poorly characterized. Several small studies of uveal, acral, desmoplastic, and mucosal melanoma have identified recurrent mutations, but much still remains unknown. Uveal melanoma, the most common ocular tumor, has been shown in studies encompassing nearly 80 cases to have one of the lowest melanoma mutation burdens and to be characterized by mutations in GNAQ (50%) as well as frequent BAP1, EIF1AX, and SF3B1 mutations in tumors with high metastatic propensity.324, 325, 330–332 Acral melanoma occurs on non-hair-bearing skin of the palms, soles, and nail beds, is the most common melanoma subtype in non-Caucasians, and has a poorer prognosis than cutaneous melanoma on hair-bearing skin owing to later diagnosis.333 Although known for nearly a decade to be largely BRAF wild type, it is rarely included in larger cutaneous genomics studies and limited focused data sets are available. In total, 38 acral melanomas have been characterized across six studies that have identified the following characteristics: about 30% KIT-mutant, 20% BRAF-mutant, 10% NRAS-mutant, low SNV burden, high CNV and SV burden, and absence of UV signature.49, 316–318, 332, 334, 335 Data on mucosal melanoma, another rare and aggressive subtype that is predominantly BRAF wild type, is more sparse with only 10 cases comprehensively assessed in a single study.327 This study largely confirmed prior targeted and cytogenomic analyses, showing a low SNV frequency, high CNV and SV burden, absence of UV signature, and recurrent mutations in KIT, PTEN, and other putative cancer genes in two or fewer samples. Desmoplastic melanoma, a rare and invasive fibrous form of dermal melanoma has also recently been characterized (62 cases) and preliminary results reveal a notably high SNV burden (one of the highest to date at 62 mutations/Mb), UV signatures, absence of BRAF or NRAS mutations, and a diverse array of mutations that activate the MAPK and PI3K pathways.336 Notable similarities and differences between these rare tumor types support their potentially distinct etiology and may help guide therapeutic management.
Clinical implications of melanoma genomics
Although no definitive correlation with outcome has been identified based on the above-mentioned genomic subtyping or other molecular classifications in melanoma, these genomic subtypes have direct bearing on treatment of advanced metastatic melanoma (Table 6). The BRAF subtype carries the greatest array of clinical options. Mutant BRAF has now proven to be an effective therapeutic target, with BRAFV600E/K and K601 targetable by inhibitors of BRAF or MEK. As of 2015, three such small molecule inhibitors have demonstrated an overall survival (OS) benefit in randomized clinical trials. Vemurafenib and dabrafenib are BRAF inhibitors (BRAFi) with demonstrated response rates greater than 90% in BRAF melanoma.224, 337 Trametinib is a MEK inhibitor (MEKi) which, while less dramatically effective than BRAFi, nevertheless triples progression-free survival (PFS) versus chemotherapy.338 The best results to date from trials of targeted agents in BRAF melanoma have come from combined BRAFi and MEKi with dabrafenib and trametinib, a combination with marked improvement in PFS and OS with an overall reduction in toxicity.339, 340
Table 6 Therapeutic options in melanoma by genomic subtype
| Genotype | Approved treatments | Selected phase I or II data |
| BRAF mutant | Targeted—vemurafenib, dabrafenib, and trametinib Immunotherapya—ipilimumab, nivolumab, and pembrolizumab |
Cobimetinib |
| RAS mutant | Targeted therapy—none Immunotherapya—ipilimumab, nivolumab, and pembrolizumab |
Trametinib, MEK162 |
| NF1 mutant | Targeted therapy—none Immunotherapya—ipilimumab, nivolumab, and pembrolizumab |
None |
| Triple wild type (TWT)b | Targeted therapy—none Immunotherapya—ipilimumab, nivolumab, and pembrolizumab |
None |
| TWT — KIT mutant or overexpressed | Targeted therapy—none Immunotherapya—ipilimumab, nivolumab, and pembrolizumab |
Imatinib, nilotinib |
| TWT — GNAQ/GNA11 mutant | Targeted therapy—none Immunotherapya—ipilimumab, nivolumab, and pembrolizumab |
Selumetinib, trametinib, MEK 162 |
a Phase III studies for immunotherapy have not included genotyping beyond BRAF. FDA approval for these does not specify genotype and thus is inclusive of all genotypes.
b No trials to date have specifically identified TWT patients, although KIT and GNAQ/GNA11 cases do occur in this category.
Development of targeted agents for RAS, NF1, TWT, and rare histological melanoma subtypes has lagged behind that for BRAF melanoma, with no completed phase III studies. Nevertheless, early phase studies have shown sufficient efficacy to encourage ongoing efforts at developing agents for these patients. RAS melanoma has been treated with a variety of MEK inhibitors in clinical trials including trametinib,341 MEK162,342 and selumetinib.343 Of these, only MEK162 has shown a significant response rate (around 20%), with the others showing a best response of stable disease. No trials have been conducted specifically in NF1 melanoma, in part due to the emerging understanding of this subtype and overlap with RAF and RAS subtypes. Conflicting preclinical reports have suggested NF1 mutation and loss confers sensitivity or resistance to MEKi and that this relationship is also dependent on RAF/RAS status.319, 344–346 KIT-mutant melanoma (which is common in TWT cutaneous as well as acral and mucosal subtypes) has been shown in two randomized phase II studies to have an overall response rate to imatinib of 19–29%, with the best responses in cases with canonical KIT SNVs rather than amplifications.286, 347 The most robust data in GNAQ/GNA11-mutant disease comes from a randomized phase II study with the MEKi selumetinib.348 Selumetinib induced tumor regression in 49% of patients and led to a nonstatistically significant improvement in OS to 11.8 versus 9.1 months. Additional agents in development that are relevant to many subtypes and/or may motivate additional subtyping include CDK, MDM2, and PI3K/Akt/mTOR inhibitors in clinical trials in addition to ERK, IDH1, EZH2, and aurora kinase inhibitors in preclinical development.142
Little is known about the impact of genomics on immunotherapy. Immunotherapy with the CTLA-4 inhibitor ipilimumab and the PD1 inhibitors pembrolizumab and nivolumab have revolutionized melanoma care with long-term survival even in advanced disease, but the role of genomics as predictive or prognostic for immunotherapy remains to be fully elucidated.349–351 While there is interest in mutational burden as a predictor of response to immunotherapy based on the hypothesis that immunogenicity is a probabilistic aggregate that increases in proportion to total mutation burden, to date no prospective data bears this out. While the hypothesis is supported by the fact that PD1 inhibitors were first approved in melanoma and then lung cancer (the two cancers with the highest mutational burdens), renal cell carcinoma has a very low mutational burden but has demonstrated responsiveness to PD1 inhibitors in phase II studies. Only a minority of patients on the registration studies for pembrolizumab and nivolumab had noncutaneous melanoma and ocular melanomas were excluded. While 20–35% of patients had BRAF V600 mutations, genotyping was not routinely done so that the rate of NRAS mutant and TWT patients is unknown.
Drug resistance and evolution in melanoma
Despite the activity of targeted agents in BRAF melanoma, drug resistance (both innate and acquired) remains a key challenge. Only about 50% of patients respond to BRAFi and in those who do respond, acquired resistance to BRAFi invariably develops.224 BRAFi resistance is driven by a diverse range of mechanisms, most of which reactivate MAPK activity or redirect proliferative signaling through the PI3K pathway. Resistance can occur through further mutation in NRAS,352 MEK1,353, 354 MEK2,354 NF1,344 or BRAF (via amplification).355 BRAF splice variants,356 EGFR activation,357, 358 and COT activation359 have also been implicated. Activation of other receptor tyrosine kinases such as PDGFR-β and IGF-1R or loss of PTEN has also been demonstrated in laboratory models.354, 360–364 Clinical trials are ongoing to test whether identification of these resistance mechanisms in the clinical setting will allow for targeted therapeutic approaches that may circumvent resistance to BRAFi. Hypothetical approaches to circumvent specific resistance mechanism after progression on dual inhibition with BRAFi and MEKi are given in Table 7.
Table 7 Hypothetical treatment approaches to acquired BRAFi/MEKi resistance
| Mechanism of resistance | Therapeutic strategy |
| EGFR activation | EGFR inhibitor—erlotinib, gefitinib, afatinib, and dasatinib PIK3 inhibitor—in trials |
IGF-1R activation
|
PIK3Ca inhibitor—in trials |
| cMET activation | cMET inhibitor—crizotinib |
| PDGFR-β activation | RTK inhibitor—dasatinib, sunitinib |
| FGFR activation | FGFR inhibitors—ponatinib, dasatinib |
| COT activation | ERK inhibitor—in trials |
With the recent approval of new targeted and immunologic therapies for metastatic disease, it is now critically important that the clinician clearly identify the genetic signature of the patient’s disease in order to optimize outcomes. Similarly, genomic testing can accelerate new drug development and target identification for the less common subtypes of melanoma and potentially lead to identification of resistance pathways to guide drug selection in individual patients. Thus, the genomic landscape of melanoma conforms to the clinical heterogeneity of the disease, with melanomas of different locations having markedly different genotypic signatures that speak to distinct etiologies. The challenge, then, is to use available genomic technologies in a real time clinical setting. In theory, one could identify the evolutionary mechanisms active in the individual patient to guide treatment selection.
In addition to molecular diversity across melanoma subtypes and even between individual patients with the same disease subtype, a higher order of complexity is becoming apparent. As outlined in the previous section on cancer evolution, recent data indicates that development of melanoma cannot be fully explained by a linear model of accumulating mutations leading to an increasingly aggressive phenotype. Instead, an emerging picture points to cancer as a complex ecosystem driven by the process of branched clonal evolution. As a result, multiple related, but distinct clonal lineages may exist within a single patient,251 with some lineages being more likely to progress and metastasize.252 Furthermore, this diversity may provide an escape mechanism leading to therapeutic resistance. This is well illustrated by almost universal development of resistance to BRAF inhibition in melanoma, where rapidly relapsing disease can harbor multiple resistance mechanisms differing between individual subclones even within a single patient.365 This challenge is potentiated by the fact that, while some mechanisms of resistance are driven by mutations, others appear to be mediated through epigenetic or posttranslational processes.366 The obvious and critical question raised by these observations is whether a single tumor biopsy in a metastatic setting can capture the full spectrum of disease heterogeneity, its drivers, and potential therapeutic targets. The solution to this conundrum may lie in approaches with the potential to monitor the clonal complexity on a larger scale, such as “liquid biopsies” that attempt to molecularly characterize circulating tumor DNA in the patient’s bloodstream. Emerging data describing detection of ctDNA and concordance of BRAF mutation status between tumor and plasma samples is encouraging.246, 367, 368 In addition, anecdotal evidence suggests that serial ctDNA analysis may be a useful marker of treatment response to immunotherapy.240
Summary
Detailed characterization of the genomic lesions underlying cancer has led to identification of biological pathways driving tumorigenesis, improved cancer diagnosis through molecular classification, enhanced selection of therapeutic targets for drug development, promoted the development of faster and more efficient clinical trials using targeted agents and sophisticated biomarkers, and created markers for early detection and recurrence surveillance. Yet, gaps nonetheless remain in our knowledge of the causative mutations underlying some cancers, in our understanding of the biology of the mutations we have identified, in developing drugs capable of targeting many of these diverse mutations, and in fending off the inevitable emergence of drug resistance. As summarized in this chapter, genomics has already made extraordinary contributions to our understanding of cancer biology and cancer medicine. Nevertheless, the enormous potential of cancer genomics has only just begun to be realized.
Acknowledgments
The authors thank the patients who have supported these studies. We also thank Matthew Taila and Victoria Zismann for assistance in preparation and proofreading of this chapter as well as Jeffrey Watkins for assistance in creation of figures. WPDH, AS, AHB, and JMT received research support from a Stand Up To Cancer—Melanoma Research Alliance/Melanoma Dream Team Translational Cancer Research Grant (SU2C-AACR-DT0612). Stand Up To Cancer is a program of the Entertainment Industry Foundation administered by the American Association for Cancer Research (AACR). WPDH, AS, PR, and JMT are supported by NIH R01CA195670. AS is additionally supported by the Pardee Foundation, NIH R01CA179157, and NIHR01CA185072. MM is additionally supported by a grant from the Science Foundation Arizona. JMT is additionally supported by the Komen Breast Cancer Foundation KG111063 and the Melanoma Research Alliance VUMC42693-R with additional generous support from The Entertainment Industry Foundation, Dell, Inc. through the Dell Powering the Possible Program, and Yale Cancer Center’s UM1 CA186689.
Glossary
- Array comparative genomic hybridization (CGH)
- Microarray platform optimized to identify genome-wide DNA copy number changes.
- Chromothripsis
- Phenomenon by which extensive chromosomal rearrangements occur in a single event in one or a few chromosomes.
- Copy number variant (CNV)
- Change in DNA copy number such as amplification or deletion relative to a reference sequence.
- Driver mutation
- A mutation that confers a selective growth advantage on the cell in which it occurs.
- Epigenomics
- Global study of epigenetic changes throughout the genome.
- Exome sequencing
- Application of NGS for the parallel sequencing of many exons (coding areas of the genome).
- Fluorescence in situ hybridization (FISH)
- Cytogenetic technique for detecting specific DNA sequences on chromosomes using fluorescent probes.
- Gene expression array
- Oligonucleotide microarray platform designed to probe for the transcriptome-wide abundance of RNA messages.
- Genomics
- Study of the structure, function, evolution, and sequence of genomes.
- Germline mutation
- Mutation in the germ cell lineage present in all cells of the body and transmitted to offspring.
- Loss of heterozygosity
- Loss of the normal, functional allele at a heterozygous locus via deletion or other mutational event.
- Massively parallel sequencing (also known as next generation sequencing or NGS)
- High-throughput sequencing methodologies based on simultaneous sequencing of large numbers of genes or entire genomes.
- Mutational hills
- Mutations that occur at low frequency.
- Mutational mountains
- Mutations such as BRAF V600E that are frequent in a single cancer type or across multiple cancer types.
- Single nucleotide polymorphism (SNP) array
- Microarray platform that probes for genome-wide SNPs used to characterize allelic variation, LOH, or CNVs in cancers.
- Oncogene
- Gene that, when activated by mutations, promotes cancerous phenotype.
- Passenger mutation
- A mutation that does not confer a selective growth advantage to the cell in which it occurs.
- Sanger sequencing
- An approach for targeted DNA sequencing of individual genes or sets of genes using dideoxy chain termination and agarose gel electrophoresis.
- Single nucleotide polymorphism (SNP)
- Single nucleotide sequence difference occurring in germ lines of individuals across populations.
- Single nucleotide variant (SNV)
- Change in the DNA sequence relative to a reference sequence including point mutation and small insertions and deletions.
- Somatic mutation
- Mutation acquired somatically in a subset of cells (e.g., in a cancer).
- Structural variant (SV)
- Structural DNA changes such as rearrangements, translocations, inversions, etc.
- Transcriptomics
- Study of all RNA transcripts in a cell or population of cells.
- Tumor suppressor
- A gene safeguarding cellular processes that, when inactivated, facilitates oncogenesis.
References
- 1 Nowell PC. The clonal evolution of tumor cell populations. Science. 1976;194(4260):23–28.
- 2 Hanahan D, Weinberg RA. Hallmarks of cancer: the next generation. Cell. 2011;144(5):646–674.
- 3 Fearon ER, Vogelstein B. A genetic model for colorectal tumorigenesis. Cell. 1990;61(5):759–767.
- 4 Vogelstein B, Papadopoulos N, Velculescu VE, Zhou S, Diaz LA, Kinzler KW. Cancer genome landscapes. Science. 2013;339(6127):1546–1558.
- 5 Futreal PA, Coin L, Marshall M, et al. A census of human cancer genes. Nat Rev Cancer. 2004;4(3):177–183.
- 6 Feinberg AP, Tycko B. The history of cancer epigenetics. Nat Rev Cancer. 2004;4(2):143–153.
- 7 Kadoch C, Hargreaves DC, Hodges C, et al. Proteomic and bioinformatic analysis of mammalian SWI/SNF complexes identifies extensive roles in human malignancy. Nat Genet. 2013;45(6):592–601.
- 8 Jones PA, Baylin SB. The fundamental role of epigenetic events in cancer. Nat Rev Genet. 2002;3(6):415–428.
- 9 Calin GA, Croce CM. MicroRNA signatures in human cancers. Nat Rev Cancer. 2006;6(11):857–866.
- 10 Darwin C. On the Origins of Species by Means of Natural Selection. London: Murray; 1859:247.
- 11 Mendel G. Versuche über Pflanzenhybriden. Verhandlungen des naturforschenden Vereines in Brunn. 1866;4:3–47.
- 12 Waldeyer W. Über Karyokinese und ihre Beziehungen zu den Befruchtungsvorgängen. Arch Mikrosk Anat. 1888;32(1):1–122.
- 13 Boveri T, Harris H. Concerning the Origin of Malignant Tumours. Woodbury, NY: Cold Spring Harbor Laboratory Press; 2008.
- 14 Boveri T. Über mehrpolige mitosen als mittel zur analyse des zellkerns. Verhandlungen der Physikalisch-medicinischen Gesellschaft zu Würzburg. 1902;35:67–90.
- 15 Morgan TH. Chromosomes and heredity. Am Nat. 1910;44:449–496.
- 16 Huxley J. Evolution. The Modern Synthesis. London: Allen and Unwin; 1942.
- 17 Watson JD, Crick FH. Molecular structure of nucleic acids. Nature. 1953;171(4356):737–738.
- 18 Lockhart-Mummery P. Cancer and heredity. Lancet. 1925;205(5296):427–429.
- 19 Yamagiwa K, Ichikawa K. Experimental study of the pathogenesis of carcinoma. J Cancer Res. 1918;3(1):1–29.
- 20 Doll R, Hill AB. Smoking and carcinoma of the lung. Br Med J. 1950;2(4682):739.
- 21 Muller H. X-ray induced mutation of Drosophila virilis. Science. 1927;66:84–87.
- 22 Rous P. A sarcoma of the fowl transmissible by an agent separable from the tumor cells. J Exp Med. 1911;13(4):397–411.
- 23 Moorhead PS, Nowell P, Mellman W, Battips D, Hungerford D. Chromosome preparations of leukocytes cultured from human peripheral blood. Exp Cell Res. 1960;20(3):613–616.
- 24 Tjio JH, Levan A. The chromosome number of man. Hereditas. 1956;42:1–6.
- 25 Nowell P. A minute chromosome in human granulocytic leukemia. Science. 1960;132:1497.
- 26 Caspersson T, Farber S, Foley GE, et al. Chemical differentiation along metaphase chromosomes. Exp Cell Res. 1968;49(1):219–222.
- 27 Rowley JD. Letter: a new consistent chromosomal abnormality in chronic myelogenous leukaemia identified by quinacrine fluorescence and Giemsa staining. Nature. 1973;243(5405):290–293.
- 28 Mitelman F, Johansson B, Mertens F (2005) Mitelman Database of Chromosome Aberrations in Cancer. http://cgap.nci.nih.gov/chromosomes/mitelman (accessed 24 Oct 2015).
- 29 Schröck E, Du Manoir S, Veldman T, et al. Multicolor spectral karyotyping of human chromosomes. Science. 1996;273(5274):494–497.
- 30 Speicher MR, Gwyn Ballard S, Ward DC. Karyotyping human chromosomes by combinatorial multi-fluor FISH. Nat Genet. 1996;12(4):368–375.
- 31 Fauth C, Speicher MR. Classifying by colors: FISH-based genome analysis. Cytogenet Cell Genet. 2001;93(1-2):1–10.
- 32 Lichter P. Multicolor FISHing: what’s the catch? Trends Genet. 1997;13(12):475–479.
- 33 Gracia E, Ray ME, Polymeropoulos MH, Dehejia A, Meltzer PS, Trent JM. Isolation of chromosome-specific ESTs by microdissection-mediated cDNA capture. Genome Res. 1997;7(2):100–107.
- 34 Guan XY, Trent JM, Meltzer PS. Generation of band-specific painting probes from a single microdissected chromosome. Hum Mol Genet. 1993;2(8):1117–1121.
- 35 Guan XY, Zhang HE, Zhou H, Sham JS, Fung JM, Trent JM. Characterization of a complex chromosome rearrangement involving 6q in a melanoma cell line by chromosome microdissection. Cancer Genet Cytogenet. 2002;134(1):65–70.
- 36 Meloni-Ehrig AM, Chen Z, Guan XY, et al. Identification of a ring chromosome in a myxoid malignant fibrous histiocytoma with chromosome microdissection and fluorescence in situ hybridization. Cancer Genet Cytogenet. 1999;109(1):81–85.
- 37 Meltzer PS, Guan XY, Trent JM. Telomere capture stabilizes chromosome breakage. Nat Genet. 1993;4(3):252–255.
- 38 Meltzer PS, Guan X-Y, Burgess A, Trent JM. Rapid generation of region specific probes by chromosome microdissection and their application. Nat Genet. 1992;1(1):24–28.
- 39 Eils R, Uhrig S, Saracoglu K, et al. An optimized, fully automated system for fast and accurate identification of chromosomal rearrangements by multiplex-FISH (M-FISH). Cytogenet Cell Genet. 1998;82(3-4):160–171.
- 40 Kallioniemi A, Kallioniemi OP, Sudar D, et al. Comparative genomic hybridization for molecular cytogenetic analysis of solid tumors. Science. 1992;258(5083):818–821.
- 41 Solinas-Toldo S, Lampel S, Stilgenbauer S, et al. Matrix-based comparative genomic hybridization: biochips to screen for genomic imbalances. Genes Chromosomes Cancer. 1997;20(4):399–407.
- 42 Pinkel D, Segraves R, Sudar D, et al. High resolution analysis of DNA copy number variation using comparative genomic hybridization to microarrays. Nat Genet. 1998;20(2):207–211.
- 43 Selzer RR, Richmond TA, Pofahl NJ, et al. Analysis of chromosome breakpoints in neuroblastoma at sub-kilobase resolution using fine-tiling oligonucleotide array CGH. Genes Chromosomes Cancer. 2005;44(3):305–319.
- 44 Sharp AJ, Selzer RR, Veltman JA, et al. Characterization of a recurrent 15q24 microdeletion syndrome. Hum Mol Genet. 2007;16(5):567–572.
- 45 Chin K, DeVries S, Fridlyand J, et al. Genomic and transcriptional aberrations linked to breast cancer pathophysiologies. Cancer Cell. 2006;10(6):529–541.
- 46 Neve RM, Chin K, Fridlyand J, et al. A collection of breast cancer cell lines for the study of functionally distinct cancer subtypes. Cancer Cell. 2006;10(6):515–527.
- 47 Jonsson G, Staaf J, Olsson E, et al. High-resolution genomic profiles of breast cancer cell lines assessed by tiling BAC array comparative genomic hybridization. Genes Chromosomes Cancer. 2007;46(6):543–558.
- 48 Curtin JA, Busam K, Pinkel D, Bastian BC. Somatic activation of KIT in distinct subtypes of melanoma. J Clin Oncol. 2006;24(26):4340–4346.
- 49 Curtin JA, Fridlyand J, Kageshita T, et al. Distinct sets of genetic alterations in melanoma. N Engl J Med. 2005;353(20):2135–2147.
- 50 Jonsson G, Dahl C, Staaf J, et al. Genomic profiling of malignant melanoma using tiling-resolution arrayCGH. Oncogene. 2007;26(32):4738–4748.
- 51 Mestre-Escorihuela C, Rubio-Moscardo F, Richter JA, et al. Homozygous deletions localize novel tumor suppressor genes in B-cell lymphomas. Blood. 2007;109(1):271–280.
- 52 Kallioniemi A. CGH microarrays and cancer. Curr Opin Biotechnol. 2008;19(1):36–40.
- 53 Fitzgibbon J, Smith LL, Raghavan M, et al. Association between acquired uniparental disomy and homozygous gene mutation in acute myeloid leukemias. Cancer Res. 2005;65(20):9152–9154.
- 54 Teh MT, Blaydon D, Chaplin T, et al. Genomewide single nucleotide polymorphism microarray mapping in basal cell carcinomas unveils uniparental disomy as a key somatic event. Cancer Res. 2005;65(19):8597–8603.
- 55 Raghavan M, Lillington DM, Skoulakis S, et al. Genome-wide single nucleotide polymorphism analysis reveals frequent partial uniparental disomy due to somatic recombination in acute myeloid leukemias. Cancer Res. 2005;65(2):375–378.
- 56 Garraway LA, Widlund HR, Rubin MA, et al. Integrative genomic analyses identify MITF as a lineage survival oncogene amplified in malignant melanoma. Nature. 2005;436(7047):117–122.
- 57 Weir BA, Woo MS, Getz G, et al. Characterizing the cancer genome in lung adenocarcinoma. Nature. 2007;450(7171):893–898.
- 58 Raghavan M, Smith LL, Lillington DM, et al. Segmental uniparental disomy is a commonly acquired genetic event in relapsed acute myeloid leukemia. Blood. 2008;112(3):814–821.
- 59 George RE, Attiyeh EF, Li S, et al. Genome-wide analysis of neuroblastomas using high-density single nucleotide polymorphism arrays. PLoS One. 2007;2(2):e255.
- 60 Lin WM, Baker AC, Beroukhim R, et al. Modeling genomic diversity and tumor dependency in malignant melanoma. Cancer Res. 2008;68(3):664–673.
- 61 Stark M, Hayward N. Genome-wide loss of heterozygosity and copy number analysis in melanoma using high-density single-nucleotide polymorphism arrays. Cancer Res. 2007;67(6):2632–2642.
- 62 Wood LD, Parsons DW, Jones S, et al. The genomic landscapes of human breast and colorectal cancers. Science. 2007;318(5853):1108–1113.
- 63 Gaasenbeek M, Howarth K, Rowan AJ, et al. Combined array-comparative genomic hybridization and single-nucleotide polymorphism-loss of heterozygosity analysis reveals complex changes and multiple forms of chromosomal instability in colorectal cancers. Cancer Res. 2006;66(7):3471–3479.
- 64 Andersen CL, Wiuf C, Kruhoffer M, Korsgaard M, Laurberg S, Orntoft TF. Frequent occurrence of uniparental disomy in colorectal cancer. Carcinogenesis. 2007;28(1):38–48.
- 65 McLendon R, Friedman A, Bigner D, et al. Comprehensive genomic characterization defines human glioblastoma genes and core pathways. Nature. 2008;455(7216):1061–1068.
- 66 Parsons DW, Jones S, Zhang X, et al. An integrated genomic analysis of human glioblastoma multiforme. Science. 2008;321(5897):1807–1812.
- 67 Jones S, Zhang X, Parsons DW, et al. Core signaling pathways in human pancreatic cancers revealed by global genomic analyses. Science. 2008;321(5897):1801–1806.
- 68 Albertson DG, Collins C, McCormick F, Gray JW. Chromosome aberrations in solid tumors. Nat Genet. 2003;34(4):369–376.
- 69 Saiki RK, Gelfand DH, Stoffel S, et al. Primer-directed enzymatic amplification of DNA with a thermostable DNA polymerase. Science. 1988;239(4839):487–491.
- 70 Sanger F, Air GM, Barrell BG, et al. Nucleotide sequence of bacteriophage phi X174 DNA. Nature. 1977;265(5596):687–695.
- 71 Lander ES, Linton LM, Birren B, et al. Initial sequencing and analysis of the human genome. Nature. 2001;409(6822):860–921.
- 72 Venter JC, Adams MD, Myers EW, et al. The sequence of the human genome. Science. 2001;291(5507):1304–1351.
- 73 International Human Genome Sequencing Consortium. Finishing the euchromatic sequence of the human genome. Nature. 2004;431(7011):931–945.
- 74 Bignell G, Smith R, Hunter C, et al. Sequence analysis of the protein kinase gene family in human testicular germ-cell tumors of adolescents and adults. Genes Chromosomes Cancer. 2006;45(1):42–46.
- 75 Davies H, Hunter C, Smith R, et al. Somatic mutations of the protein kinase gene family in human lung cancer. Cancer Res. 2005;65(17):7591–7595.
- 76 Greenman C, Stephens P, Smith R, et al. Patterns of somatic mutation in human cancer genomes. Nature. 2007;446(7132):153–158.
- 77 Stephens P, Edkins S, Davies H, et al. A screen of the complete protein kinase gene family identifies diverse patterns of somatic mutations in human breast cancer. Nat Genet. 2005;37(6):590–592.
- 78 Velculescu VE, Zhang L, Vogelstein B, Kinzler KW. Serial analysis of gene expression. Science. 1995;270(5235):484–487.
- 79 Kapranov P, Cheng J, Dike S, et al. RNA maps reveal new RNA classes and a possible function for pervasive transcription. Science. 2007;316(5830):1484–1488.
- 80 Wang H, Ach RA, Curry B. Direct and sensitive miRNA profiling from low-input total RNA. RNA (New York, NY). 2007;13(1):151–159.
- 81 Alizadeh AA, Eisen MB, Davis RE, et al. Distinct types of diffuse large B-cell lymphoma identified by gene expression profiling. Nature. 2000;403(6769):503–511.
- 82 Rosenwald A, Wright G, Chan WC, et al. The use of molecular profiling to predict survival after chemotherapy for diffuse large-B-cell lymphoma. N Engl J Med. 2002;346(25):1937–1947.
- 83 Bhattacharjee A, Richards WG, Staunton J, et al. Classification of human lung carcinomas by mRNA expression profiling reveals distinct adenocarcinoma subclasses. Proc Natl Acad Sci U S A. 2001;98(24):13790–13795.
- 84 Bittner M, Meltzer P, Chen Y, et al. Molecular classification of cutaneous malignant melanoma by gene expression profiling. Nature. 2000;406(6795):536–540.
- 85 Sorlie T, Perou CM, Tibshirani R, et al. Gene expression patterns of breast carcinomas distinguish tumor subclasses with clinical implications. Proc Natl Acad Sci U S A. 2001;98(19):10869–10874.
- 86 Perou CM, Sorlie T, Eisen MB, et al. Molecular portraits of human breast tumours. Nature. 2000;406(6797):747–752.
- 87 van’t Veer LJ, Dai H, van de Vijver MJ, et al. Gene expression profiling predicts clinical outcome of breast cancer. Nature. 2002;415(6871):530–536.
- 88 MacDonald TJ, Brown KM, LaFleur B, et al. Expression profiling of medulloblastoma: PDGFRA and the RAS/MAPK pathway as therapeutic targets for metastatic disease. Nat Genet. 2001;29(2):143–152.
- 89 Ramaswamy S, Ross KN, Lander ES, Golub TR. A molecular signature of metastasis in primary solid tumors. Nat Genet. 2003;33(1):49–54.
- 90 Armstrong SA, Staunton JE, Silverman LB, et al. MLL translocations specify a distinct gene expression profile that distinguishes a unique leukemia. Nat Genet. 2002;30(1):41–47.
- 91 Yeoh EJ, Ross ME, Shurtleff SA, et al. Classification, subtype discovery, and prediction of outcome in pediatric acute lymphoblastic leukemia by gene expression profiling. Cancer Cell. 2002;1(2):133–143.
- 92 Ross ME, Zhou X, Song G, et al. Classification of pediatric acute lymphoblastic leukemia by gene expression profiling. Blood. 2003;102(8):2951–2959.
- 93 Miller LD, Smeds J, George J, et al. An expression signature for p53 status in human breast cancer predicts mutation status, transcriptional effects, and patient survival. Proc Natl Acad Sci U S A. 2005;102(38):13550–13555.
- 94 Johansson P, Pavey S, Hayward N. Confirmation of a BRAF mutation-associated gene expression signature in melanoma. Pigment Cell Res. 2007;20(3):216–221.
- 95 Pavey S, Johansson P, Packer L, et al. Microarray expression profiling in melanoma reveals a BRAF mutation signature. Oncogene. 2004;23(23):4060–4067.
- 96 Hedenfalk I, Duggan D, Chen Y, et al. Gene-expression profiles in hereditary breast cancer. N Engl J Med. 2001;344(8):539–548.
- 97 Schloss JA. How to get genomes at one ten-thousandth the cost. Nat Biotechnol. 2008;26(10):1113–1115.
- 98 Tsien RY, Ross P, Fahnestock M, Johnston AJ. DNA sequencing. Google Patents, 1991.
- 99 Ronaghi M, Karamohamed S, Pettersson B, Uhlén M, Nyrén P. Real-time DNA sequencing using detection of pyrophosphate release. Anal Biochem. 1996;242(1):84–89.
- 100 Farinelli L, Kawashima E, Mayer P. Method of nucleic acid amplification. Google Patents, 1998.
- 101 Dressman D, Yan H, Traverso G, Kinzler KW, Vogelstein B. Transforming single DNA molecules into fluorescent magnetic particles for detection and enumeration of genetic variations. Proc Natl Acad Sci. 2003;100(15):8817–8822.
- 102 Brenner S, Johnson M, Bridgham J, et al. Gene expression analysis by massively parallel signature sequencing (MPSS) on microbead arrays. Nat Biotechnol. 2000;18(6):630–634.
- 103 Margulies M, Egholm M, Altman WE, et al. Genome sequencing in microfabricated high-density picolitre reactors. Nature. 2005;437(7057):376–380.
- 104 Williams R, Peisajovich SG, Miller OJ, Magdassi S, Tawfik DS, Griffiths AD. Amplification of complex gene libraries by emulsion PCR. Nat Methods. 2006;3(7):545–550.
- 105 Shendure J, Porreca GJ, Reppas NB, et al. Accurate multiplex polony sequencing of an evolved bacterial genome. Science. 2005;309(5741):1728–1732.
- 106 Wheeler DA, Srinivasan M, Egholm M, et al. The complete genome of an individual by massively parallel DNA sequencing. Nature. 2008;452(7189):872–876.
- 107 Campbell PJ, Stephens PJ, Pleasance ED, et al. Identification of somatically acquired rearrangements in cancer using genome-wide massively parallel paired-end sequencing. Nat Genet. 2008;40(6):722–729.
- 108 Reuter JA, Spacek DV, Snyder MP. High-throughput sequencing technologies. Mol Cell. 2015;58(4):586–597.
- 109 Smith MG, Gianoulis TA, Pukatzki S, et al. New insights into Acinetobacter baumannii pathogenesis revealed by high-density pyrosequencing and transposon mutagenesis. Genes Dev. 2007;21(5):601–614.
- 110 Bashiardes S, Veile R, Helms C, Mardis ER, Bowcock AM, Lovett M. Direct genomic selection. Nat Methods. 2005;2(1):63–69.
- 111 Kahvejian A, Quackenbush J, Thompson JF. What would you do if you could sequence everything? Nat Biotechnol. 2008;26(10):1125–1133.
- 112 Turner EH, Ng SB, Nickerson DA, Shendure J. Methods for genomic partitioning. Annu Rev Genomics Hum Genet. 2009;10:263–284.
- 113 Choi M, Scholl UI, Ji W, et al. Genetic diagnosis by whole exome capture and massively parallel DNA sequencing. Proc Natl Acad Sci. 2009;106(45):19096–19101.
- 114 Mamanova L, Coffey AJ, Scott CE, et al. Target-enrichment strategies for next-generation sequencing. Nat Methods. 2010;7(2):111–118.
- 115 Davies H, Bignell GR, Cox C, et al. Mutations of the BRAF gene in human cancer. Nature. 2002;417(6892):949–954.
- 116 Brose MS, Volpe P, Feldman M, et al. BRAF and RAS mutations in human lung cancer and melanoma. Cancer Res. 2002;62(23):6997–7000.
- 117 Samuels Y, Wang Z, Bardelli A, et al. High frequency of mutations of the PIK3CA gene in human cancers. Science. 2004;304(5670):554.
- 118 Stephens P, Hunter C, Bignell G, et al. Lung cancer: intragenic ERBB2 kinase mutations in tumours. Nature. 2004;431(7008):525–526.
- 119 Pollock PM, Harper UL, Hansen KS, et al. High frequency of BRAF mutations in nevi. Nat Genet. 2003;33(1):19–20.
- 120 Ley TJ, Minx PJ, Walter MJ, et al. A pilot study of high-throughput, sequence-based mutational profiling of primary human acute myeloid leukemia cell genomes. Proc Natl Acad Sci. 2003;100(24):14275–14280.
- 121 Sjöblom T, Jones S, Wood LD, et al. The consensus coding sequences of human breast and colorectal cancers. Science. 2006;314(5797):268–274.
- 122 Ley TJ, Mardis ER, Ding L, et al. DNA sequencing of a cytogenetically normal acute myeloid leukaemia genome. Nature. 2008;456(7218):66–72.
- 123 Mardis ER, Ding L, Dooling DJ, et al. Recurring mutations found by sequencing an acute myeloid leukemia genome. N Engl J Med. 2009;361(11):1058–1066.
- 124 Shah SP, Morin RD, Khattra J, et al. Mutational evolution in a lobular breast tumour profiled at single nucleotide resolution. Nature. 2009;461(7265):809–813.
- 125 Pleasance ED, Cheetham RK, Stephens PJ, et al. A comprehensive catalogue of somatic mutations from a human cancer genome. Nature. 2010;463(7278):191–196.
- 126 Pleasance ED, Stephens PJ, O’Meara S, et al. A small-cell lung cancer genome with complex signatures of tobacco exposure. Nature. 2010;463(7278):184–190.
- 127 The Cancer Genome Atlas Research Network. Integrated genomic analyses of ovarian carcinoma. Nature. 2011;474(7353):609–615.
- 128 The Cancer Genome Atlas Research Network. Comprehensive genomic characterization of squamous cell lung cancers. Nature. 2012;489(7417):519–525.
- 129 The Cancer Genome Atlas Network. Comprehensive molecular characterization of human colon and rectal cancer. Nature. 2012;487(7407):330–337.
- 130 The Cancer Genome Atlas Network. Comprehensive molecular portraits of human breast tumours. Nature. 2012;490(7418):61–70.
- 131 The Cancer Genome Atlas Research Network. Integrated genomic characterization of endometrial carcinoma. Nature. 2013;497(7447):67–73.
- 132 The Cancer Genome Atlas Research Network. Genomic and epigenomic landscapes of adult de novo acute myeloid leukemia. N Engl J Med. 2013;368(22):2059.
- 133 The Cancer Genome Atlas Research Network. Comprehensive molecular characterization of clear cell renal cell carcinoma. Nature. 2013;499(7456):43–49.
- 134 Brennan CW, Verhaak RG, McKenna A, et al. The somatic genomic landscape of glioblastoma. Cell. 2013;155(2):462–477.
- 135 The Cancer Genome Atlas Research Network. Comprehensive molecular characterization of urothelial bladder carcinoma. Nature. 2014;507(7492):315–322.
- 136 The Cancer Genome Atlas Research Network. Comprehensive molecular profiling of lung adenocarcinoma. Nature. 2014;511(7511):543–550.
- 137 The Cancer Genome Atlas Research Network. Comprehensive molecular characterization of gastric adenocarcinoma. Nature. 2014.
- 138 Davis CF, Ricketts CJ, Wang M, et al. The somatic genomic landscape of chromophobe renal cell carcinoma. Cancer Cell. 2014;26(3):319–330.
- 139 The Cancer Genome Atlas Research Network. Integrated genomic characterization of papillary thyroid carcinoma. Cell. 2014;159(3):676–690.
- 140 The Cancer Genome Atlas Network. Comprehensive genomic characterization of head and neck squamous cell carcinomas. Nature. 2015;517(7536):576–582.
- 141 The Cancer Genome Atlas Network. Comprehensive, integrative genomic analysis of diffuse lower-grade gliomas. N Engl J Med. 2015;372(26):2481–2498.
- 142 The Cancer Genome Network. Genomic classification of cutaneous melanoma. Cell. 2015;161(7):1681–1696.
- 143 Weinstein JN, Collisson EA, Mills GB, et al. The cancer genome atlas pan-cancer analysis project. Nat Genet. 2013;45(10):1113–1120.
- 144 Hudson TJ, Anderson W, Aretz A, et al. International network of cancer genome projects. Nature. 2010;464(7291):993–998.
- 145 Otto C, Stadler PF, Hoffmann S. Fast and sensitive mapping of bisulfite-treated sequencing data. Bioinformatics. 2012;28(13):1698–1704.
- 146 Kreck B, Marnellos G, Richter J, Krueger F, Siebert R, Franke A. B-SOLANA: an approach for the analysis of two-base encoding bisulfite sequencing data. Bioinformatics. 2012;28(3):428–429.
- 147 Klapper W, Kreuz M, Kohler CW, et al. Patient age at diagnosis is associated with the molecular characteristics of diffuse large B-cell lymphoma. Blood. 2012;119(8):1882–1887.
- 148 Richter J, Schlesner M, Hoffmann S, et al. Recurrent mutation of the ID3 gene in Burkitt lymphoma identified by integrated genome, exome and transcriptome sequencing. Nat Genet. 2012;44(12):1316–1320.
- 149 Jager N, Schlesner M, Jones DT, et al. Hypermutation of the inactive X chromosome is a frequent event in cancer. Cell. 2013;155(3):567–581.
- 150 Alexandrov LB, Nik-Zainal S, Wedge DC, et al. Signatures of mutational processes in human cancer. Nature. 2013;500(7463):415–421.
- 151 Deckert M, Montesinos-Rongen M, Brunn A, Siebert R. Systems biology of primary CNS lymphoma: from genetic aberrations to modeling in mice. Acta Neuropathol. 2014;127(2):175–188.
- 152 Forbes SA, Beare D, Gunasekaran P, et al. COSMIC: exploring the world’s knowledge of somatic mutations in human cancer. Nucleic Acids Res. 2015;43(D1):D805–D811.
- 153 Ushijima T. Detection and interpretation of altered methylation patterns in cancer cells. Nat Rev Cancer. 2005;5(3):223–231.
- 154 Gao J, Aksoy BA, Dogrusoz U, et al. Integrative analysis of complex cancer genomics and clinical profiles using the cBioPortal. Sci Signal. 2013;6(269):pl1.
- 155 Wilks C, Cline MS, Weiler E, et al. The Cancer Genomics Hub (CGHub): overcoming cancer through the power of torrential data. Database. 2014;2014:bau093.
- 156 Lee RS, Stewart C, Carter SL, et al. A remarkably simple genome underlies highly malignant pediatric rhabdoid cancers. J Clin Invest. 2012;122(8):2983.
- 157 Ramos P, Karnezis AN, Hendricks WP, et al. Loss of the tumor suppressor SMARCA4 in small cell carcinoma of the ovary, hypercalcemic type (SCCOHT). Rare Dis. 2014;2(1):e967148.
- 158 Beroukhim R, Getz G, Nghiemphu L, et al. Assessing the significance of chromosomal aberrations in cancer: methodology and application to glioma. Proc Natl Acad Sci U S A. 2007;104(50):20007–20012.
- 159 Beroukhim R, Mermel CH, Porter D, et al. The landscape of somatic copy-number alteration across human cancers. Nature. 2010;463(7283):899–905.
- 160 Zack TI, Schumacher SE, Carter SL, et al. Pan-cancer patterns of somatic copy number alteration. Nat Genet. 2013;45(10):1134–1140.
- 161 Molenaar JJ, Koster J, Zwijnenburg DA, et al. Sequencing of neuroblastoma identifies chromothripsis and defects in neuritogenesis genes. Nature. 2012;483(7391):589–593.
- 162 Rausch T, Jones DT, Zapatka M, et al. Genome sequencing of pediatric medulloblastoma links catastrophic DNA rearrangements with TP53 mutations. Cell. 2012;148(1):59–71.
- 163 Crasta K, Ganem NJ, Dagher R, et al. DNA breaks and chromosome pulverization from errors in mitosis. Nature. 2012;482(7383):53–58.
- 164 Tomasetti C, Vogelstein B, Parmigiani G. Half or more of the somatic mutations in cancers of self-renewing tissues originate prior to tumor initiation. Proc Natl Acad Sci. 2013;110(6):1999–2004.
- 165 Tomasetti C, Vogelstein B. Variation in cancer risk among tissues can be explained by the number of stem cell divisions. Science. 2015;347(6217):78–81.
- 166 Baca SC, Prandi D, Lawrence MS, et al. Punctuated evolution of prostate cancer genomes. Cell. 2013;153(3):666–677.
- 167 Bozic I, Antal T, Ohtsuki H, et al. Accumulation of driver and passenger mutations during tumor progression. Proc Natl Acad Sci. 2010;107(43):18545–18550.
- 168 Dees ND, Zhang Q, Kandoth C, et al. MuSiC: identifying mutational significance in cancer genomes. Genome Res. 2012;22(8):1589–1598.
- 169 Lawrence MS, Stojanov P, Polak P, et al. Mutational heterogeneity in cancer and the search for new cancer-associated genes. Nature. 2013;499(7457):214–218.
- 170 Walsh T, Lee MK, Casadei S, et al. Detection of inherited mutations for breast and ovarian cancer using genomic capture and massively parallel sequencing. Proc Natl Acad Sci U S A. 2010;107(28):12629–12633.
- 171 Walsh T, Casadei S, Coats KH, et al. Spectrum of mutations in BRCA1, BRCA2, CHEK2, and TP53 in families at high risk of breast cancer. JAMA. 2006;295(12):1379–1388.
- 172 Stephens PJ, McBride DJ, Lin M-L, et al. Complex landscapes of somatic rearrangement in human breast cancer genomes. Nature. 2009;462(7276):1005–1010.
- 173 Miki Y, Nishisho I, Horii A, et al. Disruption of the APC gene by a retrotransposal insertion of L1 sequence in a colon cancer. Cancer Res. 1992;52(3):643–645.
- 174 Lipson D, Capelletti M, Yelensky R, et al. Identification of new ALK and RET gene fusions from colorectal and lung cancer biopsies. Nat Med. 2012;18(3):382–384.
- 175 Villanueva A, Newell P, Hoshida Y. Inherited hepatocellular carcinoma. Best Pract Res Clin Gastroenterol. 2010;24(5):725–734.
- 176 Zender L, Spector MS, Xue W, et al. Identification and validation of oncogenes in liver cancer using an integrative oncogenomic approach. Cell. 2006;125(7):1253–1267.
- 177 Ahn SM, Jang SJ, Shim JH, et al. Genomic portrait of resectable hepatocellular carcinomas: implications of RB1 and FGF19 aberrations for patient stratification. Hepatology. 2014;60(6):1972–1982.
- 178 Fujimoto A, Totoki Y, Abe T, et al. Whole-genome sequencing of liver cancers identifies etiological influences on mutation patterns and recurrent mutations in chromatin regulators. Nat Genet. 2012;44(7):760–764.
- 179 Soda M, Choi YL, Enomoto M, et al. Identification of the transforming EML4–ALK fusion gene in non-small-cell lung cancer. Nature. 2007;448(7153):561–566.
- 180 Bardeesy N, DePinho RA. Pancreatic cancer biology and genetics. Nat Rev Cancer. 2002;2(12):897–909.
- 181 Biankin AV, Waddell N, Kassahn KS, et al. Pancreatic cancer genomes reveal aberrations in axon guidance pathway genes. Nature. 2012;491(7424):399–405.
- 182 Jones S, Hruban RH, Kamiyama M, et al. Exomic sequencing identifies PALB2 as a pancreatic cancer susceptibility gene. Science. 2009;324(5924):217.
- 183 Waddell N, Pajic M, Patch AM, et al. Whole genomes redefine the mutational landscape of pancreatic cancer. Nature. 2015;518(7540):495–501.
- 184 Berger MF, Lawrence MS, Demichelis F, et al. The genomic complexity of primary human prostate cancer. Nature. 2011;470(7333):214–220.
- 185 Barbieri CE, Baca SC, Lawrence MS, et al. Exome sequencing identifies recurrent SPOP, FOXA1 and MED12 mutations in prostate cancer. Nat Genet. 2012;44(6):685–689.
- 186 Baca SC, Garraway LA. The genomic landscape of prostate cancer. Front Endocrinol. 2012;3:69.
- 187 Mitchell T, Neal D. The genomic evolution of human prostate cancer. Br J Cancer. 2015;113(2):193.
- 188 Maia S, Cardoso M, Paulo P, et al. The role of germline mutations in the BRCA1/2 and mismatch repair genes in men ascertained for early-onset and/or familial prostate cancer. Familial Cancer. 2015 (Epub ahead of print).
- 189 Kanamori Y, Matsushima M, Minaguchi T, et al. Correlation between expression of the matrix metalloproteinase-1 gene in ovarian cancers and an insertion/deletion polymorphism in its promoter region. Cancer Res. 1999;59(17):4225–4227.
- 190 Sellner LN, Taylor GR. MLPA and MAPH: new techniques for detection of gene deletions. Hum Mutat. 2004;23:413–419.
- 191 Wiegand KC, Shah SP, Al-Agha OM, et al. ARID1A mutations in endometriosis-associated ovarian carcinomas. N Engl J Med. 2010;363(16):1532–1543.
- 192 Jones S, Wang T-L, Shih I-M, et al. Frequent mutations of chromatin remodeling gene ARID1A in ovarian clear cell carcinoma. Science. 2010;330(6001):228–231.
- 193 Siegel RL, Miller KD, Jemal A. Cancer statistics, 2015. CA Cancer J Clin. 2015;65(1):5–29.
- 194 Bollag G, Tsai J, Zhang J, et al. Vemurafenib: the first drug approved for BRAF-mutant cancer. Nat Rev Drug Discov. 2012;11(11):873–886.
- 195 Kwak EL, Bang Y-J, Camidge DR, et al. Anaplastic lymphoma kinase inhibition in non-small-cell lung cancer. N Engl J Med. 2010;363(18):1693–1703.
- 196 Armitage P, Doll R. The age distribution of cancer and a multi-stage theory of carcinogenesis. Br J Cancer. 1954;8(1):1.
- 197 Collins FS, Varmus H. A new initiative on precision medicine. N Engl J Med. 2015;372(9):793–795.
- 198 Kurian AW, Hare EE, Mills MA, et al. Clinical evaluation of a multiple-gene sequencing panel for hereditary cancer risk assessment. J Clin Oncol. 2014;32(19):2001–2009.
- 199 Daly MB, Pilarski R, Axilbund JE, et al. Genetic/familial high-risk assessment: breast and ovarian, version 1.2014. J Natl Compr Cancer Netw. 2014;12(9):1326–1338.
- 200 Morgan JE, Carr IM, Sheridan E, et al. Genetic diagnosis of familial breast cancer using clonal sequencing. Hum Mutat. 2010;31(4):484–491.
- 201 Schroeder C, Stutzmann F, Weber BH, Riess O, Bonin M. High-throughput resequencing in the diagnosis of BRCA1/2 mutations using oligonucleotide resequencing microarrays. Breast Cancer Res Treat. 2010;122(1):287–297.
- 202 Summerer D, Wu H, Haase B, et al. Microarray-based multicycle-enrichment of genomic subsets for targeted next-generation sequencing. Genome Res. 2009;19(9):1616–1621.
- 203 Neveling K, Feenstra I, Gilissen C, et al. A post-hoc comparison of the utility of sanger sequencing and exome sequencing for the diagnosis of heterogeneous diseases. Hum Mutat. 2013;34(12):1721–1726.
- 204 Hagemann IS, O’Neill PK, Erill I, Pfeifer JD. Diagnostic yield of targeted next-generation sequencing in various cancer types: an information-theoretic approach. Cancer Genet. 2015;208(9):441–447.
- 205 Ren R. Mechanisms of BCR-ABL in the pathogenesis of chronic myelogenous leukaemia. Nat Rev Cancer. 2005;5(3):172–183.
- 206 Druker BJ, Talpaz M, Resta DJ, et al. Efficacy and safety of a specific inhibitor of the BCR-ABL tyrosine kinase in chronic myeloid leukemia. N Engl J Med. 2001;344(14):1031–1037.
- 207 Deininger M, Buchdunger E, Druker BJ. The development of imatinib as a therapeutic agent for chronic myeloid leukemia. Blood. 2005;105(7):2640–2653.
- 208 Clark MA, Fisher C, Judson I, Thomas JM. Soft-tissue sarcomas in adults. N Engl J Med. 2005;353(7):701–711.
- 209 van der Zwan SM, DeMatteo RP. Gastrointestinal stromal tumor: 5 years later. Cancer. 2005;104(9):1781–1788.
- 210 Muller AM, Martens UM, Hofmann SC, Bruckner-Tuderman L, Mertelsmann R, Lubbert M. Imatinib mesylate as a novel treatment option for hypereosinophilic syndrome: two case reports and a comprehensive review of the literature. Ann Hematol. 2006;85(1):1–16.
- 211 Kantarjian H, Shah NP, Hochhaus A, et al. Dasatinib versus imatinib in newly diagnosed chronic-phase chronic myeloid leukemia. N Engl J Med. 2010;362(24):2260–2270.
- 212 Guilhot F, Apperley J, Kim D-W, et al. Dasatinib induces significant hematologic and cytogenetic responses in patients with imatinib-resistant or-intolerant chronic myeloid leukemia in accelerated phase. Blood. 2007;109(10):4143–4150.
- 213 Kantarjian HM, Giles F, Gattermann N, et al. Nilotinib (formerly AMN107), a highly selective BCR-ABL tyrosine kinase inhibitor, is effective in patients with Philadelphia chromosome–positive chronic myelogenous leukemia in chronic phase following imatinib resistance and intolerance. Blood. 2007;110(10):3540–3546.
- 214 Marty M, Cognetti F, Maraninchi D, et al. Randomized phase II trial of the efficacy and safety of trastuzumab combined with docetaxel in patients with human epidermal growth factor receptor 2-positive metastatic breast cancer administered as first-line treatment: the M77001 study group. J Clin Oncol. 2005;23(19):4265–4274.
- 215 Buzdar AU, Ibrahim NK, Francis D, et al. Significantly higher pathologic complete remission rate after neoadjuvant therapy with trastuzumab, paclitaxel, and epirubicin chemotherapy: results of a randomized trial in human epidermal growth factor receptor 2-positive operable breast cancer. J Clin Oncol. 2005;23(16):3676–3685.
- 216 Demetri GD, van Oosterom AT, Garrett CR, et al. Efficacy and safety of sunitinib in patients with advanced gastrointestinal stromal tumour after failure of imatinib: a randomised controlled trial. Lancet. 2006;368(9544):1329–1338.
- 217 Motzer RJ, Hutson TE, Tomczak P, et al. Overall survival and updated results for sunitinib compared with interferon alfa in patients with metastatic renal cell carcinoma. J Clin Oncol. 2009;27(22):3584–3590.
- 218 Raymond E, Dahan L, Raoul J-L, et al. Sunitinib malate for the treatment of pancreatic neuroendocrine tumors. N Engl J Med. 2011;364(6):501–513.
- 219 Paez JG, Janne PA, Lee JC, et al. EGFR mutations in lung cancer: correlation with clinical response to gefitinib therapy. Science. 2004;304(5676):1497–1500.
- 220 Lynch TJ, Bell DW, Sordella R, et al. Activating mutations in the epidermal growth factor receptor underlying responsiveness of non-small-cell lung cancer to gefitinib. N Engl J Med. 2004;350(21):2129–2139.
- 221 Camidge DR, Bang Y-J, Kwak EL, et al. Activity and safety of crizotinib in patients with ALK-positive non-small-cell lung cancer: updated results from a phase 1 study. Lancet Oncol. 2012;13(10):1011–1019.
- 222 Shaw AT, Yeap BY, Solomon BJ, et al. Effect of crizotinib on overall survival in patients with advanced non-small-cell lung cancer harbouring ALK gene rearrangement: a retrospective analysis. Lancet Oncol. 2011;12(11):1004–1012.
- 223 Sekulic A, Migden MR, Oro AE, et al. Efficacy and safety of vismodegib in advanced basal-cell carcinoma. N Engl J Med. 2012;366(23):2171–2179.
- 224 Chapman PB, Hauschild A, Robert C, et al. Improved survival with vemurafenib in melanoma with BRAF V600E mutation. N Engl J Med. 2011;364(26):2507–2516.
- 225 Gorre ME, Mohammed M, Ellwood K, et al. Clinical resistance to STI-571 cancer therapy caused by BCR-ABL gene mutation or amplification. Science. 2001;293(5531):876–880.
- 226 Von Hoff DD, Stephenson JJ, Rosen P, et al. Pilot study using molecular profiling of patients’ tumors to find potential targets and select treatments for their refractory cancers. J Clin Oncol. 2010;28(33):4877–4883.
- 227 Craig DW, O’Shaughnessy JA, Kiefer JA, et al. Genome and transcriptome sequencing in prospective metastatic triple-negative breast cancer uncovers therapeutic vulnerabilities. Mol Cancer Ther. 2013;12(1):104–116.
- 228 Prados MD, Byron SA, Tran NL, et al. Toward precision medicine in glioblastoma: the promise and the challenges. Neuro-Oncology. 2015;17(8):1051–1063.
- 229 Borad MJ, Champion MD, Egan JB, et al. Integrated genomic characterization reveals novel, therapeutically relevant drug targets in FGFR and EGFR pathways in sporadic intrahepatic cholangiocarcinoma. PLoS Genet. 2014;10(2):e1004135.
- 230 LoRusso PM, Boerner SA, Pilat MJ, et al. Pilot trial of selecting molecularly guided therapy for patients with non–V600 BRAF-mutant metastatic melanoma: experience of the SU2C/MRA melanoma dream team. Mol Cancer Ther. 2015;14(8):1962–1971.
- 231 Conley BA, Doroshow JH. Molecular analysis for therapy choice: NCI MATCH. Seminars in oncology; 2014: Elsevier.
- 232 Kim ES, Herbst RS, Wistuba II, et al. The BATTLE trial: personalizing therapy for lung cancer. Cancer Discov. 2011;1(1):44–53.
- 233 Saulnier Sholler GL, Bond JP, Bergendahl G, et al. Feasibility of implementing molecular-guided therapy for the treatment of patients with relapsed or refractory neuroblastoma. Cancer Med. 2015;4(6):871–886.
- 234 Barker A, Sigman C, Kelloff G, Hylton N, Berry D, Esserman L. I-SPY 2: an adaptive breast cancer trial design in the setting of neoadjuvant chemotherapy. Clin Pharmacol Ther. 2009;86(1):97–100.
- 235 McCormick JB, Sharp RR, Farrugia G, et al. (eds). Genomic medicine and incidental findings: balancing actionability and patient autonomy. Mayo Clin Proc. 2014;89(6):718–721.
- 236 Diehl F, Schmidt K, Choti MA, et al. Circulating mutant DNA to assess tumor dynamics. Nat Med. 2008;14(9):985–990.
- 237 Dawson SJ, Tsui DW, Murtaza M, et al. Analysis of circulating tumor DNA to monitor metastatic breast cancer. N Engl J Med. 2013;368(13):1199–1209.
- 238 Newman AM, Bratman SV, To J, et al. An ultrasensitive method for quantitating circulating tumor DNA with broad patient coverage. Nat Med. 2014;20(5):548–554.
- 239 Oxnard GR, Paweletz CP, Kuang Y, et al. Noninvasive detection of response and resistance in EGFR-mutant lung cancer using quantitative next-generation genotyping of cell-free plasma DNA. Clinical Cancer Res. 2014;20(6):1698–1705.
- 240 Lipson EJ, Velculescu VE, Pritchard TS, et al. Circulating tumor DNA analysis as a real-time method for monitoring tumor burden in melanoma patients undergoing treatment with immune checkpoint blockade. J Immunother Cancer. 2014;2(1):42.
- 241 McBride DJ, Orpana AK, Sotiriou C, et al. Use of cancer-specific genomic rearrangements to quantify disease burden in plasma from patients with solid tumors. Genes Chromosomes Cancer. 2010;49(11):1062–1069.
- 242 Forshew T, Murtaza M, Parkinson C, et al. Noninvasive identification and monitoring of cancer mutations by targeted deep sequencing of plasma DNA. Sci Transl Med. 2012;4(136):136ra68.
- 243 Kinde I, Wu J, Papadopoulos N, Kinzler KW, Vogelstein B. Detection and quantification of rare mutations with massively parallel sequencing. Proc Natl Acad Sci U S A. 2011;108(23):9530–9535.
- 244 Garcia-Murillas I, Schiavon G, Weigelt B, et al. Mutation tracking in circulating tumor DNA predicts relapse in early breast cancer. Sci Transl Med. 2015;7(302):302ra133.
- 245 Beaver JA, Jelovac D, Balukrishna S, et al. Detection of cancer DNA in plasma of patients with early-stage breast cancer. Clin Cancer Res. 2014;20(10):2643–2650.
- 246 Bettegowda C, Sausen M, Leary RJ, et al. Detection of circulating tumor DNA in early- and late-stage human malignancies. Sci Transl Med. 2014;6(224):224ra24.
- 247 Leary RJ, Sausen M, Kinde I, et al. Detection of chromosomal alterations in the circulation of cancer patients with whole-genome sequencing. Sci Transl Med. 2012;4(162):162ra54.
- 248 Amant F, Verheecke M, Wlodarska I, et al. Presymptomatic identification of cancers in pregnant women during noninvasive prenatal testing. JAMA Oncol. 2015;1(6):814–819.
- 249 Jiang P, Chan CW, Chan KC, et al. Lengthening and shortening of plasma DNA in hepatocellular carcinoma patients. Proc Natl Acad Sci U S A. 2015;112(11):E1317–E1325.
- 250 Chan KC, Jiang P, Zheng YW, et al. Cancer genome scanning in plasma: detection of tumor-associated copy number aberrations, single-nucleotide variants, and tumoral heterogeneity by massively parallel sequencing. Clin Chem. 2013;59(1):211–224.
- 251 Harbst K, Staaf J, Masback A, et al. Multiple metastases from cutaneous malignant melanoma patients may display heterogeneous genomic and epigenomic patterns. Melanoma Res. 2010;20(5):381–391.
- 252 Gerlinger M, Rowan AJ, Horswell S, et al. Intratumor heterogeneity and branched evolution revealed by multiregion sequencing. N Engl J Med. 2012;366(10):883–892.
- 253 Hobor S, Van Emburgh BO, Crowley E, Misale S, Di Nicolantonio F, Bardelli A. TGFalpha and amphiregulin paracrine network promotes resistance to EGFR blockade in colorectal cancer cells. Clin Cancer Res. 2014;20(24):6429–6438.
- 254 Ashworth A, Lord CJ, Reis-Filho JS. Genetic interactions in cancer progression and treatment. Cell. 2011;145(1):30–38.
- 255 Brannon AR, Vakiani E, Sylvester BE, et al. Comparative sequencing analysis reveals high genomic concordance between matched primary and metastatic colorectal cancer lesions. Genome Biol. 2014;15(8):454.
- 256 Papaemmanuil E, Gerstung M, Malcovati L, et al. Clinical and biological implications of driver mutations in myelodysplastic syndromes. Blood. 2013;122(22):3616–3627; quiz 99.
- 257 Gerlinger M, Horswell S, Larkin J, et al. Genomic architecture and evolution of clear cell renal cell carcinomas defined by multiregion sequencing. Nat Genet. 2014;46(3):225–233.
- 258 de Bruin EC, McGranahan N, Mitter R, et al. Spatial and temporal diversity in genomic instability processes defines lung cancer evolution. Science. 2014;346(6206):251–256.
- 259 McGranahan N, Swanton C. Biological and therapeutic impact of intratumor heterogeneity in cancer evolution. Cancer Cell. 2015;27(1):15–26.
- 260 Inda MM, Bonavia R, Mukasa A, et al. Tumor heterogeneity is an active process maintained by a mutant EGFR-induced cytokine circuit in glioblastoma. Genes Dev. 2010;24(16):1731–1745.
- 261 Chapman A, Fernandez del Ama L, Ferguson J, Kamarashev J, Wellbrock C, Hurlstone A. Heterogeneous tumor subpopulations cooperate to drive invasion. Cell Rep. 2014;8(3):688–695.
- 262 Aparicio S, Caldas C. The implications of clonal genome evolution for cancer medicine. N Engl J Med. 2013;368(9):842–851.
- 263 Diaz LA Jr Williams RT, Wu J, et al. The molecular evolution of acquired resistance to targeted EGFR blockade in colorectal cancers. Nature. 2012;486(7404):537–540.
- 264 Siravegna G, Mussolin B, Buscarino M, et al. Clonal evolution and resistance to EGFR blockade in the blood of colorectal cancer patients. Nat Med. 2015;21(7):795–801.
- 265 Murtaza M, Dawson SJ, Tsui DW, et al. Non-invasive analysis of acquired resistance to cancer therapy by sequencing of plasma DNA. Nature. 2013;497(7447):108–112.
- 266 Siegel R, Ma J, Zou Z, Jemal A. Cancer statistics, 2014. CA Cancer J Clin. 2014;64(1):9–29.
- 267 Balch CM, Gershenwald JE, S-j S, et al. Final version of 2009 AJCC melanoma staging and classification. J Clin Oncol. 2009;27(36):6199–6206.
- 268 Coit DG, Andtbacka R, Anker CJ, et al. Melanoma. J Natl Compr Cancer Netw. 2012;10(3):366–400.
- 269 Vultur A, Herlyn M. SnapShot: melanoma. Cancer Cell. 2013;23(5):706–706.e1.
- 270 Goldstein AM, Chan M, Harland M, et al. Features associated with germline CDKN2A mutations: a GenoMEL study of melanoma-prone families from three continents. J Med Genet. 2007;44(2):99–106.
- 271 Hussussian CJ, Struewing JP, Goldstein AM, et al. Germline p16 mutations in familial melanoma. Nat Genet. 1994;8(1):15–21.
- 272 Kamb A, Gruis NA, Weaver-Feldhaus J, et al. A cell cycle regulator potentially involved in genesis of many tumor types. Science. 1994;264(5157):436–440.
- 273 Yokoyama S, Woods SL, Boyle GM, et al. A novel recurrent mutation in MITF predisposes to familial and sporadic melanoma. Nature. 2011;480(7375):99–103.
- 274 Robles-Espinoza CD, Harland M, Ramsay AJ, et al. POT1 loss-of-function variants predispose to familial melanoma. Nat Genet. 2014;46(5):478–481.
- 275 Horn S, Figl A, Rachakonda PS, et al. TERT promoter mutations in familial and sporadic melanoma. Science. 2013;339(6122):959–961.
- 276 Breast Cancer Linkage Consortium. Cancer risks in BRCA2 mutation carriers. J Natl Cancer Inst. 1999;91(15):1310–1316.
- 277 Wiesner T, Obenauf AC, Murali R, et al. Germline mutations in BAP1 predispose to melanocytic tumors. Nat Genet. 2011;43(10):1018–1021.
- 278 Zuo L, Weger J, Yang Q, et al. Germline mutations in the p16INK4a binding domain of CDK4 in familial melanoma. Nat Genet. 1996;12(1):97–99.
- 279 Epstein FH, Gilchrest BA, Eller MS, Geller AC, Yaar M. The pathogenesis of melanoma induced by ultraviolet radiation. N Engl J Med. 1999;340(17):1341–1348.
- 280 Olsen CM, Carroll HJ, Whiteman DC. Estimating the attributable fraction for melanoma: a meta-analysis of pigmentary characteristics and freckling. Int J Cancer. 2010;127(10):2430–2445.
- 281 Mackie R, Freudenberger T, Aitchison T. Personal risk-factor chart for cutaneous melanoma. Lancet. 1989;334(8661):487–490.
- 282 Cust AE, Armstrong BK, Goumas C, et al. Sunbed use during adolescence and early adulthood is associated with increased risk of early-onset melanoma. Int J Cancer. 2011;128(10):2425–2435.
- 283 Landi MT, Bauer J, Pfeiffer RM, et al. MC1R germline variants confer risk for BRAF-mutant melanoma. Science. 2006;313(5786):521–522.
- 284 Chin L. The genetics of malignant melanoma: lessons from mouse and man. Nat Rev Cancer. 2003;3(8):559–570.
- 285 Muthusamy V, Hobbs C, Nogueira C, et al. Amplification of CDK4 and MDM2 in malignant melanoma. Genes Chromosom Cancer. 2006;45(5):447–454.
- 286 Hodi FS, Corless CL, Giobbie-Hurder A, et al. Imatinib for melanomas harboring mutationally activated or amplified KIT arising on mucosal, acral, and chronically sun-damaged skin. J Clin Oncol. 2013;31(26):3182–3190.
- 287 Albino A, Vidal M, McNutt N, et al. Mutation and expression of the p53 gene in human malignant melanoma. Melanoma Res. 1994;4(1):35–45.
- 288 Pollock PM, Trent JM. The genetics of cutaneous melanoma. Clin Lab Med. 2000;20(4):667–690.
- 289 Chin L, Garraway LA, Fisher DE. Malignant melanoma: genetics and therapeutics in the genomic era. Genes Dev. 2006;20(16):2149–2182.
- 290 Patton EE, Widlund HR, Kutok JL, et al. BRAF mutations are sufficient to promote nevi formation and cooperate with p53 in the genesis of melanoma. Curr Biol. 2005;15(3):249–254.
- 291 Willmore-Payne C, Holden JA, Tripp S, Layfield LJ. Human malignant melanoma: detection of BRAF-and c-kit–activating mutations by high-resolution amplicon melting analysis. Hum Pathol. 2005;36(5):486–493.
- 292 Papp T, Pemsel H, Zimmermann R, Bastrop R, Weiss DG, Schiffmann D. Mutational analysis of the N-ras, p53, p16INK4a, CDK4, and MC1R genes in human congenital melanocytic naevi. J Med Genet. 1999;36(8):610–614.
- 293 Demunter A, Stas M, Degreef H, De Wolf-Peeters C, van den Oord JJ. Analysis of N-and K-ras mutations in the distinctive tumor progression phases of melanoma. J Investig Dermatol. 2001;117(6):1483–1489.
- 294 Ackermann J, Frutschi M, Kaloulis K, McKee T, Trumpp A, Beermann F. Metastasizing melanoma formation caused by expression of activated N-RasQ61K on an INK4a-deficient background. Cancer Res. 2005;65(10):4005–4011.
- 295 Maldonado JL, Fridlyand J, Patel H, et al. Determinants of BRAF mutations in primary melanomas. J Natl Cancer Inst. 2003;95(24):1878–1890.
- 296 Uribe P, Wistuba II, González S. BRAF mutation: a frequent event in benign, atypical, and malignant melanocytic lesions of the skin. Am J Dermatopathol. 2003;25(5):365–370.
- 297 Daniotti M, Oggionni M, Ranzani T, et al. BRAF alterations are associated with complex mutational profiles in malignant melanoma. Oncogene. 2004;23(35):5968–5977.
- 298 Kumar R, Angelini S, Snellman E, Hemminki K. BRAF mutations are common somatic events in melanocytic Nevi1. J Investig Dermatol. 2004;122(2):342–348.
- 299 Shinozaki M, Fujimoto A, Morton DL, Hoon DS. Incidence of BRAF oncogene mutation and clinical relevance for primary cutaneous melanomas. Clin Cancer Res. 2004;10(5):1753–1757.
- 300 Libra M, Malaponte G, Navolanic PM, et al. Analysis of BRAF mutation in primary and metastatic melanoma. Cell Cycle. 2005;4(10):1382–1384.
- 301 Pollock P, Walker G, Glendening J, et al. PTEN inactivation is rare in melanoma tumours but occurs frequently in melanoma cell lines. Melanoma Res. 2002;12(6):565–575.
- 302 Goel VK, Lazar AJ, Warneke CL, Redston MS, Haluska FG. Examination of mutations in BRAF, NRAS, and PTEN in primary cutaneous melanoma. J Investig Dermatol. 2006;126(1):154–160.
- 303 Lee J-H, Miele ME, Hicks DJ, et al. KiSS-1, a novel human malignant melanoma metastasis-suppressor gene. J Natl Cancer Inst. 1996;88(23):1731–1737.
- 304 Millikin D, Meese E, Vogelstein B, Witkowski C, Trent J. Loss of heterozygosity for loci on the long arm of chromosome 6 in human malignant melanoma. Cancer Res. 1991;51(20):5449–5453.
- 305 Thompson FH, Emerson J, Olson S, et al. Cytogenetics of 158 patients with regional or disseminated melanoma Subset analysis of near-diploid and simple karyotypes. Cancer Genet Cytogenet. 1995;83(2):93–104.
- 306 Trent JM, Meyskens FL, Salmon SE, et al. Relation of cytogenetic abnormalities and clinical outcome in metastatic melanoma. N Engl J Med. 1990;322(21):1508–1511.
- 307 Trent JM, Rosenfeld SB, Meyskens FL. Chromosome 6q involvement in human malignant melanoma. Cancer Genet Cytogenet. 1983;9(2):177–180.
- 308 Trent JM, Stanbridge EJ, McBride HL, et al. Tumorigenicity in human melanoma cell lines controlled by introduction of human chromosome 6. Science. 1990;247(4942):568–71.
- 309 Trent JM, Thompson FH, Meyskens FL. Identification of a recurring translocation site involving chromosome 6 in human malignant melanoma. Cancer Res. 1989;49(2):420–423.
- 310 Wiltshire RN, Duray P, Bittner ML, et al. Direct visualization of the clonal progression of primary cutaneous melanoma: application of tissue microdissection and comparative genomic hybridization. Cancer Res. 1995;55(18):3954–3957.
- 311 Bastian BC, LeBoit PE, Hamm H, Bröcker E-B, Pinkel D. Chromosomal gains and losses in primary cutaneous melanomas detected by comparative genomic hybridization. Cancer Res. 1998;58(10):2170–2175.
- 312 Beadling C, Jacobson-Dunlop E, Hodi FS, et al. KIT gene mutations and copy number in melanoma subtypes. Clin Cancer Res. 2008;14(21):6821–6828.
- 313 Winnepenninckx V, Lazar V, Michiels S, et al. Gene expression profiling of primary cutaneous melanoma and clinical outcome. J Natl Cancer Inst. 2006;98(7):472–482.
- 314 Kannengiesser C, Spatz A, Michiels S, et al. Gene expression signature associated with BRAF mutations in human primary cutaneous melanomas. Mol Oncol. 2008;1(4):425–430.
- 315 Prickett TD, Wei X, Cardenas-Navia I, et al. Exon capture analysis of G protein-coupled receptors identifies activating mutations in GRM3 in melanoma. Nat Genet. 2011;43(11):1119–1126.
- 316 Berger MF, Hodis E, Heffernan TP, et al. Melanoma genome sequencing reveals frequent PREX2 mutations. Nature. 2012;485(7399):502–506.
- 317 Hodis E, Watson IR, Kryukov GV, et al. A landscape of driver mutations in melanoma. Cell. 2012;150(2):251–263.
- 318 Krauthammer M, Kong Y, Ha BH, et al. Exome sequencing identifies recurrent somatic RAC1 mutations in melanoma. Nat Genet. 2012;44(9):1006–1014.
- 319 Krauthammer M, Kong Y, Bacchiocchi A, et al. Exome sequencing identifies recurrent mutations in NF1 and RASopathy genes in sun-exposed melanomas. Nat Genet. 2015;47(9):996–1002.
- 320 Wei X, Walia V, Lin JC, et al. Exome sequencing identifies GRIN2A as frequently mutated in melanoma. Nat Genet. 2011;43(5):442–446.
- 321 Gartner JJ, Parker SC, Prickett TD, et al. Whole-genome sequencing identifies a recurrent functional synonymous mutation in melanoma. Proc Natl Acad Sci. 2013;110(33):13481–13486.
- 322 Stark MS, Woods SL, Gartside MG, et al. Frequent somatic mutations in MAP3K5 and MAP3K9 in metastatic melanoma identified by exome sequencing. Nat Genet. 2012;44(2):165–169.
- 323 Huang FW, Hodis E, Xu MJ, Kryukov GV, Chin L, Garraway LA. Highly recurrent TERT promoter mutations in human melanoma. Science. 2013;339(6122):957–959.
- 324 Martin M, Maßhöfer L, Temming P, et al. Exome sequencing identifies recurrent somatic mutations in EIF1AX and SF3B1 in uveal melanoma with disomy 3. Nat Genet. 2013;45(8):933–936.
- 325 Harbour JW, Onken MD, Roberson ED, et al. Frequent mutation of BAP1 in metastasizing uveal melanomas. Science. 2010;330(6009):1410–1413.
- 326 Brash DE. UV signature mutations. Photochem Photobiol. 2015;91(1):15–26.
- 327 Furney SJ, Turajlic S, Stamp G, et al. Genome sequencing of mucosal melanomas reveals that they are driven by distinct mechanisms from cutaneous melanoma. J Pathol. 2013;230(3):261–269.
- 328 Furney SJ, Pedersen M, Gentien D, et al. SF3B1 mutations are associated with alternative splicing in uveal melanoma. Cancer Discov. 2013;3(10):1122–1129.
- 329 Cancer Genome Atlas Network. Genomic classification of cutaneous melanoma. Cell. 2015;161(7):1681–1696.
- 330 Harbour JW, Roberson ED, Anbunathan H, Onken MD, Worley LA, Bowcock AM. Recurrent mutations at codon 625 of the splicing factor SF3B1 in uveal melanoma. Nat Genet. 2013;45(2):133–135.
- 331 Lake S, Damato B, Kalirai H, Olohan L, Liu X, Coupland S. Identification of regulators of uveal melanoma metastasis through whole exome sequencing. Invest Ophthalmol Vis Sci. 2013;54(15):4530.
- 332 Furney SJ, Turajlic S, Stamp G, et al. The mutational burden of acral melanoma revealed by whole-genome sequencing and comparative analysis. Pigment Cell Melanoma Res. 2014;27(5):835–838.
- 333 Kuchelmeister C, Schaumburg-Lever G, Garbe C. Acral cutaneous melanoma in caucasians: clinical features, histopathology and prognosis in 112 patients. Br J Dermatol. 2000;143(2):275–280.
- 334 Furney SJ, Turajlic S, Fenwick K, et al. Genomic characterisation of acral melanoma cell lines. Pigment Cell Melanoma Res. 2012;25(4):488–492.
- 335 Turajlic S, Furney SJ, Lambros MB, et al. Whole genome sequencing of matched primary and metastatic acral melanomas. Genome Res. 2012;22(2):196–207.
- 336 Shain AH, Garrido M, Botton T, et al. Exome sequencing of desmoplastic melanoma reveals recurrent NFKBIE promoter mutations and diverse MAPK/PI3K pathway activating mutations. Cancer Res. 2015;75(15 Supplement):2968.
- 337 Hauschild A, Grob JJ, Demidov LV, et al. Dabrafenib in BRAF-mutated metastatic melanoma: a multicentre, open-label, phase 3 randomised controlled trial. Lancet. 2012;380(9839):358–365.
- 338 Flaherty KT, Robert C, Hersey P, et al. Improved survival with MEK inhibition in BRAF-mutated melanoma. N Engl J Med. 2012;367(2):107–114.
- 339 Flaherty KT, Infante JR, Daud A, et al. Combined BRAF and MEK inhibition in melanoma with BRAF V600 mutations. N Engl J Med. 2012;367(18):1694–1703.
- 340 Long GV, Stroyakovskiy D, Gogas H, et al. Dabrafenib and trametinib versus dabrafenib and placebo for Val600 BRAF-mutant melanoma: a multicentre, double-blind, phase 3 randomised controlled trial. Lancet. 2015;386(9992):444–451.
- 341 Falchook GS, Lewis KD, Infante JR, et al. Activity of the oral MEK inhibitor trametinib in patients with advanced melanoma: a phase 1 dose-escalation trial. Lancet Oncol. 2012;13(8):782–789.
- 342 Ascierto PA, Schadendorf D, Berking C, et al. MEK162 for patients with advanced melanoma harbouring NRAS or Val600 BRAF mutations: a non-randomised, open-label phase 2 study. Lancet Oncol. 2013;14(3):249–256.
- 343 Kirkwood JM, Bastholt L, Robert C, et al. Phase II, open-label, randomized trial of the MEK1/2 inhibitor selumetinib as monotherapy versus temozolomide in patients with advanced melanoma. Clin Cancer Res. 2012;18(2):555–567.
- 344 Whittaker SR, Theurillat JP, Van Allen E, et al. A genome-scale RNA interference screen implicates NF1 loss in resistance to RAF inhibition. Cancer Discov. 2013;3(3):350–362.
- 345 Nissan MH, Pratilas CA, Jones AM, et al. Loss of NF1 in cutaneous melanoma is associated with RAS activation and MEK dependence. Cancer Res. 2014;74(8):2340–2350.
- 346 Ranzani M, Alifrangis C, Perna D, et al. BRAF/NRAS wild-type melanoma, NF1 status and sensitivity to trametinib. Pigment Cell Melanoma Res. 2015;28(1):117–119.
- 347 Carvajal RD, Antonescu CR, Wolchok JD, et al. KIT as a therapeutic target in metastatic melanoma. JAMA. 2011;305(22):2327–2334.
- 348 Carvajal RD, Sosman JA, Quevedo JF, et al. Effect of selumetinib vs chemotherapy on progression-free survival in uveal melanoma: a randomized clinical trial. JAMA. 2014;311(23):2397–2405.
- 349 Hodi FS, O’Day SJ, McDermott DF, et al. Improved survival with ipilimumab in patients with metastatic melanoma. N Engl J Med. 2010;363(8):711–723.
- 350 Ribas A, Puzanov I, Dummer R, et al. Pembrolizumab versus investigator-choice chemotherapy for ipilimumab-refractory melanoma (KEYNOTE-002): a randomised, controlled, phase 2 trial. Lancet Oncol. 2015;16(8):908–918.
- 351 Weber JS, D’Angelo SP, Minor D, et al. Nivolumab versus chemotherapy in patients with advanced melanoma who progressed after anti-CTLA-4 treatment (CheckMate 037): a randomised, controlled, open-label, phase 3 trial. Lancet Oncol. 2015;16(4):375–384.
- 352 Nazarian R, Shi H, Wang Q, et al. Melanomas acquire resistance to B-RAF(V600E) inhibition by RTK or N-RAS upregulation. Nature. 2010;468(7326):973–977.
- 353 Wagle N, Emery C, Berger MF, et al. Dissecting therapeutic resistance to RAF inhibition in melanoma by tumor genomic profiling. J Clin Oncol. 2011;29(22):3085–3096.
- 354 Van Allen EM, Wagle N, Sucker A, et al. The genetic landscape of clinical resistance to RAF inhibition in metastatic melanoma. Cancer Discov. 2014;4(1):94–109.
- 355 Shi H, Moriceau G, Kong X, et al. Melanoma whole-exome sequencing identifies (V600E)B-RAF amplification-mediated acquired B-RAF inhibitor resistance. Nat Commun. 2012;3:724.
- 356 Poulikakos PI, Persaud Y, Janakiraman M, et al. RAF inhibitor resistance is mediated by dimerization of aberrantly spliced BRAF(V600E). Nature. 2011;480(7377):387–390.
- 357 Liu D, Liu X, Xing M. Activities of multiple cancer-related pathways are associated with BRAF mutation and predict the resistance to BRAF/MEK inhibitors in melanoma cells. Cell Cycle. 2014;13(2):208–219.
- 358 Gross A, Niemetz-Rahn A, Nonnenmacher A, Tucholski J, Keilholz U, Fusi A. Expression and activity of EGFR in human cutaneous melanoma cell lines and influence of vemurafenib on the EGFR pathway. Target Oncol. 2015;10(1):77–84.
- 359 Johannessen CM, Boehm JS, Kim SY, et al. COT drives resistance to RAF inhibition through MAP kinase pathway reactivation. Nature. 2010;468(7326):968–972.
- 360 Paraiso KH, Xiang Y, Rebecca VW, et al. PTEN loss confers BRAF inhibitor resistance to melanoma cells through the suppression of BIM expression. Cancer Res. 2011;71(7):2750–2760.
- 361 Xing F, Persaud Y, Pratilas CA, et al. Concurrent loss of the PTEN and RB1 tumor suppressors attenuates RAF dependence in melanomas harboring (V600E)BRAF. Oncogene. 2012;31(4):446–457.
- 362 Nazarian RM, Prieto VG, Elder DE, Duncan LM. Melanoma biomarker expression in melanocytic tumor progression: a tissue microarray study. J Cutan Pathol. 2010;37(Suppl 1):41–47.
- 363 Wilson TR, Fridlyand J, Yan Y, et al. Widespread potential for growth-factor-driven resistance to anticancer kinase inhibitors. Nature. 2012;487(7408):505–509.
- 364 Villanueva J, Vultur A, Lee JT, et al. Acquired resistance to BRAF inhibitors mediated by a RAF kinase switch in melanoma can be overcome by cotargeting MEK and IGF-1R/PI3K. Cancer Cell. 2010;18(6):683–695.
- 365 Shi H, Hugo W, Kong X, et al. Acquired resistance and clonal evolution in melanoma during BRAF inhibitor therapy. Cancer Discov. 2014;4(1):80–93.
- 366 Roesch A. Tumor heterogeneity and plasticity as elusive drivers for resistance to MAPK pathway inhibition in melanoma. Oncogene. 2015;34(23):2951–2957.
- 367 Bidard FC, Madic J, Mariani P, et al. Detection rate and prognostic value of circulating tumor cells and circulating tumor DNA in metastatic uveal melanoma. Int J Cancer. 2014;134(5):1207–1213.
- 368 Aung KL, Donald E, Ellison G, et al. Analytical validation of BRAF mutation testing from circulating free DNA using the amplification refractory mutation testing system. JMD. 2014;16(3):343–349.