CHAPTER 78 Vascular Ultrasonography
Physics, Instrumentation, and Clinical Techniques
DESCRIPTION OF TECHNICAL REQUIREMENTS
Physical Principles and Instrumentation in Vascular Ultrasonography
Ultrasound imaging is based on sound propagation in the body and its reflections from scatterers in the tissue and bloodstream, and reflections from interfaces between different tissues (Fig. 78-1). The reason for reflection and scattering is the difference in the mechanical impedances of different tissue and scatterers. The reflected and scattered ultrasound waves are collected with transducer arrays and converted to an image, which reveals the anatomic structures of the body.
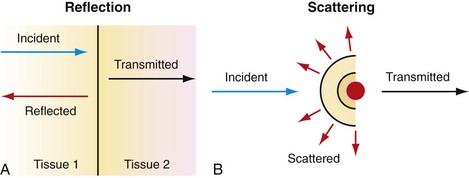
 FIGURE 78-1
Ultrasound transducer arrays are conventionally made of piezoelectric material, which is a special kind of crystal that converts electrical energy into acoustic energy and vice versa. By electronically controlling the hundreds of elements of which the transducer arrays are composed, these arrays can focus, steer, or translate the ultrasound beam. The first step to form an image is to transmit a focused ultrasound beam into the body that travels more or less along a line, and the echoes coming from the reflectors and scatterers along this line are collected by the transducer array. While receiving the echoes, the transducer array is dynamically focused to find the gray-scale value of a pixel on the line—black pixel means there is nothing to reflect ultrasound. This forms an image line. The steps that form an image line are repeated hundreds of times while the beam is translated or steered (or both) from line to line. As shown in Figure 78-2, four basic types of transducers are used in ultrasound imaging, which are classified according to how the image lines are formed: linear sequenced array, curvilinear array, linear phased array, and vector array.1
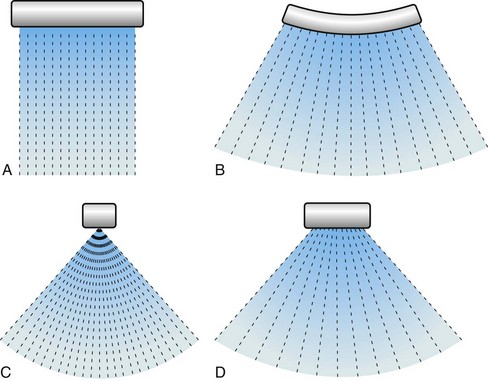
 FIGURE 78-2
The above-described image formation results in the conventional B-mode image, in which strong reflectors are depicted by white pixels, and weak reflectors are depicted as darker shades of gray. In B-mode images, blood appears dark and is considered anechoic mainly because the scatterers in the blood, predominantly red blood cells, are very small and have very low back-scattering coefficients. Vascular ultrasonography makes use of different techniques that enhance signals coming from the bloodstream to be able to image blood flow. First and most widely used of these is Doppler ultrasonography.2–5 In the Doppler technique, the signals coming from moving scatterers are enhanced, whereas stationary echoes are suppressed, which effectively displays blood flow information.
A more recently developed modality used for blood flow imaging is B-flow.6 The appearance of B-flow images is similar to that of B-mode images, and this technique overcomes some of the pitfalls of Doppler ultrasonography. A third modality used for blood flow imaging is contrast-enhanced harmonic imaging. In this modality, contrast agents, which are essentially gas-filled bubbles, are injected into the bloodstream. Contrast agents boost the echogenicity of the blood, and are used to enhance the signal coming from the blood in Doppler ultrasonography and B-flow imaging.
Doppler Ultrasonography
The Doppler effect, named after the Austrian mathematician and physicist Christian A. Doppler (1803-1853) who first hypothesized it, simply states that for a stationary observer, the apparent frequency of a wave emitted from a moving source changes proportional to the relative velocity of the source with respect to the observer (Fig. 78-3 is a conceptual drawing of wave fronts generated by a moving source). In simple terms, relative velocity is the rate of change of the distance between the source and the observer. In that sense, it could be the observer that is moving. The Doppler frequency shift solely depends on the relative velocity regardless of who or what is moving.
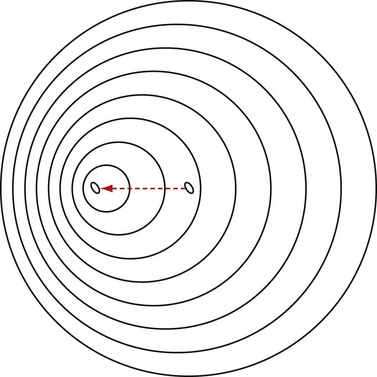
 FIGURE 78-3
Although Doppler developed his hypothesis for light waves, he also noted that the same hypothesis applied to sound waves. The Doppler effect is observed most easily with sound waves because, in the audible range, our ears can hear and detect changes in frequency (pitch). Imagine (or rather remember) a vehicle passing by while honking, or an ambulance, fire truck, or police car with sirens blaring. The pitch of the siren is noted to change while passing by: the siren starts with a high pitch; when getting close, the pitch starts to drop; the siren attains the actual pitch right when passing by and continues to drop thereafter. Figure 78-4 shows a simulated example, in which the solid and dashed curves show the frequency spectrum of the transmitted and received signals.
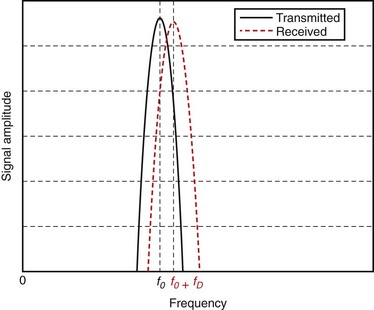
 FIGURE 78-4
In ultrasonography, the Doppler effect is applied to identify tissue motion, blood flow, and vessel structures. The simplest application of Doppler effect in ultrasonography is fetal heart rate monitoring. These devices detect the motion of the fetal heart and convert it into audible sound. More sophisticated Doppler instruments that visualize blood flow and vessel structures are now integrated into most modern ultrasound imaging systems.1
In blood flow imaging, the Doppler signal is generated by blood cells that back-scatter the transmitted ultrasound wave. The back-scattering coefficient of the cells is a quadratic function of their relative size with respect to the wavelength.2 The blood is mostly composed of red and white blood cells and water. In B-mode imaging, blood is almost anechoic because of the very small back-scattering coefficient of blood cells. The echoes coming from the surrounding tissue dominate the image. In Doppler imaging, in which the surrounding tissue is stationary, the moving blood cells generate the Doppler signal. Although white blood cells are larger, red blood cells are more numerous in the blood and generate most of the Doppler flow signal.
The Doppler frequency shift fD is formulated as:
where f0 is the frequency of the transmitted ultrasound wave, vs,r is the relative velocity of the moving target with respect to the transducer, and c is the speed of sound in tissue (on average 1540 m/s); θ is the angle of the direction of the moving target with respect to the transducer. This angle is zero when the target is moving head on toward the transducer, and it is 90 degrees when the target is moving parallel to the transducer surface. The factor 2 comes from the fact that the targets (e.g., blood cells in this case) are reflectors, and the transmitted signal is twice subjected to Doppler shift.
The Doppler signal is proportional to this frequency shift fD. The previous formula captures some of the attributes of Doppler imaging. The Doppler signal is proportional to the transmitted ultrasound frequency, so higher frequencies are preferred. Another reason for preferring higher frequencies is the back-scattering coefficient of blood cells. As mentioned previously, the back-scattering coefficient of cells is a quadratic function of the size of the cells in relation to the wavelength. Because wavelength is inversely proportional to the frequency, using higher ultrasound frequencies (shorter wavelength) increases the back-scattering coefficient significantly. Attenuation in tissue, which is an exponential function of frequency, ultimately limits the frequency and penetration depth, however. Stated in another way, for a target depth, there is always an optimal Doppler frequency dictated by these three factors. The cosine term accounts for the angular dependence of the Doppler signal. It is strongest when the blood flow is parallel to the ultrasound beam, and is zero when the blood flow is at right angles to the ultrasound beam. The Doppler signal is also proportional to the velocity of the blood cells and the number of blood cells in the sample volume interrogated by the ultrasound beam. Because the number of blood cells per unit blood volume is more or less constant, it is the spot volume of the ultrasound beam that determines the strength of the Doppler signal.3
Although we have been talking about Doppler frequency shift, in modern ultrasound systems the phase shift, not the frequency shift, is measured. Making true frequency measurements requires the system to use continuous wave ultrasound signals, which means complete loss of axial resolution for an ultrasound image. Because of this, ultrasound systems now use pulsed wave ultrasound techniques, which measure the phase shift in the received signal using a mathematical process called autocorrelation. This technique is achieved by interrogating the same sample volume multiple times (at least 3, typically 10 to 20 times), and correlating the echoes.1 Because measuring the phase shift is essentially equivalent to measuring the Doppler frequency shift within certain limitations, all the arguments we made before about Doppler frequency shift remain the same.
Continuous Wave Doppler Imaging
The continuous wave Doppler device, which continuously transmits and receives signals, requires two separate sections mounted in the ultrasound probe; one is the transmitting transducer, and the other is the receiving transducer. This is a simple process and it works well when only the magnitude of the Doppler shift frequency is required.7 It does not provide directional information about the flow, however, and does not have any axial resolution. The Doppler signal comes from a large sample volume, which is essentially the intersection of the transmit and receive beams. Vascular structures at different depths are sampled simultaneously.2 The major advantage of this system is that aliasing does not occur, and continuous wave Doppler is more sensitive to slow flow than pulsed Doppler.
Pulsed Wave Doppler Imaging
Color Doppler Imaging
Color Doppler imaging has three major limitations: aliasing, angle dependence, and low frame rate. The pulse repetition frequency (PRF) of the pulses that are used to interrogate each scan line is determined by the depth of interest. The system waits for the echoes from deepest locations to fire the next pulse. The PRF sets the maximum velocity that the system can detect without aliasing. Flows faster than the maximum velocity appear as if flowing in the opposite direction with a different velocity (faster flows are displayed under a different alias). Aliasing can be avoided only with high PRF.1,2
The Doppler shift is angle-dependent by nature. Around 90 degrees of incidence, there is no Doppler shift, and so there is no velocity information to display. Typically, these regions appear black on the screen with opposite flows on both sides. This appearance can be avoided only by looking at the same vessel from an angle so that 90 degrees of incidence is avoided.1,2
The low frame rate of color Doppler imaging is a result of the necessity to interrogate the same scan line multiple times. In contrast to B-mode images, it takes at least 3, and typically 10, times more time to generate a single scan line. The problem with low frame rate for Doppler imaging is that a significant portion of the cardiac cycle appears across the image. That is, by the time the image advances from the first scan line to the last, the body is at a different stage of the cardiac cycle. The color image is not an instantaneous snapshot of blood flow.1 There is no elegant remedy for this problem. One can only reduce the scan area and scan depth, and increase PRF to improve the frame rate.
Power Doppler Imaging
Power Doppler imaging is a flow imaging modality that has gained great popularity in the last decade. At the expense of loss of flow speed, direction, and character information, power Doppler imaging is able to display flow information free of angle dependence and aliasing effects. In simple terms, power Doppler imaging interrogates the power of the flow signal, not its speed and direction. Rather than displaying the Doppler shift spectrum in which each frequency of the spectrum corresponds to a flow speed component, it displays the integrated power of all these components. Because all the flow components are integrated, power Doppler has significantly more signal-to-noise ratio compared with color Doppler. In addition, power Doppler is not affected much by the cardiac cycle, and it is possible to use low PRF values to detect slow flow and averaging to improve signal-to-noise ratio further.1,4 With all these advantages, power Doppler is an excellent tool for imaging vessel structures and imaging small low-flow vessels.
Spectral Doppler Imaging
Spectral Doppler is an imaging modality in which Doppler shift spectrum is not lost and displayed. Because of the extent of the information, it is impossible to display the spectral information for a scan area as in color Doppler. Rather, the spectral Doppler information is displayed only for a point in the image area selected by a gate called range gate.1,3 The spectral Doppler display is a two-dimensional display with time on the x-axis and frequency on the y-axis, so that it displays the Doppler shift spectrum (corresponding to velocity components) as a function of time. Spectral Doppler displays vital information about the type of flow and is used to detect abnormal flow conditions (e.g., caused by plaque or stenoses or punctured vessels).1
B-Flow Imaging
B-flow imaging uses coded excitation to enhance the flow signal, and it equalizes the tissue signal to display tissue and flow signals simultaneously.6 There is no loss of information because of overlaying of images. In addition, coded excitation allows the use of long pulses without degrading the axial resolution, and these pulses are done close to the frame rate of the usual B-mode image.8 In all, B-flow imaging provides a precise depiction of the blood flow, vessel structures, and surrounding tissue simultaneously at the resolution and frame rate of B-mode images. Because of the ability of B-flow to scan at high frame rates, it is also used to visualize the interaction of blood flow with anatomic structures inside the vessel.6
With all the above-mentioned advantages, B-flow imaging allows the depiction of plaque characteristics even better than color Doppler and B-mode imaging, and is useful in carotid imaging. It can also be used to show small venous thrombi as a filling defect of the vessel lumen. It is useful in evaluating complex flow states, such as with bypass grafts, arteriovenous fistulas, pseudoaneurysm, and dialysis fistulas, in which color Doppler artifacts may obscure flow information.9
Contrast-Enhanced Harmonic Imaging
Aside from having a high back-scattering coefficient, ultrasound contrast agents are also known to have a highly nonlinear response.10,11 That is, when excited by an ultrasound beam, the back-scattered echo from a contrast agent contains harmonics of the transmitted signal. Because contrast agents are introduced into the bloodstream and perfuse into the vessel structure completely, contrast-enhanced harmonic imaging is a powerful tool for vascular ultrasonography, and it generated great interest in early tumor angiogenesis detection. One of the pitfalls of harmonic imaging is the harmonic signal generated by the tissue itself. Because contrast agents have a unique nonlinear response, using specific complex pulse sequences that suppress tissue harmonics and enhance contrast agent harmonics mitigates this pitfall.12
