Vascular Pressure Monitoring
After reading this chapter, you will be able to:
1. Describe the following regarding arterial cannulation:
a. Indications for placing an A line
c. Monitoring equipment set-up
d. Procedure for placement of the catheter
e. Interpretation of arterial pressure waveforms
f. Pressures measured and their interpretation
2. Describe the following regarding central venous pressure (CVP) monitoring:
a. Indications for placing a CVP catheter
b. Catheter description and insertion sites
c. Procedure for placement of the catheter
d. Interpretation of the CVP waveform
e. Interpretation of pressures measured
f. Relationship of CVP to left and right ventricular function
3. Describe the following regarding pulmonary artery pressure monitoring:
a. Indications for placing a pulmonary artery catheter
b. Catheter description and insertion sites
c. Procedure for placement of the catheter
d. Interpretation of pulmonary artery waveforms
e. Interpretation of pressures measured
f. Relationship between pulmonary artery diastolic pressure and pulmonary artery wedge pressure (PAWP)
g. Techniques for obtaining an accurate PAWP reading
h. Relationship between transmural pressure and PAWP
i. Effect of positive end-expiratory pressure on PAWP measurements
j. Potential complications of using the pulmonary artery catheter
4. Outline the key interventions recommended to minimize central line–associated bloodstream infections (the central line bundle)
This chapter provides an introduction to the hemodynamic pressures most often monitored invasively in critically ill patients: arterial pressure, CVP, and pulmonary artery pressures (Box 15-1). Indications and complications of invasive monitoring, normal and abnormal pressure waveforms, and clinical applications are discussed.
Box 15-1 The Heart as Two Pumps: An Overview of Hemodynamic Pressure Relationships
< ?xml:namespace prefix = "mml" />


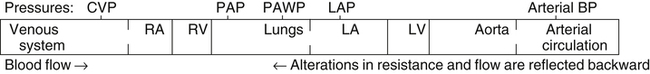
Table 15-1 summarizes the common reference ranges and the abbreviations for the pressures discussed in this chapter. Although intracardiac pressures are essentially the same in adults and children, heart rate and blood pressure vary significantly by age. Table 15-2 lists the common reference ranges for heart rate and blood pressure for children from infancy through 16 years of age. Remember that reference ranges are obtained from studies on healthy people and may be neither normal nor desirable for a specific patient. Nevertheless, knowledge of these reference ranges is essential in the interpretation and application of hemodynamic data.
TABLE 15-1
Reference Ranges for Hemodynamic Pressures
| Pressure | Abbreviation | Normal Value (mm Hg) |
| Arterial pressure | BP | Systolic 100-140 Diastolic 60-90 120/80 (90/60 in teenage girls) |
| Mean arterial pressure | MAP | 70-105 |
| Central venous pressure | CVP | 2-6 (mean) |
| Right atrial pressure | RAP | 2-6 (mean) |
| Right ventricular pressure | RVP | Systolic 15-30 Diastolic 2-8 |
| Right ventricular end-diastolic pressure | RVEDP | 2-6 |
| Pulmonary artery pressure | PAP | Systolic 15-30 Diastolic 8-15 |
| Mean pulmonary artery pressure | MPAP or PAP | 9-18 |
| Pulmonary artery wedge pressure | PAWP, PCWP, PAOP | 6-12 |
| Left atrial pressure | LAP | 4-12 |
| Left ventricular pressure | LVP | Systolic 100-140 Diastolic 0-5 |
| Left ventricular end-diastolic pressure | LVEDP | 5-12 |
TABLE 15-2
Reference Ranges for Heart Rate and Blood Pressure in Children
| Age | Blood Pressure Average for Males (Females 5% Lower) | Heart Rate∗ | |
| Average | Range | ||
| Neonate | 75/50 | 140 | 100-190 |
| 1-6 mo | 80/50 | 145 | 110-190 |
| 6-12 mo | 90/65 | 140 | 110-180 |
| 1-2 yr | 95/65 | 125 | 100-160 |
| 2-6 yr | 100/60 | 100 | 65-130 |
| 6-12 yr | 110/60 | 80 | 55-110 |
| 12-16 yr | 110/65 | 75 | 55-100 |
| Range: ±20% | |||
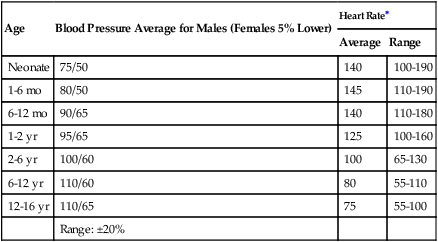
∗Heart rates rounded to nearest 5.
Data from Rubenstein JS, Hageman JR: Monitoring of critically ill infants and children. Crit Care Clin 4:621, 1988.
Arterial Pressure Monitoring
Indications for Arterial Pressure Monitoring
Equipment Set-Up
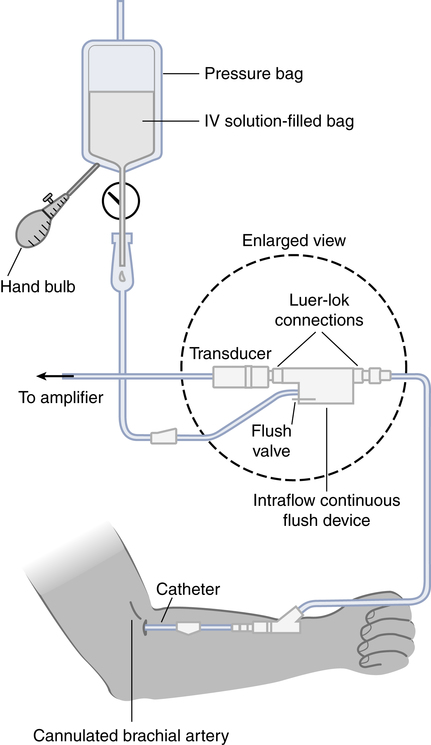
Figure 15-1 shows the basic equipment used for an indwelling vascular line, in this case a brachial artery catheter. Once inserted, the catheter connects to a disposable continuous flush device by low-compliance tubing. The flush device keeps the line open by providing a continuous low flow of fluid (2 to 4 mL/hour) through the system. To maintain continuous flow, the intravenous bag supplying these systems must be pressurized, usually by a hand bulb pump. A pressure transducer, connected to the flush device, provides an electrical signal to an amplifier or monitor, which displays the corresponding pressure waveform. A sampling port (not shown) typically is included to allow blood withdrawal. CVP and pulmonary artery monitoring systems use the same basic set-up.
Procedure for Inserting an Arterial Line
Box 15-2 outlines the key procedural steps for inserting a radial artery line. Note that if the Allen test for collateral circulation is negative, the opposite wrist should be assessed. If collateral circulation cannot be confirmed on either side, the brachial site typically is used.
Arterial Pressure Waveforms
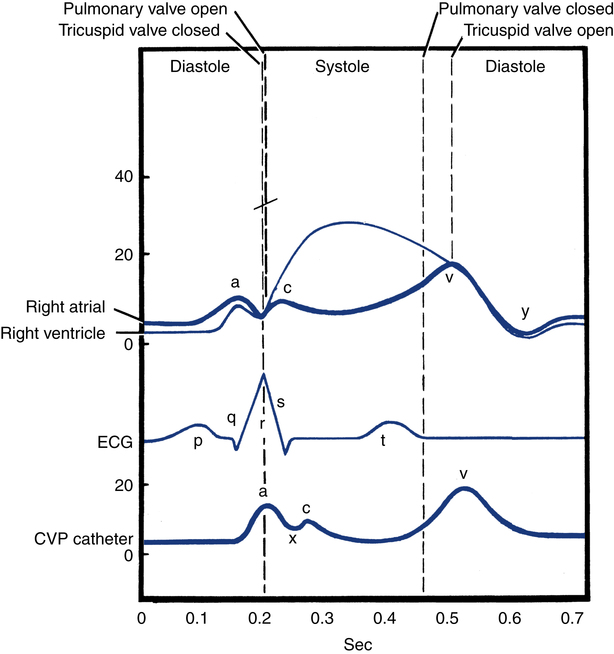
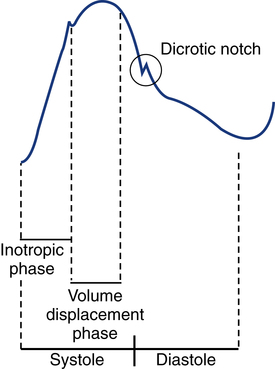
An arterial pressure waveform should have a clear upstroke on the left, with a dicrotic notch representing aortic valve closure on the downstroke to the right (Fig. 15-2). If the dicrotic notch is not visible, the pressure tracing is dampened and probably inaccurate, and the measured pressures likely lower than the patient’s actual values. The dicrotic notch disappears in some patients when the systolic pressure drops below 50 or 60 mm Hg.
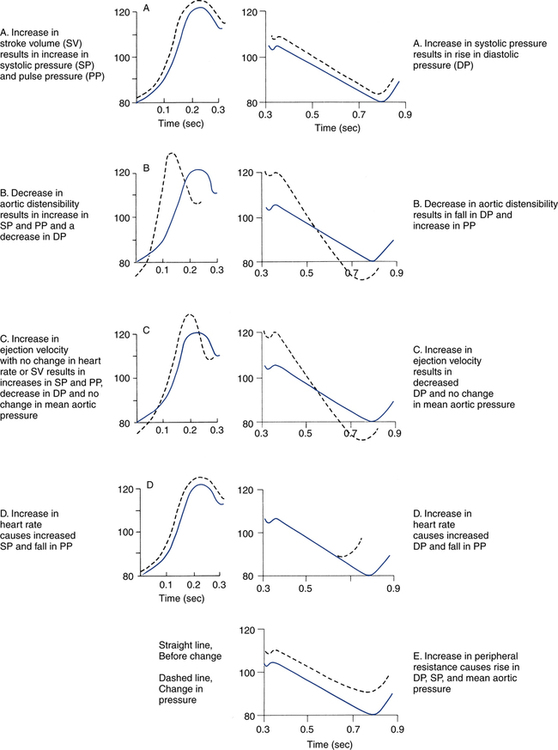
Arterial pressure waves take on many different configurations (Fig. 15-3). The left side of the pressure wave may become straight and even pointed on the top when there is an increase in circulating catecholamines that increase cardiac contractility (a positive inotropic response). A tall, narrow pressure wave is also seen in patients with a stiff aorta due to arteriosclerotic vascular disease. In these patients, the diastolic pressure may also fall, producing an exaggerated tall and narrow complex. Increases in heart rate and vascular resistance increase diastolic pressure. On the other hand, vasodilation decreases vascular resistance and can cause a fall in diastolic pressures. Because approximately 70% of coronary artery perfusion occurs during diastole, coronary artery perfusion may be compromised if the diastolic pressure falls below 50 mm Hg.
Respiratory Variations
Respiratory variations in the arterial pressure waveform normally go unnoticed because arterial pressures are substantially higher than intrathoracic pressure changes during breathing. Also, the monitor scale usually is set to a pressure range of 0 to 300 mm Hg, making changes of 10 mm Hg barely visible. When respiratory variations in the arterial pressure waveform are seen, the possibility of cardiac tamponade or other causes of paradoxical pulse must be considered (see Chapter 4). Increases in arterial pressure during inspiration (reverse pulsus paradoxus) are seen after heart surgery and in patients with left ventricular failure who are mechanically ventilated with techniques that produce high mean airway pressures, such as positive end-expiratory pressure (PEEP). Dysrhythmias and pulsus alternans also cause variations in the height and shapes of the arterial pressure waveform.
Use of Arterial Pressure Waveform to Estimate Cardiac Output
Recently, monitors have been developed that use sophisticated software algorithms to calculate and display continuous beat-to-beat stroke volume and CO based on the shape and area of the arterial pressure waveform. This method is called arterial pulse contour (APC) analysis and is among the most commonly used minimally invasive methods to measure CO in critically ill patients. Chapter 16 provides details on the use of these systems.
Interpretation of Arterial Pressure Measurements
Normal arterial pressure in the adult is approximately 120/80 mm Hg and increases gradually with age. Systolic pressures greater than 140 and diastolic pressures greater than 90 are considered hypertensive (see Chapter 4 for the current classification of hypertension). A pressure below 90/60 mm Hg in adults is termed hypotension.
Arterial pressure decreases in the following circumstances:
• With hypovolemia from fluid or blood loss (most commonly, bleeding)
• During cardiac failure and shock (most commonly, heart attack)
• With vasodilation (most commonly, sepsis or anesthetic agents)
Arterial pressure increases with the following:
• Improvement in circulatory volume and function


Circulation to the vital organs (i.e., kidneys, coronary arteries, and brain) may be compromised when MAP falls below 60 mm Hg. In such cases, the patient may need fluid therapy or medications to increase left ventricular contractility (inotropics) or to increase vascular resistance. Elevated MAP is associated with increased risk for stroke and heart failure. Pharmacologic treatment of elevated MAP may include vasodilators or negative inotropic agents. MAP is used in calculating derived hemodynamic variables such as systemic vascular resistance, left ventricular stroke work, and cardiac work (see Chapter 16).
Central Venous Pressure Monitoring
CVP Catheters and Insertion Sites
The most common central venous catheters are 7-French, triple-lumen catheters with one distal port and two ports 3 to 4 cm from the distal end of the catheter (Fig. 15-4). The multiple-lumen catheter allows infusion of blood and various medications and solutions through different ports and permits aspiration of blood samples or injections for CO measurements without interrupting the infusion of medication. Catheters with walls that are impregnated with antibiotics are less commonly associated with infection than standard catheters.

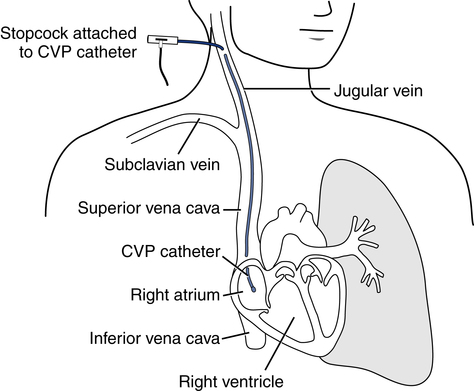
Common sites for introduction of central venous catheters include the subclavian and internal jugular veins (Fig. 15-5). An advantage of the subclavian vein approach is that it results in a much more stable catheter after placement. Disadvantages of the subclavian vein approach are that it is technically more difficult because the vein is harder to find and the catheter guidewire does not follow the subclavian vein as easily as it turns to form the superior vena cava. The subclavian vein is close to the subclavian artery, which is easily punctured, and the mediastinum can hold a fair amount of blood without external evidence of blood loss. The pleural surface is not far below the vein, so pneumothorax is a potential complication of the procedure.
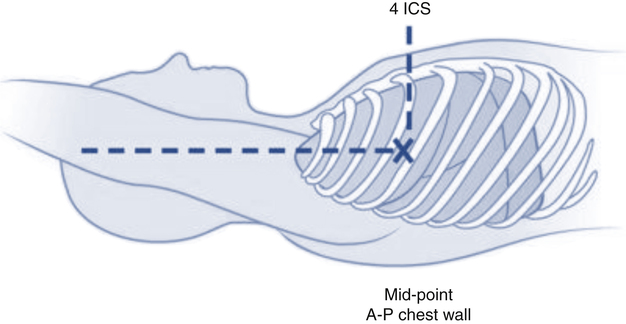
Procedure for Inserting a CVP Catheter
Once inserted and secured, the CVP catheter is attached to a flushed and calibrated monitoring system like that used for pressure measurement through an arterial line (see Fig. 15-1). However, because central venous pressures typically are much lower than arterial pressures, two key differences in the procedure are required. First, the monitor scale for CVP measurement should be set to the low range, typically 0 to 30 mm Hg. Second, to assure accuracy in measurement and interpretation, the pressure transducer must be placed level with the patient’s right atrium, identified externally at the phlebostatic axis. As indicated in Figure 15-6, the phlebostatic axis is located at the intersection of the fourth intercostal space and midaxillary line. Positioning of the transducer below the phlebostatic axis will result in erroneously high CVP readings, whereas positioning the transducer above this level will cause the reading to be lower than the patient’s actual value.