Laboratory Methods and Strategies for Antimicrobial Susceptibility Testing
1. List the relevant factors considered for control and standardization of antimicrobial susceptibility testing.
2. Describe testing conditions (medium, inoculum size, incubation conditions, incubation duration, controls, and purpose) for the broth dilution, agar dilution, and disk diffusion methods.
3. Define a McFarland standard and explain how it is used to standardize susceptibility testing.
4. Explain how end points are determined for the broth dilution, agar dilution, and disk diffusion methods.
5. Define the minimal inhibitory concentration (MIC) break point and identify the types of testing used to determine an MIC.
6. Define peak and trough levels and describe the clinical application for the data associated with each level.
7. Define the susceptible, intermediate, and resistant interpretive categories of antimicrobial susceptibility testing.
8. Outline the basic principles for agar screens, disk screens, and the “D” test for antimicrobial resistance detection, including method, application, and clinical utility.
9. Explain the principle and purpose of the chromogenic cephalosporinase test.
10. Compare and contrast molecular methods to detect resistance mechanisms versus traditional susceptibility testing, including clinical utility, effectiveness, and specificity.
11. Restate the principle of the minimal bactericidal concentration, time-kill assay, serum bactericidal test, and synergy test.
12. Define synergy and indifferent and antagonistic interactions in drug combinations.
13. Define and describe the purpose of drug susceptibility testing as it relates to the use of predictor drugs and organismal identification.
14. List the criteria for determining when to perform susceptibility testing.
15. Describe the purpose of reviewing susceptibility profiles and provide examples of profiles requiring further evaluation.
As discussed in Chapter 11, most clinically relevant bacteria are capable of acquiring and expressing resistance to antimicrobial agents commonly used to treat infections. Therefore, once an organism is isolated in the laboratory, characterization frequently includes tests to detect antimicrobial resistance. In addition to identifying the organism, the antimicrobial susceptibility profile often is a key component of the clinical laboratory report produced for the physician. The procedures used to produce antimicrobial susceptibility profiles and detect resistance to therapeutic agents are referred to as antimicrobial susceptibility testing (AST) methods. The methods applied for profiling aerobic and facultative anaerobic bacteria are the focus of this chapter; strategies for when and how these methods should be applied are also considered. Procedures for antimicrobial susceptibility testing of clinical isolates of anaerobic bacteria and mycobacteria are discussed in Chapters 41 and 43, respectively.
Goal and Limitations
Standardization
For laboratory tests to accurately determine organism-based resistances, the potential influence of environmental factors on antibiotic activity should be minimized (see Chapter 11). This is not to suggest that environmental resistance does not play a clinically relevant role; however, the major focus of the in vitro tests is to measure an organism’s expression of resistance. To control the impact of environmental factors, the conditions for susceptibility testing are extensively standardized. Standardization serves three important purposes:
• It optimizes bacterial growth conditions so that inhibition of growth can be attributed to the antimicrobial agent against which the organism is being tested and is not the result of limitations of nutrient, temperature, or other environmental conditions that may hinder the organism’s growth.
• It optimizes conditions for maintaining antimicrobial integrity and activity; thus, failure to inhibit bacterial growth can be attributed to organism-associated resistance mechanisms rather than to environmental drug inactivation.
• It maintains reproducibility and consistency in the resistance profile of an organism, regardless of the microbiology laboratory performing the test.
Standard conditions for antimicrobial susceptibility testing methods have been established based on numerous laboratory investigations. The procedures, guidelines, and recommendations are published in documents from the Subcommittee on Antimicrobial Susceptibility Testing of the Clinical and Laboratory Standards Institute (CLSI). The CLSI documents that describe various methods of antimicrobial susceptibility testing are continuously updated and may be obtained by contacting CLSI, 940 W. Valley Road, Suite 1400, Wayne, Pennsylvania, 19087. http://www.clsi.org
The standardized components of antimicrobial susceptibility testing include:
Limitations of Standardization
Testing Methods
Principles
Three general methods are available to detect and evaluate antimicrobial susceptibility:
• Methods that directly measure the activity of one or more antimicrobial agents against a bacterial isolate
• Methods that directly detect the presence of a specific resistance mechanism in a bacterial isolate
• Special methods that measure complex antimicrobial-organism interactions
Methods That Directly Measure Antimicrobial Activity
• Conventional susceptibility testing methods such as broth dilution, agar dilution, and disk diffusion
Conventional Testing Methods: General Considerations
Inoculum Preparation.
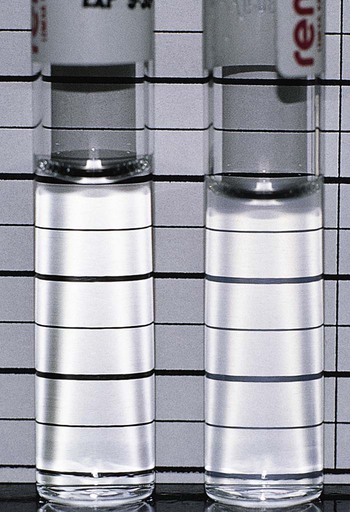
Use of a standard inoculum size is as important as culture purity and is accomplished by comparing the turbidity of the organism suspension with a turbidity standard. McFarland turbidity standards, prepared by mixing 1% sulfuric acid and 1.175% barium chloride to obtain a solution with a specific optical density, are commonly used. The 0.5 McFarland standard, which is commercially available, provides an optical density comparable to the density of a bacterial suspension of 1.5 × 10⁸ colony forming units (CFU) per milliliter. Pure cultures are grown or are prepared directly from agar plates to match the turbidity of the 0.5 McFarland standard (Figure 12-1). The newly inoculated bacterial suspension and the McFarland standard are compared by examining turbidity against a dark background. Alternatively, any one of various commercially available instruments capable of measuring turbidity may be used to standardize the inoculum. If the bacterial suspension does not match the standard’s turbidity, the suspension may be further diluted or supplemented with more organisms as needed.
Selection of Antimicrobial Agents for Testing.
The antimicrobial agents chosen for testing against a particular bacterial isolate are referred to as the antimicrobial battery or panel. A laboratory may use different testing batteries, but the content and application of each battery are based on specific criteria. Although the criteria listed in Box 12-1 influence the selection of the panel’s content, the final decision should not be made by the laboratory independently; input from the medical staff (particularly infectious diseases specialists) and the pharmacy is imperative.
Testing profiles are considered for each of the common organism groupings:
Conventional Testing Methods: Broth Dilution
Procedures.
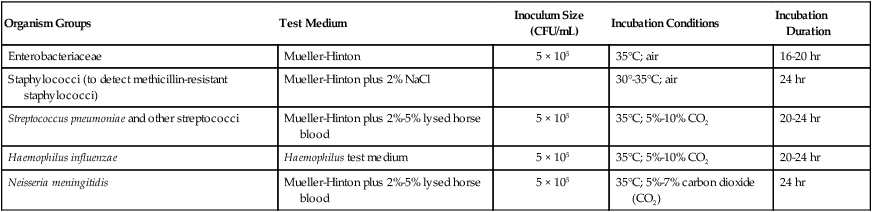
The key features of broth dilution testing procedures are shown in Table 12-1. Because changes are made in these procedural recommendations, the CLSI M07 series, “Methods for Dilution Antimicrobial Susceptibility Tests for Bacteria that Grow Aerobically,” should be consulted annually.
TABLE 12-1
Summary of Broth Dilution Susceptibility Testing Conditions
| Organism Groups | Test Medium | Inoculum Size (CFU/mL) | Incubation Conditions | Incubation Duration |
| Enterobacteriaceae | Mueller-Hinton | 5 × 10⁵ | 35°C; air | 16-20 hr |
| Staphylococci (to detect methicillin-resistant staphylococci) | Mueller-Hinton plus 2% NaCl | 30°-35°C; air | 24 hr | |
| Streptococcus pneumoniae and other streptococci | Mueller-Hinton plus 2%-5% lysed horse blood | 5 × 10⁵ | 35°C; 5%-10% CO2 | 20-24 hr |
| Haemophilus influenzae | Haemophilus test medium | 5 × 10⁵ | 35°C; 5%-10% CO2 | 20-24 hr |
| Neisseria meningitidis | Mueller-Hinton plus 2%-5% lysed horse blood | 5 × 10⁵ | 35°C; 5%-7% carbon dioxide (CO2) | 24 hr |
Medium and Antimicrobial Agents.
With in vitro susceptibility testing methods, certain conditions must be altered when examining fastidious organisms to optimize growth and facilitate expression of bacterial resistance. For example, the Mueller-Hinton preparation is the standard medium used for most broth dilution testing, and conditions in the medium (e.g., pH, cation concentration, thymidine content) are well controlled by commercial manufacturers. However, media supplements or different media are required to obtain good growth and reliable susceptibility profiles for bacteria such as S. pneumoniae and H. influenzae. Although staphylococci are not considered fastidious organisms, media supplemented with sodium chloride (NaCl) enhance the expression and detection of methicillin-resistant isolates (see Table 12-1).
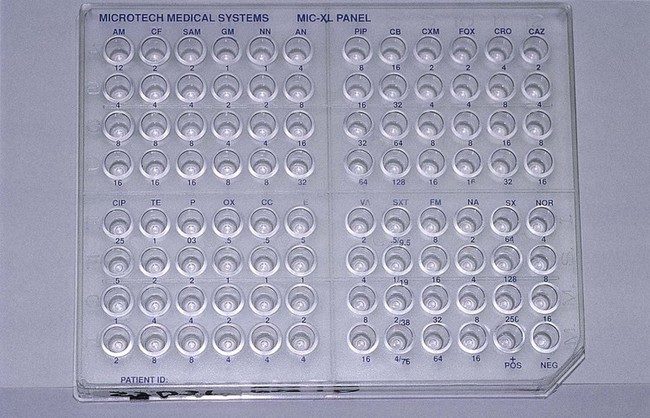
Broth dilution testing is divided into two general categories: microdilution and macrodilution. The principle of each test is the same; the only difference is the volume of broth in which the test is performed. For microdilution testing, the total broth volume is 0.05 to 0.1 mL; for macrodilution testing, the broth volumes are usually 1 mL or greater. Because most susceptibility test batteries require testing of several antibiotics at several different concentrations, the smaller volume used in microdilution allows this to be conveniently accomplished in a single microtiter tray (Figure 12-2).
Inoculation and Incubation.
Standardized bacterial suspensions that match the turbidity of the 0.5 McFarland standard (i.e., 1.5 × 10⁸ CFU/mL) usually serve as the starting point for dilutions ultimately achieving the required final standard bacterial concentration of 5 × 10⁵ CFU/mL in each microtiter well. It is essential to prepare the standard inoculum from a fresh, overnight, pure culture of the test organism. Inoculation of the microdilution panel is accomplished using manual or automated multiprong inoculators calibrated to deliver the precise volume of inoculum to each well in the panel simultaneously (see Figure 12-2).
Inoculated trays are incubated under optimal environmental conditions to optimize bacterial growth without interfering with the antimicrobial activity (i.e., avoiding environmentally mediated results). For the most commonly tested bacteria (e.g., Enterobacteriaceae, P. aeruginosa, staphylococci, and enterococci), the environmental condition consists of room air at 35°C (see Table 12-1). Fastidious bacteria, such as H. influenzae, require incubation in 5% to 10% carbon dioxide (CO2). Similarly, incubation durations for some organisms may need to be extended beyond the usual 16 to 20 hours (see Table 12-1). However, prolonged incubation times beyond recommended limits should be avoided, because antimicrobial deterioration may result in false or elevated resistance patterns. This is a primary factor that limits the ability to perform accurate testing with some slow-growing bacteria.
Reading and Interpretation of Results.
After incubation, the microdilution trays are examined for bacterial growth. Each tray should include a growth control that does not contain antimicrobial agent and a sterility control that was not inoculated. Once growth in the growth control and no growth in the sterility control wells have been confirmed, the growth profiles for each antimicrobial dilution can be established and the MIC determined. The detection of growth in microdilution wells is often augmented through the use of light boxes and reflecting mirrors. When a panel is placed in these devices, bacterial growth, manifested as light to heavy turbidity or a button of growth on the well bottom, is more reliably visualized (Figure 12-3).
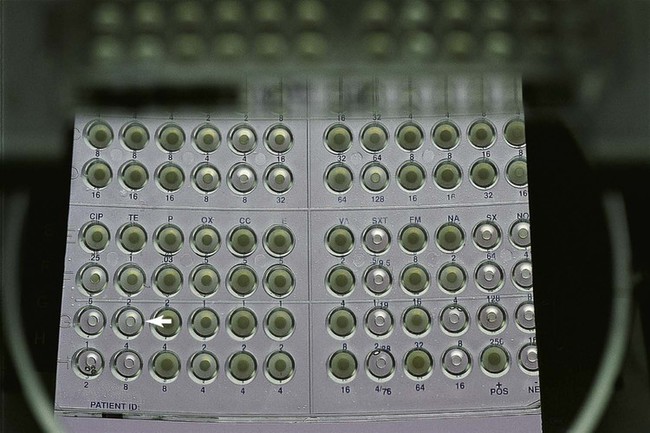
When the dilution series for each antibiotic is inspected, the microdilution well containing the lowest drug concentration that completely inhibits visible bacterial growth is recorded as the MIC. Once the MICs for the antimicrobials in the test battery for an organism have been recorded, they are usually translated into one of the interpretive categories, specifically susceptible, intermediate, or resistant (Box 12-2). The interpretive criteria for these categories are based on extensive studies that correlate the MIC with serum-achievable levels for each antimicrobial agent, particular resistance mechanisms, and successful therapeutic outcomes. The interpretive criteria for an array of antimicrobial agents are published in the CLSI M07 series document, “Methods for Dilution Antimicrobial Susceptibility Tests for Bacteria that Grow Aerobically (M100 supplements).” For example, using these standards, an isolate of P. aeruginosa with an imipenem MIC of less than or equal to 4 µg/mL would be classified as susceptible; one with an MIC of 8 µg/mL would be classified as intermediate; and one with an MIC of 16 µg/mL or greater would be classified as resistant to imipenem.
Conventional Testing Methods: Agar Dilution
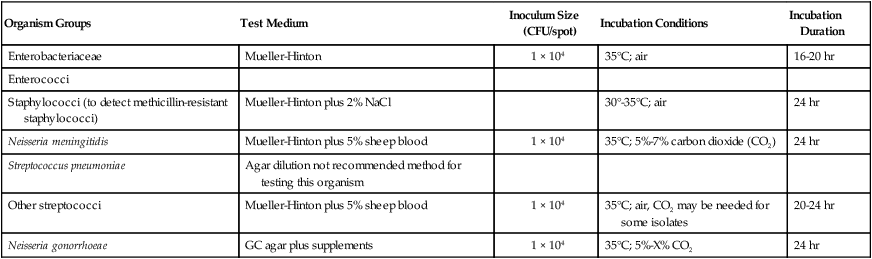
With agar dilution the antimicrobial concentrations and organisms to be tested are brought together on an agar-based medium rather than in liquid broth. Each doubling dilution of an antimicrobial agent is incorporated into a single agar plate; therefore, testing of a series of six dilutions of one drug requires the use of six plates, plus one positive growth control plate without antibiotic. The standard conditions and media for agar dilution testing are shown in Table 12-2. The surface of each plate is inoculated with 1 × 10⁴ CFU (Figure 12-4). This method allows examination of one or more bacterial isolates per plate. After incubation the plates are examined for growth; the MIC is the lowest concentration of an antimicrobial agent in agar that completely inhibits visible growth. The same MIC breakpoints and interpretive categories used for broth dilution are applied for interpretation of agar dilution methods. Similarly, test results may be reported as the MICs only, the category only, or both.
TABLE 12-2
Summary of Agar Dilution Susceptibility Testing Conditions
| Organism Groups | Test Medium | Inoculum Size (CFU/spot) | Incubation Conditions | Incubation Duration |
| Enterobacteriaceae | Mueller-Hinton | 1 × 10⁴ | 35°C; air | 16-20 hr |
| Enterococci | ||||
| Staphylococci (to detect methicillin-resistant staphylococci) | Mueller-Hinton plus 2% NaCl | 30°-35°C; air | 24 hr | |
| Neisseria meningitidis | Mueller-Hinton plus 5% sheep blood | 1 × 10⁴ | 35°C; 5%-7% carbon dioxide (CO2) | 24 hr |
| Streptococcus pneumoniae | Agar dilution not recommended method for testing this organism | |||
| Other streptococci | Mueller-Hinton plus 5% sheep blood | 1 × 10⁴ | 35°C; air, CO2 may be needed for some isolates | 20-24 hr |
| Neisseria gonorrhoeae | GC agar plus supplements | 1 × 10⁴ | 35°C; 5%-X% CO2 | 24 hr |

Conventional Testing Methods: Disk Diffusion
As more antimicrobial agents were created to treat bacterial infections, the limitations of the macrobroth dilution method became apparent. Before microdilution technology became widely available, it became clear that a more practical and convenient method of testing multiple antimicrobial agents against bacterial strains was needed. Out of this need the disk diffusion test was developed, emerging from the landmark study by Bauer et al.1 in 1966. These investigators standardized and correlated the use of antibiotic-impregnated filter paper disks (i.e., antibiotic disks) with MICs using many bacterial strains. With the disk diffusion susceptibility test, antimicrobial resistance is detected by challenging bacterial isolates with antibiotic disks placed on the surface of an agar plate that has been seeded with a lawn of bacteria (Figure 12-5).
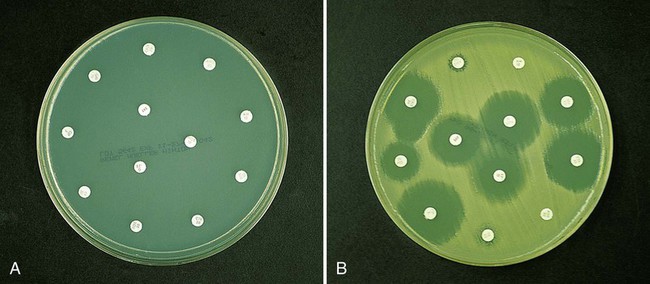
When disks containing a known concentration of antimicrobial agent are placed on the surface of a freshly inoculated plate, the agent immediately begins to diffuse into the agar and establish a concentration gradient around the paper disk. The highest concentration is closest to the disk. Upon incubation, the bacteria grow on the surface of the plate except where the antibiotic concentration in the gradient around each disk is sufficiently high to inhibit growth. After incubation, the diameter of the zone of inhibition around each disk is measured in millimeters (see Figure 12-5).
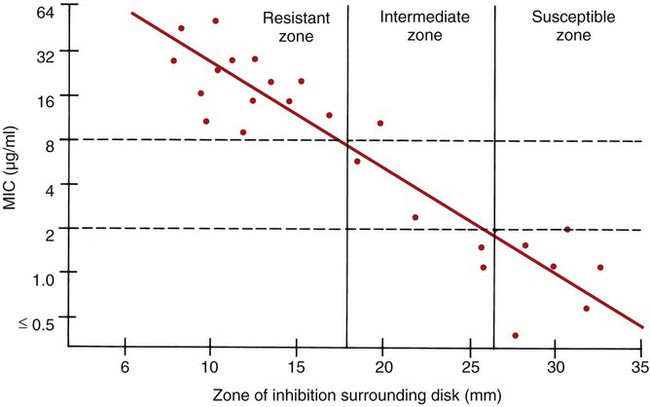
To establish reference inhibitory zone–size breakpoints to define the susceptible, intermediate, and resistant categories for each antimicrobial agent/bacterial species combination, hundreds of strains are tested. The inhibition zone sizes obtained are then correlated with MICs obtained by broth or agar dilution, and a regression analysis is completed comparing the zone size in millimeters against the MIC (Figure 12-6). As the MICs of the bacterial strains tested increase (i.e., the more resistant bacterial strains), the corresponding inhibition zone sizes (i.e., diameters) decrease. Using Figure 12-6 to illustrate, horizontal lines are drawn from the MIC resistant breakpoint and the susceptible MIC breakpoint, 8 µg/mL and 2 µg/mL, respectively. Where the horizontal lines intersect the regression line, vertical lines are drawn to delineate the corresponding inhibitory zone size breakpoints (in millimeters). Using this approach, zone size interpretive criteria have been established for most of the commonly tested antimicrobial agents and are published in the CLSI M02 series, “Performance Standards for Antimicrobial Disk Susceptibility Tests.”
Procedures.
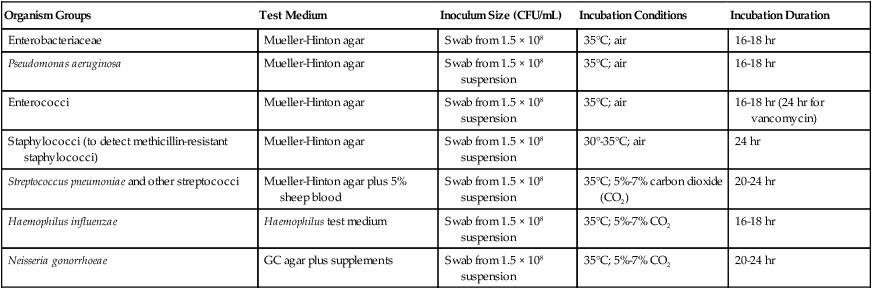
The key features of disk diffusion testing procedures are summarized in Table 12-3, with more details and updates available through CLSI.
TABLE 12-3
Summary of Disk Diffusion Susceptibility Testing Conditions
| Organism Groups | Test Medium | Inoculum Size (CFU/mL) | Incubation Conditions | Incubation Duration |
| Enterobacteriaceae | Mueller-Hinton agar | Swab from 1.5 × 10⁸ | 35°C; air | 16-18 hr |
| Pseudomonas aeruginosa | Mueller-Hinton agar | Swab from 1.5 × 10⁸ suspension | 35°C; air | 16-18 hr |
| Enterococci | Mueller-Hinton agar | Swab from 1.5 × 10⁸ suspension | 35°C; air | 16-18 hr (24 hr for vancomycin) |
| Staphylococci (to detect methicillin-resistant staphylococci) | Mueller-Hinton agar | Swab from 1.5 × 10⁸ suspension | 30°-35°C; air | 24 hr |
| Streptococcus pneumoniae and other streptococci | Mueller-Hinton agar plus 5% sheep blood | Swab from 1.5 × 10⁸ suspension | 35°C; 5%-7% carbon dioxide (CO2) | 20-24 hr |
| Haemophilus influenzae | Haemophilus test medium | Swab from 1.5 × 10⁸ suspension | 35°C; 5%-7% CO2 | 16-18 hr |
| Neisseria gonorrhoeae | GC agar plus supplements | Swab from 1.5 × 10⁸ suspension | 35°C; 5%-7% CO2 | 20-24 hr |
Medium and Antimicrobial Agents.
To ensure equal diffusion of the drug into the agar, the disks must be placed flat on the surface and be firmly applied to ensure adhesion. This is most easily accomplished by using any one of several disk dispensers that are available through commercial disk manufacturers. With these dispensers, all disks in the test battery are simultaneously delivered to the inoculated agar surface and are adequately spaced to minimize the chances for inhibition zone overlap and significant interactions between antimicrobials. In most instances, a maximum of 12 antibiotic disks may be applied to the surface of a single 150-mm Mueller-Hinton agar plate (see Figure 12-5).
Inoculation and Incubation.
Most organisms are incubated at 35°C in room air, but increased CO2 is used for testing of specific fastidious bacteria (see Table 12-3). Similarly, the incubation time may be increased beyond 16 hours to enhance detection of certain resistance patterns (e.g., methicillin resistance in staphylococci and vancomycin resistance in enterococci) and to ensure accurate results in general for fastidious organisms such as N. gonorrhoeae.
Reading and Interpretation of Results.
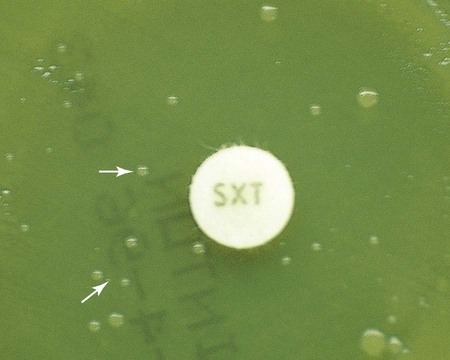
Before results with individual antimicrobial agent disks are read, the plate is examined to confirm that a confluent lawn of growth has been obtained (see Figure 12-5). If growth between inhibitory zones around each disk is poor and nonconfluent, the test should not be interpreted and should be repeated. The lack of confluent growth may be due to insufficient inoculum. Alternatively, a particular isolate may have undergone mutation, and growth factors supplied by the standard medium are no longer sufficient to support robust growth. In the latter case, medium supplemented with blood and/or incubation in CO2 may enhance growth. However, caution in interpreting results is required when extraordinary measures are used to obtain good growth and the standard medium recommended for testing a particular type of organism is not used. Plates should also be examined for purity. Mixed cultures are evident through the appearance of different colony morphologies scattered throughout the lawn of bacteria (Figure 12-7). Mixed cultures require purification and repeat testing.
A dark background and reflected light are used to examine a disk diffusion plate (Figure 12-8
Related posts:
 Upper Respiratory Tract Infections and Other Infections of the Oral Cavity and Neck
 Infections of the Eyes, Ears, and Sinuses
 Cell Wall–Deficient Bacteria: Mycoplasma and Ureaplasma
 Intestinal Cestodes
 Laboratory Methods for Diagnosis of Parasitic Infections: Overview
 Normally Sterile Body Fluids, Bone and Bone Marrow, and Solid Tissues
