CHAPTER 32 Coronary Calcium Assessment
IMPORTANCE OF CALCIUM IN IDENTIFYING CORONARY HEART DISEASE
In 2004, more than 15.8 million individuals in the United States developed CAD, and more than 450,000 died.1 Of the estimated 700,000 Americans who are expected to experience an acute coronary event this year, only 50% will have a prior history of CAD. About 17% of individuals who die of an acute coronary event are younger than 65 years. The estimated economic loss from coronary heart disease in 2007 was estimated to be greater than $151.6 billion, making CAD the largest single component of U.S. health care expenditures.
PATHOPHYSIOLOGY
Atherosclerotic Plaque Development
Coronary atherosclerotic plaque development begins early in life and is characterized by the accumulation of lipid-laden macrophages within the intima of arterial walls.2 With increasing accumulations, the lesions often progress to Stary type IV and type V atheroma, which are well-developed plaques characterized by intramural collections of cholesterol and phospholipids. These lipid collections are often covered by a thin, fibrous cap (fibroatheroma). Because of remodeling, the lesions initially have little significant luminal narrowing and are often undetected by angiography. Two thirds of individuals with acute myocardial infarctions or unstable angina have only minimal angiographic narrowing at the culprit site of occlusion. Myocardial perfusion studies that attempt to identify the hemodynamic effects of coronary stenoses may be normal and often underestimate an individual’s risk for a cardiac event.
A strong correlation has been found between the quantitative measurements of coronary artery calcium and pathologic measurements of plaque area and volume. Rumberger and colleagues3 showed that calcium is identifiable by CT when plaque area measures 5 to 10 mm2 per 3-mm-thick voxel. It has been established that as calcium increases, so does the likelihood of hemodynamically significant stenoses. Heavy concentrations of calcium suggest a greater atherosclerotic burden and a greater likelihood of hemodynamically significant stenoses. Supporting this concept is an article by Kragel and associates,4 who reported that atherosclerotic plaques associated with significant stenosis often contain more calcium than nonobstructive plaques.
Autopsy studies have shown that large CAC burdens correlate with greater likelihoods of significant arterial luminal narrowing, especially when distributed over multiple vessels. One such study was by Mautner and coworkers,5 who examined 1298 segments from 50 heart specimens and observed that 93% of arteries with stenoses greater than 75% had CAC. Conversely, only 14% of arteries with stenoses less than 25% were associated with calcification. Many other studies have shown that heavier CAC burdens were strongly associated with significant stenoses on angiography and with overall poorer patient outcomes. Calcium measurements derived from CT cannot predict site-specific stenoses. CAC measurements cannot be used to predict the site or the severity of the stenoses.6
Coronary calcium is a frequent constituent of vulnerable and hard plaques, and the presence and quantity of CAC correlate well with the overall severity of the atherosclerotic process, and make these lesions potentially identifiable by traditional noninvasive methods, such as fluoroscopy and CT. There are no diagnostic tests that can identify a priori vulnerable plaques that are susceptible to rupture. Postmortem analysis of coronary arteries of adults with sudden cardiac death have shown that histologically determined calcium scores for stable and ruptured plaques were similar (4.5 vs. 5.2).7 Despite this, plaque calcification is frequently present in most patients who have acute plaque disruption and sudden death. In addition, intravascular ultrasound examinations performed on patients with acute cardiac events (infarct or unstable angina) have shown that vulnerable plaques tend to be associated with less calcification than plaques found in patients with stable angina, and that moderate levels of coronary calcium portend a greater number of vulnerable plaques and a subsequent higher risk for sudden death. Complicating this issue further is evidence suggesting that small to moderate amounts of calcium within plaque may be associated with a more unstable plaque configuration, which may facilitate their eventual rupture, and may make plaques less tolerable to shear stresses and promote endothelial lining disruption.
IMAGING OF CORONARY ARTERY CALCIUM
CT imaging of small deposits of coronary calcium became available in the 1980s with the development of the electron-beam CT scanner. The electron-beam CT scanner has now been superseded by multidetector CT scanners, and few electron-beam CT scanners continue in operation. Multidetector CT scanners initially had a single detector ring technology, but now have progressed to dual source and 64-detector to 256-detector ring technology. Much of today’s coronary calcium imaging is being done on dual source and 64-detector CT scanners (Fig. 32-1).
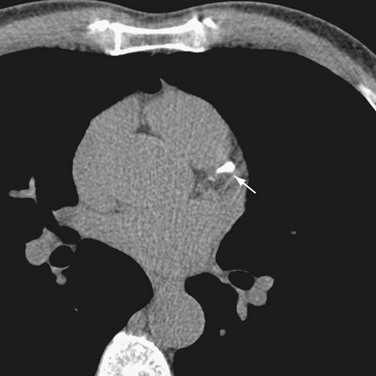
 FIGURE 32-1 A 64-row multidetector CT image of a calcification (arrow) in the left anterior descending coronary artery.
Calcium Score Reporting
Calcium scores are reported using the Agatston score, volume score, and mass score.8 The Agatston score was the initial reporting score and is used in much of the older literature. It used electron-beam CT technology to identify lesions with a threshold of +130 Hounsfield units (HU) and 2 to 3 contiguous pixels located over the course of the coronary artery. To calculate the score, a region of interest is placed around each lesion, and the area of the lesion is multiplied by a weighted factor of 1 to 4 based on the peak signal anywhere in the lesion. A weighted factor of 1 is used for a peak calcification of 130 to 199 HU; 2, for a peak calcification of 200 to 299 HU; 3, for a peak calcification of 300 to 399 HU; and 4, for a peak calcification of greater than 400 HU.
The volume score linearly interpolates the data for isotropic volumes and represents the volume (in mm3) of each lesion above the 130 HU threshold. Lesions with similar area but differing amounts of calcium may have different volume scores.8
Rumberger and Kaufman8 reviewed the Agatston, volume, and mass scores, and found equivalence of the three CAC scoring methods for stratification of their cohort of 11,490 individuals who had undergone electron-beam CT. Likewise, comparable agreement was found among the three CAC scoring methods over successive electron-beam CT scans. Based on phantom experiments, however, these investigators reported nonlinearity of the Agatston and volume scores with the volume score overestimating lesion volume. Using the same phantoms, mass scores were found to be linear with a few exceptions.
Standardization of Computed Tomography Scanners
To ensure that calcium scores are meaningful, it is important that CT scanners and protocols are standardized so that scores from one scanner can be compared with another. Toward that end, the Physics Task Group of the International Consortium on Standardization in Cardiac CT was formed.9 Using a phantom with inserts of calcium and water density material embedded in an epoxy anthropomorphic body torso, scanning algorithms for all five commercially available scanners were developed (Fig. 32-2). The manufacturers included were Toshiba, Imatron, General Electric, Phillips, and Siemens.
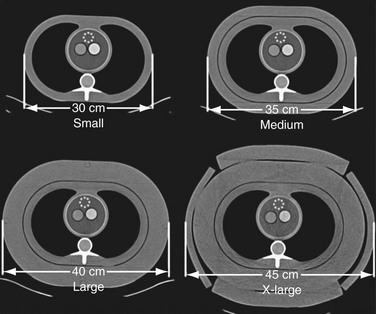
 FIGURE 32-2