Interpretation of Electrocardiogram Tracings
After reading this chapter, you will be able to:
1. Describe the clinical value of the electrocardiogram (ECG).
2. Describe the clinical findings that indicate the need for an ECG recording.
3. Identify the key components of the electrical conduction system of the heart and the role of each component.
4. Define depolarization and repolarization.
5. Describe the specific electrical activity of the heart associated with each wave and interval of the normal ECG.
6. Identify the normal values for the PR interval and the QRS complex.
7. Identify the ventricular rate and position of the mean QRS vector from an ECG recording.
8. List the steps for ECG interpretation.
9. Describe the ECG criteria for each of the following abnormalities:
d. Premature atrial contraction
g. Premature ventricular contractions
k. First-, second-, and third-degree atrioventricular (AV) block
10. Describe the ECG abnormalities associated with chronic lung disease.
11. Identify ischemia, injury, and infarction using the 12-lead ECG tracing.
12. Explain how to assess and help treat patients with chest pain.
When Should an Electrocardiogram Be Obtained?
Because an ECG is noninvasive and does not present a risk to the patient, it is reasonable to obtain an ECG when the patient has signs and symptoms suggestive of an acute or chronic cardiac disorder such as myocardial infarction or congestive heart failure (CHF) (Box 11-1). An ECG is often used as an assessment tool to help determine the patient’s general health status or as a screening tool before major surgery. An ECG is especially helpful in this situation if the patient is older or has a history of heart disease. If an abnormality is identified early, treatment can be promptly started, thus potentially improving the longer term prognosis. Of course, the process of obtaining the ECG should never delay the initiation of critically needed care such as oxygen therapy, airway placement, or cardiopulmonary resuscitation (CPR).
Cardiac Anatomy and Physiology
Before discussing the interpretation of ECGs, it is important to review the cardiac anatomy and physiology related to electrical activity within the heart. The heart is made up of four chambers: two upper chambers called atria and two lower chambers called ventricles (Fig. 11-1). The heart typically is described as having two sides, the right and the left. The right atrium receives deoxygenated blood from the venae cavae and directs the blood into the right ventricle. Right ventricular contraction ejects blood into the pulmonary artery, which carries blood to the lungs for oxygenation. The oxygenated blood returns to the left atrium of the heart via the pulmonary veins, where it is directed into the left ventricle. Left ventricular contraction ejects blood into the aorta, which branches off into the systemic circulation. Since the left side of the heart pumps blood throughout the entire body, it normally has a significantly larger muscle mass than the right side.
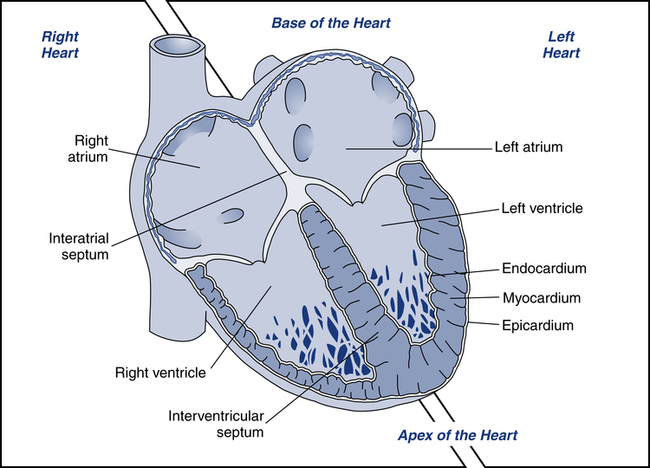
Cardiac muscle is referred to as the myocardium. Myocardial contraction occurs as a response to electrical stimulation. For the heart to move blood effectively, stimulation of the myocardium must be coordinated. Initiating and coordinating the electrical stimulation of the myocardium is the responsibility of the electrical conduction system, which is made up of special pacemaker and conducting cells (Table 11-1).
TABLE 11-1
| Pacemaker cells | Specialized cells that have an extensive ability to generate their own electrical activity (automaticity) and provide the electrical power for the heart |
| Conducting cells | Cells that conduct the electrical impulse throughout the heart |
| Myocardial cells | Cells that contract in response to electrical stimuli and pump the blood |
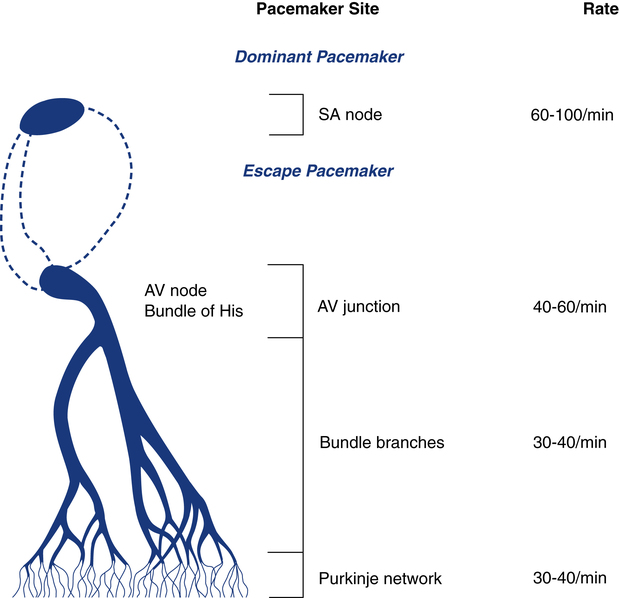
Normally, the electrical activity of the heart is initiated in the sinus node, also known as the sinoatrial (SA) node located in the right atrium (Fig. 11-2). The SA node is a collection of specialized cells capable of spontaneously generating electrical signals. Cells that have the ability to generate electrical activity spontaneously are said to have automaticity. Because the SA node normally has the greatest degree of automaticity of all the cardiac cells, it usually controls the rate at which the heart beats. In this way, the SA node serves as the primary pacemaker of the heart, discharging at about 60 to 100 beats/min at rest.
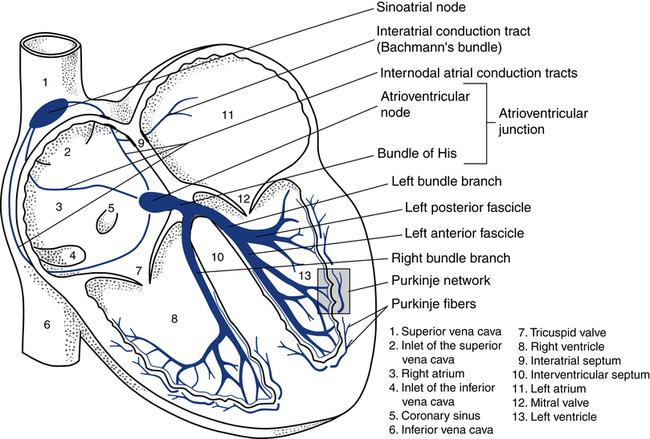
After the electrical impulse passes through the atria, it reaches the atrioventricular (AV) junction. This junction acts as an electrical bridge between the atria and the ventricles. The AV junction contains the AV node and the bundle of His (see Fig. 11-2). Once the electrical impulse reaches the AV node, it is delayed for approximately 0.1 second before passing on into the bundle of His. The delay is believed to serve the purpose of allowing more complete filling of the ventricles before ventricular contraction, further adding to the atrial kick. In addition, the AV node can protect the ventricles from excessively rapid atrial rates that the ventricles could not tolerate. Damage to the AV junction, as may occur with a myocardial infarction, usually leads to excessive delays of the electrical impulse passing into the ventricles. This causes a condition known as heart block.
The AV junction normally guides only the electrical impulse from the atria into the ventricles. Under certain circumstances, however, it can also serve as the backup pacemaker. The AV junction has automaticity qualities similar to those of the SA node. If the SA node fails to function properly and does not pace the heart, the AV junction can serve as the pacemaker for the ventricles. When this occurs, the ventricular rate is usually between 40 and 60 beats/min and the ECG reveals a distinct pattern, described later in this chapter (Fig. 11-3).
After the electrical impulse leaves the AV node, it travels rapidly through the bundle of His and then into the left and right bundle branches (see Fig. 11-2). The stimulus travels simultaneously through the bundle branches into the myocardium. At the end of the bundle branches are countless fingerlike projections called Purkinje fibers. The Purkinje fibers pass the electrical impulse rapidly throughout the myocardium to create a coordinated contraction of the left and right ventricles.
Causes and Manifestations of Dysrhythmias
• Hypoxia: Hypoxia results from inadequate delivery of oxygen to the heart muscle or myocardium, and may be caused by hypoxemia or low blood flow known as ischemia. Inadequate delivery may be caused by reduced arterial oxygen levels, reduced hemoglobin levels, reduced perfusion (blood flow), or a combination of such factors.
• Ischemia: Ischemia is low blood flow, which can lead to cardiac tissue hypoxia further resulting in myocardial injury and infarction. Myocardial cells deprived of oxygen do not conduct nor contract well.
• Sympathetic stimulation: Physical or emotional stress from fear or anxiety and conditions, such as hyperthyroidism and CHF, can elicit dysrhythmias. Sympathetic stimulation can also result in cardiac ischemia caused by an increased workload on the myocardium without concurrent increase in blood flow such as in the case of diseased coronary arteries.
• Drugs: Many prescribed medications taken in nontherapeutic ranges or in the presence of inadequate biotransformation or clearance may produce dysrhythmias. Illegal use of sympathomimetic agents, such as cocaine or methylphenidate (Ritalin), may cause myocardial irritability and even infarction.
• Electrolyte imbalances: Electrical activity in the heart results from the exchange of electrolytes within cardiac tissue, known as the action potential. As a result, abnormal serum concentrations of electrolytes, such as potassium, magnesium, and calcium, can cause dysrhythmias.
• Hypertrophy: Overdevelopment of the heart muscle due to a genetic disorder or a consequence of increased workload on the myocardium (e.g., pulmonary and/or systemic vaso-constriction), resulting in smaller heart chambers and/or abnormal pumping action.
• Rate: Rhythms that are too slow or too fast result in inadequate cardiac output. Cardiac output is a product of stroke volume and cardiac rate. Stroke volume is the volume of blood pumped by one ventricle during one beat. Therefore, if the heart rate is too slow and the stroke volume is not increased proportionally, the cardiac output will be reduced. On the other hand, if the heart rate is too fast, the ventricles do not have enough time to fill with blood and stroke volume may be significantly reduced, resulting in poor cardiac output.
• Stretch: How much the atrium or ventricle stretches open so it can fill and then contract. With all else equal, greater stretch is associated with more stroke volume according to Frank Starling’s Law.
Important Abbreviations and Acronyms
Before coming in contact with a patient, the RT will receive a verbal report from the RT from the preceding shift regarding the patient’s clinical status and notable aspects of their medical record (see Chapter 21). It is important to understand the meaning of descriptive terms, abbreviations, and acronyms related to cardiology and ECG interpretation that may be presented while receiving a report or reviewing the medical record. Table 11-2 provides a list of some of the most common cardiology abbreviations and acronyms that may assist in the assessment of the patient’s underlying disease process or cardiac conduction abnormalities.
TABLE 11-2
Common Cardiology Abbreviations
| AIJR | Accelerated idiojunctional rhythm |
| AIVR | Accelerated idioventricular rhythm |
| ARP | Absolute refractory period |
| A-tach | Atrial tachycardia |
| AV | Atrioventricular |
| BBB | Bundle branch block |
| bpm | Beats per minute |
| BVH | Biventricular hypertrophy |
| CABG | Coronary artery bypass graft |
| CAD | Coronary artery disease |
| CK-MB | Creatine kinase-myocardial band |
| CO | Cardiac output |
| CV | Cardiovascular |
| ECG | Electrocardiogram |
| EF | Ejection fraction |
| EKG | Electrocardiogram (German abbreviation) |
| EMD | Electromechanical dissociation (see PEA) |
| EP | Electrophysiologic |
| f wave | Fibrillatory wave |
| F wave | Flutter wave |
| HR | Heart rate |
| ICD | Implantable cardioverter/defibrillator |
| IVR | Idioventricular rhythm |
| LA | Left atrial |
| LAE | Left atrial enlargement |
| LAP | Left atrial pressure |
| LBBB | Left bundle branch block |
| LVH | Left ventricular hypertrophy |
| mA | Milliamperes |
| MAT | Multifocal (or multiformed) atrial tachycardia |
| MCL | Modified chest lead |
| msec | Milliseconds |
| mV | Millivolt |
| NSR | Normal sinus rhythm (see RSR) |
| PAC | Premature atrial contraction |
| PEA | Pulseless electrical activity |
| PJC | Premature junctional contraction |
| PJT | Paroxysmal junctional tachycardia |
| PMI | Point of maximal impulse |
| PSVT | Paroxysmal supraventricular tachycardia |
| PTCA | Percutaneous transluminal coronary angioplasty |
| PVC | Premature ventricular contractions |
| PVR | Pulmonary vascular resistance |
| QTc | QT interval corrected for heart rate |
| RAE | Right atrial enlargement |
| RBBB | Right bundle branch block |
| RVH | Right ventricular hypertrophy |
| SA | Sinoatrial |
| SVR | Systemic vascular resistance |
| SVT | Supraventricular tachycardia |
| SSS | Sick sinus syndrome |
| TdP | Torsades de pointes |
| VF | Ventricular fibrillation |
| VSD | Ventral septal defect |
| VT | Ventricular tachycardia |
| WAP | Wandering atrial pacemaker (multifocal atrial rhythm) |
| WPW | Wolff-Parkinson-White syndrome |
| 1° AVBL | First-degree AV block |
| 2° AVBL | Second-degree AV block types I or II |
| 3° AVBL | Third-degree AV block |
Basic Electrocardiogram Waves
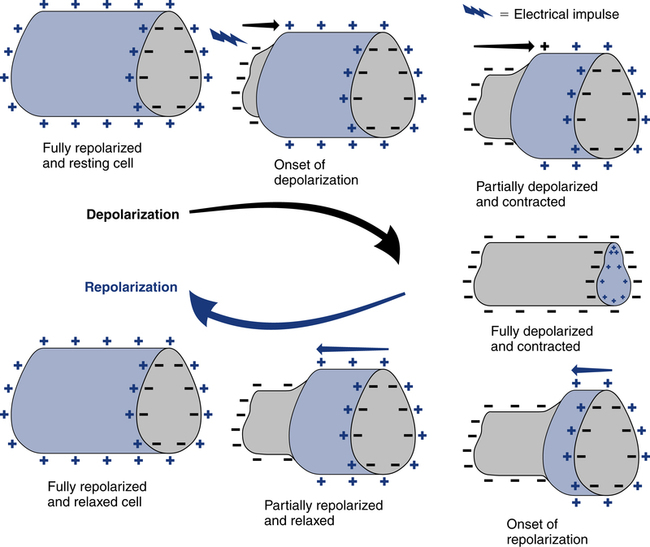
The spread of electrical stimuli throughout the heart by way of the action potential initially causes depolarization of the myocardial cells. Depolarization occurs when a polarized cell is stimulated. Polarized cells carry an electrical charge on their surface; the inside of the cell is more negatively charged than the outside of the cell. The sudden loss of the negative charge within the cell is called depolarization, which is a result of potassium moving out of the cell and sodium moving into the cell. The return of the negative electrical charge is called repolarization (Fig. 11-4) and is a result of potassium moving back into the cell and sodium moving out of the cell. This process of depolarization and repolarization produces waves of electrical activity that travel back and forth across the heart. These waves of electrical activity are represented by waves detected by the ECG electrodes. The magnitude or amplitude of each wave is determined by voltage generated by depolarization of a particular portion of the heart.
Depolarization of the atria corresponds with atrial contraction and creates the initial wave of electrical activity detected on the ECG tracing, known as the P wave (Fig. 11-5). Because the atria usually are small, the atria generate less voltage than the ventricles and the resulting P wave is small. Repolarization of the atria is not seen on the ECG because it usually is obscured by the simultaneous depolarization of the ventricles.
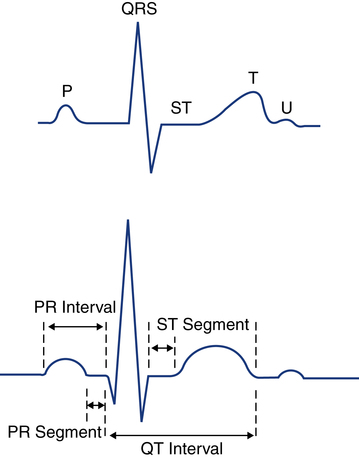
Depolarization of the ventricles corresponds with the ventricular contraction and is represented by the QRS complex. Because the ventricular muscle mass is larger than the atria and produces more voltage during depolarization, the QRS complex is normally taller than the P wave in most cases (see Fig. 11-5). Ventricular repolarization corresponds to ventricular relaxation between contractions and is seen as the T wave. The T wave is normally upright and rounded.
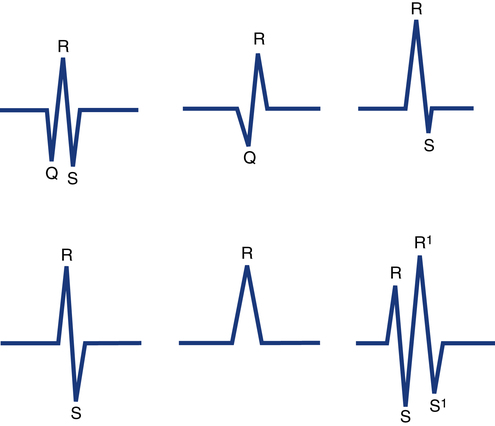
QRS complexes usually consist of several distinct waves, each of which has a letter assigned to it as a label. This labeling system is needed because the precise configuration of the QRS complex can vary from one lead to the next and from one patient to the next. To establish a standardized labeling system, several guidelines have been developed. If the first deflection of the QRS complex is downward (negative in lead II), it is labeled a Q wave. The initial upward (positive) deflection is called an R wave. The first negative deflection following an R wave is called an S wave (Fig. 11-6). If the QRS complex has a second positive deflection, it is labeled R′ (R prime), and if a second S wave is also present it is called S′ (S prime). A negative deflection can be called a Q wave only if it is the first wave of the complex. In clinical practice, each ventricular depolarization complex is called a QRS complex whether it has all three waves or not.
Electrocardiogram Paper and Measurements
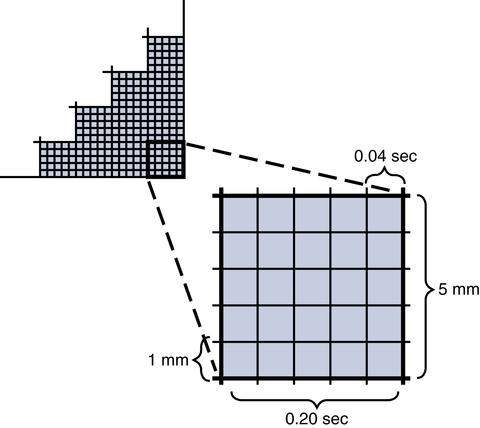
The electrical activity of the heart is recorded on paper that has gridlike boxes with light and dark lines running horizontally and vertically (Fig. 11-7). The light lines circumscribe small boxes (1 × 1 mm) and the dark lines circumscribe larger boxes (5 × 5 mm).
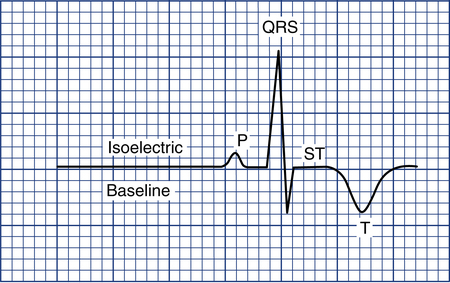
To measure the amplitude of a specific wave, the isoelectric baseline must be identified. This is the flat line seen just before the P wave or right after the T or U wave (Fig. 11-8). Any movement of the ECG stylus above this line is considered positive; any downward movement is considered negative. To measure the degree of positive or negative amplitude of a specific wave, the isoelectric line is used as a reference point marking zero voltage.
R waves are measured from the isoelectric line to the top of the R wave. Q and S waves are measured from the isoelectric line to the bottom of the wave (see Fig. 11-6). P waves can be either positive or negative and are also measured from the isoelectric line to the top (if positive) or bottom (if negative) of the wave.
The normal P wave is less than 2.5 mm in height and not more than 0.11 second in length. The PR interval is an important measurement that provides information regarding conduction time. This interval is measured from the beginning of the P wave, where the P wave lifts off the isoelectric line, to the beginning of the QRS complex (see Fig. 11-5). The PR interval represents the time it takes for the electrical stimulus to spread through the atria and to pass through the AV junction to the ventricles. The normal PR interval is between 0.12 and 0.20 second (3 to 5 small boxes). If conduction of the impulse through the AV junction is abnormally delayed, the PR interval will exceed 0.2 second. A prolonged PR interval is called first-degree AV block and is discussed later in this chapter.
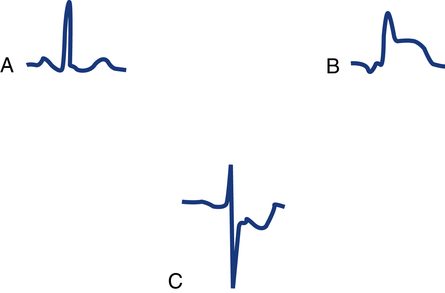
A very important segment to evaluate is the ST segment. This segment is the portion of the ECG cycle from the end of the QRS complex (even if no S wave is present) to the beginning of the T wave (see Fig. 11-5). It measures the time from the end of ventricular depolarization to the start of ventricular repolarization. The normal ST segment is isoelectric (no positive or negative voltage) or at least does not move more than 1 mm above or below baseline. Certain pathologic abnormalities, such as myocardial ischemia or injury, cause the ST segment to be elevated or depressed (Fig. 11-9). The duration of the ST segment is not as important as its configuration.
The QT interval is measured from the beginning of the QRS complex to the end of the T wave (see Fig. 11-5). This interval represents the time from the beginning of ventricular depolarization to the end of ventricular repolarization. The normal values for the QT interval depend on the heart rate. As the heart rate increases, the QT interval normally shortens; as the heart rate decreases, the QT interval increases. As a general rule, the QT interval that exceeds one half of the RR interval is prolonged if the heart rate is 80 beats/min or less. Common causes of an abnormally prolonged QT interval include hypokalemia (low potassium), hypocalcemia (low calcium), and the side effects of certain medications such as quinidine.


